|
|
- Advisories
- Forecasts
- Observations
- Java Tools »
- Related Information
- Contact Us
|
 |
|
ADDS - Icing Help Page (2 of 4)
Back to Icing Page or Icing help page 3
|
Current Icing Product
Introduction:
The Current Icing Product (CIP) is a supplementary (for increased
situational awareness) weather product that provides a graphical view of
the current icing environment. Input from weather sensors is provided to
software models to produce this automatically generated graphical weather
product. The CIP is updated hourly, and provides current information via
icing severity graphics and icing probability graphics. It is important
to note that all CIP products are not forecasts, but presentations of
current conditions at the time of the analysis ("Nowcast" information).
CIP is not to be used as a forecast for icing conditions.
NOTE: Pilots of aircraft that are not certified for
flight into known or forecast icing conditions should be especially
cautious of areas displaying any type of icing severity, regardless of
the probability indicated on CIP graphics.
|
Selecting CIP Graphics:
To retrieve a CIP graphic on the ADDS icing page,
select the specific graphic from the left-side pull-down menu.
The requested graphic should appear as an image embedded directly in
the icing page. The right-side pull-down menu allows you to select a
specific altitude, with a graphic every 2000 feet, starting at 1000 feet
and ascending to FL290. Besides the individual altitudes, you can select
a composite, maximum value of all altitudes, labeled "max." This image
provides a quick overview of the regional icing threat. The Flight
Path Tool allows access to CIP icing probability data for different
altitudes in 1000 foot increments, as well as vertical cross sections
for a specific route and a closer look at specific geographic areas.
Overview of CIP Display:
All graphics display icing severity in five categories consistent
with other weather reports: none, trace, light, moderate, and heavy.
Users should always keep in mind that the five levels of icing severity
depicted on the CIP graphic are general terms that are not specific to
a type of aircraft, flight condition (e.g., speed, angle of attack,
vertical speed, etc.), and are only intended to depict general icing
conditions for supplementing flight planning and situational awareness.
Essentially, light icing to one aircraft in one situation might not
necessarily be light icing to a different aircraft in another situation.
On icing severity graphics (sample shown in Fig. 2), the scale is from
trace (very light blue) to heavy (dark blue). On the icing probability
graphics (sample shown in Fig. 1), the scale is from 0 to 85%, using cool
to warm colors with warmer colors indicating higher icing likelihood.
Probabilities range from 0% (no icing expected) to 85% (near certain
icing). Probabilities do not reach 100% because the data available do
not allow for a diagnosis with absolute certainty.
Users can also "filter" or "mask" icing graphics by selecting icing
probabilities that are less than 25% or less than 50% (sample shown
in Fig. 3). Either selection uses a gray color to show areas where the
icing probability is less than the icing probability selected.
Supercooled Large Droplet (SLD) Icing:
SLD icing conditions are characterized by the presence of relatively
large, super cooled water droplets indicative of freezing drizzle and
freezing rain aloft. These conditions, which are outside the icing
certification envelopes (FAR Part 25 Appendix C), can be particularly
hazardous to aircraft. SLD icing threats are indicated on all Icing
Severity graphics by a red hatched region (sample shown in Fig. 4).
PIREPS:
Pilot reports (PIREPs) of icing that occur within 1000 feet of the
selected altitude are overlaid on the single-level graphics (legend
found at the bottom of each graphic). On the composite graphic, PIREPs
for all altitudes are shown (except negative icing reports, which are
omitted for the sake of clarity).
|
Fig.1: Icing probability
Fig.2: Icing severity
Fig.3: Masked icing severity
Fig.4: Severity with SLD overlay
|
Additional Information:
Those interested to learn more details of the science used to create CIP are invited
to read the following paper:
-
Bernstein, B.C., F. McDonough, M.K. Politovich, B.G. Brown, T.P. Ratvasky,
D.R. Miller, C.A. Wolff and G. Cunning, 2005: Current Icing Potential (CIP):
Algorithm description and comparison with aircraft observations. J. Appl.
Meteor., 44, 969-986.
|
Example event: 16 Feb 2005
On 16 Feb 2005, a cold front moved through the Great Lakes region and into
the Appalachians leaving widespread icing conditions in its wake. As part
of the development work behind the CIP product, researchers from NASA and
NCAR purposefully fly into known icing conditions. This event was chosen
because a team of researchers flew into the clouds and icing conditions
in the area around Cleveland, Ohio on this day. They encountered primarily
small supercooled water drops between 5500 and 6000 feet MSL that produced
periods of moderate icing. Photos of this icing encounter are shown at
right. Note the build-up of ice on the leading edge of the wing of the
NASA Glenn Research Center Twin Otter.
A series of graphics created from CIP data at 1500 UTC are shown
above. The small graphics here display the region around Cleveland
whereas clicking on the figure produces the graphic for the entire CIP
domain. Note the yellow and orange hues on Fig. 1 denoting the highest
probability for icing south and east of Cleveland. Likewise, note the
region of moderate icing severity in Fig. 2 but lower probability and
decreased severity to the north and west (over Lake Erie). When the
Twin Otter briefly flew northwest of Cleveland, the crew confirmed the
sharp decrease in icing severity combined with significantly less liquid
water content but roughly constant temperature and droplet sizes. The
SLD product at the same altitude (not shown) did not depict any large
drops in the region around Cleveland and none was found by the research
aircraft. A SLD plot from 9000 feet seen in Fig. 3 shows SLD diagnosed
well to the south and east of Cleveland, but the research aircraft did
not fly in those areas so it was not confirmed.
|

Fig.5: Icing accumulates while in cloud. Photo credit: NASA Glenn Research Center
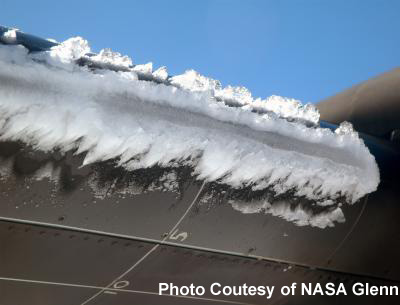 Fig.6: After ascending above cloud. Photo credit: NASA Glenn Research Center
|
|
|
|


