HAZUS-MH Map Series Templates and Posters
HAZUS-MH Map Series
The HAZUS-MH Map Series Templates have been developed to support risk assessments, mitigation planning and support for disaster operations. The map templates are available as Handouts or Posters.
HAZUS-MH Map Series
HAZUS Mapping for Decision Makers 
As more and more HAZUS-MH maps and analyses are generated by a growing group of HAZUS-MH users, it is important to document best practices. This map (see graphic at right) shows HAZUS-MH map examples from around the country detailing HAZUS information for Earthquake, Flood, and Wind scenarios.
Also see Mapping for Decision Makers which shows HAZUS-MH along with other map products examples.
Using HAZUS-MH for Mitigation Planning Efforts. Earthquake Model Scenario: San Bernadino Segment of the San Andreas Fault Zone 
HAZUS earthquake model scenario based on a 7.5 magnitude earthquake (the maximum for this fault segment identified by the U.S. Geological Survey) affecting the San Bernardino segment of the San Andreas Fault Zone. Based on software-supplied data (level 1), this map shows the Peak Ground Acceleration (PGA) of the fault segments, red being the most acceleration. This map includes the percent of functionality for the Highway Bridges, Fire Stations, Hospitals, and Schools categories on the third day after the event. The earthquake model helps jurisdictions adapt their mitigation planning and facility coordination. This map was prepared for the Agua Caliente Band of Cahuilla Indians’ Pre-Disaster Mitigation (PDM) plan. View larger map graphic.
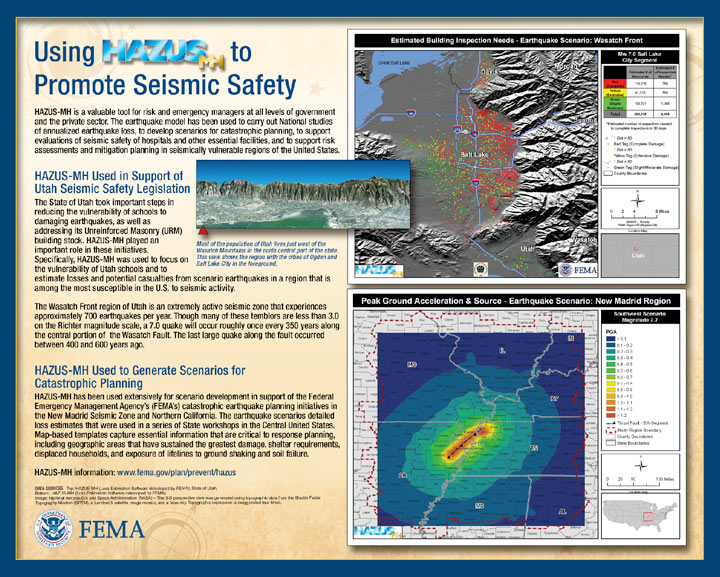
Using HAZUS-MH to Promote Seismic Safety 
The HAZUS-MH earthquake model has been used to carry out National studies of annualized earthquake loss, to develop scenarios for catastrophic planning, to support evaluations of seismic safety of hospitals and other essential facilities, and to support risk assessments and mitigation planning in seismically vulnerable regions of the United States. This poster showcases 2 examples: 1) HAZUS-MH Used in Support of Utah Seismic Safety Legislation. The State of Utah took important steps in reducing the vulnerability of schools to damaging earthquakes, as well as addressing its Unreinforced Masonry building stock. HAZUS-MH played an important role in these initiatives; and, 2) HAZUS-MH Used to Generate Scenarios for Catastrophic Planning. The earthquake scenarios of the New Madrid Earthquake Region detailed loss estimates that were used in a series of State workshops in the Central United States. View larger map graphic.
Using HAZUS-MH and GIS to Measure Mitigation Successes - Red River Flood
April 2007 marked the ten-year anniversary of the Grand Forks Red River Flood Disaster, which caused $3.7 billion in total losses in North Dakota. In 2006, a severe flood of the same river resulted in only $6.5 million in total losses. The reduction in total losses resulted from a partnership between FEMA, North Dakota, and localities. This poster shows the mitigation successes that resulted from this partnership.
HAZUS Evaluation of 1906 Magnitude Earthquake in Today’s Environment - Displaced Households 
HAZUS-MH was used in the preparation of a study of building damage and losses likely to occur due to a repeat of the 1906 San Francisco earthquake. The map shows estimates of Displaced Households from a repeat of the 1906 event. HAZUS-MH also estimates short-term shelter requirements. These products are very useful in assessing potential short-term shelter and long-term housing requirements following a major earthquake.
HAZUS-MH Evaluation of 1906 Magnitude Earthquake in Today’s Environment - Economic Loss
Depicted in this map are direct economic losses from a possible recurrence of the 1906 event. These losses include capital stock losses and income losses. These estimates are useful in quickly estimating the distribution of economic losses from earthquakes.
Hurricane Katrina Estimated Water Depth for HAZUS-MH Loss Estimation, New Orleans, Louisiana 
This poster displays the estimated equilibrated water depth for central New Orleans. Parts of the city in close proximity to a levee breach may have experienced greater water depths. The data were used to calculate volumes for the unwatering of the City of New Orleans. FEMA’S National Flood Insurance Program used the data to expedite flood insurance claims.
HAZUS-MH Building Counts Affected: 100-Year Flood Exceedance and Potential Elevation Requirement, New Orleans, Louisiana
The map displays the 100-year flood exceedance and potential elevation requirements for central New Orleans, LA. The purpose was to quickly identify potential elevation requirements for structures damaged 50 percent or more as per the NFIP. The 100-year flood exceedance was determined using field surveyed high watermarks and the 100-year BFE taken from current effective FIRMs.
HAZUS-MH Estimated Peak Gust Wind Speeds: Hurricane Katrina
Displays the estimated 3-second peak gust windspeeds produced by Katrina. Windspeeds are displayed by census tract and are intended to provide an overview of areas suffering from the greatest windspeeds.
Potential Loss of Functionality: Hospitals, Hurricane Katrina
This poster describes a map that displays the potential loss of functionality (in days) for hospitals within close proximity to landfall of Hurricane Katrina. It also shows the estimated surge inundation from the National Hurricane Center Slosh Model. The purpose of this map is to identify potential damages to hospitals due to wind speeds and to identify potential exposure to storm surge.
Design Level Exceedance - Peak Gust Wind Speeds, Hurricane Katrina
This map shows areas where the 3-second wind gusts from Hurricane Katrina exceeded the American Society of Civil Engineers (ASCE) 7 building design levels. These levels are displayed by the census tract and are intended to show the areas likely to suffer damage due to design level exceedance. These are areas where the performance of structures built to design recommendations may be compromised.
Last Modified: Tuesday, 08-Jul-2008 11:30:16 EDT
Contacts
- Download from the FEMA Library.
- Publications Warehouse
To order free FEMA publications:
- Call 1 (800) 480-2520
(M-F: 8:00 a.m. - 5:00 p.m. est)
- Or write to:
FEMA
PO Box 2012
Jessup, MD 20794-2012
- Or fax: (301) 362- 5335
- Please provide the title, item number, short number, and quantity of each publication, along with your name, address, zip code, and daytime telephone number.
 Email Updates