|
||||||
|
|
||||||
 Loading image. Please wait.
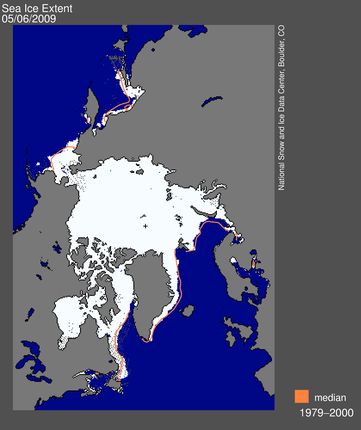
These images, derived from passive microwave satellite data, depict average sea ice conditions for last month. Extent images show the total area of ocean covered with at least 15 percent ice. Concentration images show varying degrees of ice coverage, from 15 to 100 percent. Concentration trend and anomaly images highlight decadal variances.
The graph at right compares annual minimum extent to the 1979-2000 mean. See the Sea Ice Index documentation for more information.
These satellite-derived images depict current sea ice conditions and trends. Long-term changes in Arctic sea ice are an index of climate change. Southern Hemisphere sea ice images are also available. For more information about current conditions and their significance, see Arctic Sea Ice News and Analysis.

 Browse, Compare, and Animate Images
Compare data images with the Browse Image Spreadsheet Tool (BIST).
Animate extent, concentration, and other sea ice images using the Sea Ice Animation Tool.
View sea ice Earth Browser images on NSIDC Virtual Globes.
 Archived Data and Images
See the Archived Data & Images page to download text and image files with monthly sea ice extent and area.
|
|
|
||||||