|
|


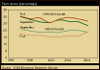
| Farm
Income |
127.5% |
|
|
2007: Farm
household income relative to average U.S. household
income. |
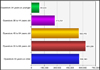
| Trade |
23.8%
p |
|
|
| 2007:
Exports' share of the volume of U.S. farm production. |
| Food
Prices |
214.1 |
|
|
| 2008:
CPI for food (1982-84 = 100) |
| Food
Markets |
9.8% |
 |
|
| 2007:
Share of U.S. personal disposable income spent on
food. |
| Poverty |
5.5% |
|
|
2007:
Nonmetro-metro difference in poverty rates.
|
Get more indicators on
agriculture, trade, diet, health, natural resources,
and rural America.
p=preliminary
Agricultural
Outlook Tables |
|

|