|
|
 |
|
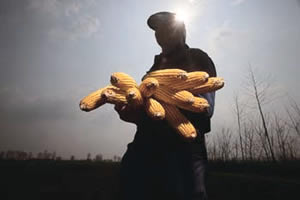
The financial condition of U.S. farmers and other agricultural stakeholders is expected to improve in 2003. Net farm income, a measure of the sector's profitability, is forecast to be up $17 billion (49 percent) from the $35.6 billion earned in 2002 and about 10 percent above the 10-year average. Weather through July was favorable for crop production with the corn harvest projected to total a near-record 10 billion bushels. Prices available to farmers have been rising because of strong domestic and foreign demand. Government payments to farmers are up substantially. With continued appreciation in farmland prices, supported by the demand for farmland for nonfarm purposes (recreation, for example), the balance sheet for the farm sector continues to strengthen. The farm sector is forecast to contribute $97.3 billion to the U.S. economy in 2003, exceeded only by the $97.7 billion in net value added in 1996. Net value added is a measure of the income earned by those contributing resources to agricultural production. Of the total, $44.7 billion is projected to be earned by the stakeholders--laborers, landlords, and lenders--who contribute resources for a predetermined payment, thereby avoiding the risks inherent in production and marketing. The residual, $52.6 billion, is net farm income and will accrue to farm operators and contractors, who contribute resources with the expectation of receiving financial rewards for sharing in the risks of production. Production value and expenses will rise Crops, livestock, and the service/forestry sectors of the agricultural economy will contribute to the sectorwide increase in value of production, with crops up by $11 billion and livestock by more than $7 billion over 2002. Government payments are projected to be up $8.6 billion in 2003. Higher production expenses are expected to offset no more than 30 percent of the rise in value of production and government payments. In 2003, total production expenses are forecast to rise by $10.9 billion (5.7 percent), the largest increase since 1997. Feed, purchased livestock, fertilizers, and hired labor make up the largest expense components. For 2003, there is a forecast rise of between 3 and 6 percent across the whole range of expenses. The largest increase is a 21-percent rise in fuel and oil expenses, due primarily to a 24-percent increase in composite (foreign and national) prices for petroleum. Double-digit increases are also projected for fertilizer, due to higher prices; marketing, storage, and transportation, due to a rise in general input prices and the anticipated 8-percent increase in crop output; and net rent to nonoperators, due to the increase in crop output and government payments. The only expense likely to fall in 2003 will be non-real estate interest as the result of a decrease in interest rates. Incomes of farm households continue to rise in 2003
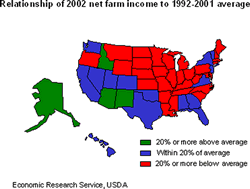
Farm operators’ household income will continue to rise in 2003 for the third straight year. Forecast at $67,603, average income will be 2.8 percent higher than the $65,757 earned in 2002. Off-farm and farm sources of earnings will both contribute to the increase in household income. Higher crop and livestock receipts and an increase in government payments of about $4,000 per operator household contribute to higher self-employment income from farming. The dominant source of earnings for farm households, on average, will continue to be income earned from off-farm sources. These include both earned sources such as wages and salaries and unearned sources such as Social Security and other public programs. Off-farm income is expected to rise about 2 percent, on average, to $63,635 this year. At this level, off-farm sources of income will account for about 94 percent of the total incomes of operator households. Income prospects differ among farms Net cash income represents funds that are available to farm operators to meet family living expenses and make debt payments. Nationally, farm businesses' net cash income is forecast to increase by 14 percent in 2003. Not all farm types or regions will experience similar income growth. Differences in the value of crop and livestock production, levels of government payments, and the levels and types of inputs purchased by farmers account for the diversity of income prospects in 2003. Average net cash incomes are expected to be higher for all livestock farm businesses. Farms that specialize in cattle and hog production will see the largest income gains. Even with lower production, prices will increase enough so that receipts outpace increases in expenses. Hog production is in the beginning stages of a cyclical decline, while the number of cattle placed in feedlots is declining sharply and slaughter weights have declined due to higher feed prices. Producers of specialty crops (vegetables, fruits, nursery products) are especially susceptible to higher energy and labor costs (the fastest rising expense categories in 2003). Lower average income is expected for these farms, since modest gains in receipts will not be enough to compensate for higher expenses. Producers of grains and field crops, on the other hand, expect higher increases in average net cash income. Wheat producers should see the greatest increase (75 percent) with their largest crop since 1999, a boost in exports, and a near doubling of government payments. Higher prices and higher government payments will also contribute to a substantial increase in 2003 average net cash farm income for soybean and cash grain farms. Concentration of commodity production explains much of the regional variation in the income outlook for farm businesses. In 2003, income prospects improve for most regions. The only exception is the Fruitful Rim, where mostly specialty crops are grown. The Prairie Gateway (cattle, wheat, and cotton) and Mississippi Portal (cotton, soybeans, hogs) will have the largest increase in average net cash income. Even with the income recovery expected in 2003, several regions' income will remain below the 1998-2002 average. In addition to the Fruitful Rim, these include the Eastern Uplands, Northern Crescent, and Heartland. Farm balance sheet continues to strengthen through 2003
U.S. farm business sector assets in 2003 are forecast to rise 3.2 percent from $1.29 trillion in 2002. The value of farm real estate, accounting for 80 percent of the sector's assets, is expected to increase by 3 percent. The increase in 2003 net cash income is anticipated to support further growth in farmland values, though at a slower rate than the rapid gains of 5 percent in 2002, 5.2 percent in 2001, and 6.8 percent in 2000. On average, farm real estate values grew 4 percent annually during the 1990s. Farm business debt is expected to rise about 3 percent in 2003, approaching $206 billion by the end of the year. Farm debt reached nearly $201 billion at the end of 2002, surpassing its previous record level (in nominal terms) of $193.8 billion set in 1984. Sector equity (net worth) is expected to rise more than 3 percent in 2003, as the gain in asset values exceeds the increase in debt levels by about $36 billion. The farm business balance sheet has stabilized over the last 10 years. Debt-to-asset ratios for the farm sector have ranged between 15.5 percent and 16 percent since 1993, as increases in debt typically have been offset by larger gains in farm asset values. With farm real estate values rising faster than farm mortgage debt, the degree of farmland leverage has declined slightly. This has provided farm investors with an added equity cushion to lessen the impact of any short-term declines in income or asset values. Despite several years of weak commodity prices, owning a farming
operation has been an important wealth-building tool for many farm
operator households. The average value of farm assets on family
farms is expected to approach $665,000 in 2003. With average farm
debt of about $65,000, the calculated average net worth of family
farm businesses is expected to approach $600,000.
|
The ERS Farm Income and Costs Briefing Room.
|