Technology, Larger Farm Size Increased Productivity
on U.S. Hog Farms
Technological innovation
and shifts to larger, more specialized hog operations
have led to increases in productivity, reduced production
costs, and lower hog prices.
Nigel
Key and William
D. McBride
|
|
|
|
U.S.
hog production has shifted rapidly to
fewer and larger operations that specialize
in a single phase of production and
use production contracts. |
|
|
Substantial
productivity gains for hog farms, particularly
specialized hog-finishing operations,
have resulted in reduced costs of production
and contributed to lower prices for
hogs at the farmgate.
|
|
|
Technological
innovation and increasing farm size
each explain about half the gains in
hog farm productivity between 1992 and
2004. | |
| This
article is drawn from . . . |
| The
Changing Economics of U.S. Hog Production,
by Nigel Key and William McBride, ERR-52,
USDA, Economic Research Service, December
2007.
|
| You
may also be interested in . . . |
| Characteristics
and Production Costs of U.S. Hog Farms,
2004, by William McBride and Nigel Key,
EIB-32, USDA, Economic Research Service, December
2007.
“Decomposition of Total Factor Productivity
Change in the U.S. Hog Industry,” by
Nigel Key, William McBride, and Roberto Mosheim,
in Journal of Agricultural and Applied
Economics. Vol. 40, No. 1, April 2008.
|
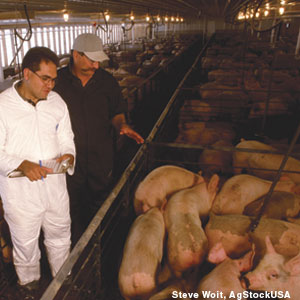
Today’s hog sector bears
little resemblance to the one that existed 15 years
ago. There are fewer hog farms, and the average
number of hogs per farm has increased substantially.
Most production occurs under contracts with processors.
Under those arrangements, processors supply feed,
feeder pigs, and veterinary services to growers
who receive a fee for providing the capital, utilities,
and labor used to grow the hogs to market weight.
Production contracts encourage individual producers
to specialize in a single phase of production rather
than combining all phases on one hog farm, as in
the traditional farrow-to-finish approach. The past
15 years have also seen substantial geographical
movement of production into States outside of the
Corn Belt, especially North Carolina, Oklahoma,
and Utah.
The structural transformation
of the hog sector has been driven in part by technological
advances in livestock genetics, nutrition, housing
and handling equipment, veterinary and medical
services, and management. These changes have contributed
to large increases in hog-farm productivity, which
have exerted downward pressure on hog and pork
prices. As the industry has changed, hog producers
have adjusted the size, organizational structure,
and technological base of their operations to
remain competitive. Recent ERS research combines
information from surveys of hog producers at three
points in time to document how the hog sector
changed between 1992 and 2004 and to measure the
level and sources of the hog-farm productivity
gains.
Industry Scale and Specialization
Increasing
Although the number of farms with
hogs dropped over 70 percent from more than 240,000
in 1992 to fewer than 70,000 in 2004, the U.S. hog
inventory remained stable at about 60 million head.
Thus, hog production consolidated considerably during
this period as fewer and larger farms accounted
for an increasing share of total output. Although
this is not unusual for U.S. livestock production,
consolidation in hog production was among the most
rapid of all livestock types.
The average size of U.S. hog operations
grew from 945 head in 1992 to 4,646 head in 2004.
The share of the hog inventory on operations with
2,000 or more head increased from less than 30 percent
to nearly 80 percent, with operations having 5,000
or more head accounting for more than 50 percent
of the hog inventory by 2004.
Traditionally, individual hog
farms, known as farrow-to-finish operations, managed
all phases of hog production from breeding to slaughter.
Today, farrow-to-finish operations have given way
to large operations that specialize in one of the
three major life-cycle phases of production: farrow-to-wean,
wean-to-feeder pig, or feeder pig-to-finish. In
1992, 65 percent of hogs came from farrow-to-finish
operations, while only 22 percent came from specialized
hog-finishing operations. By 2004, only 18 percent
came from farrow-to-finish operations, while 77
percent came from specialized hog finishers.
Changes in scale and specialization
have been made possible, in part, by substantial
growth in the use of production contracts. Hog operations
with production contracts grew from 5 percent of
operations in 1992 to 67 percent in 2004. Production
contracts govern the relationship between hog growers
and owners (“integrators” or “contractors”),
specifying the inputs provided by each party and
their compensation. Because contractors typically
provide feeder pigs and feed to growers and handle
the marketing, such an arrangement facilitates growers’
specialization in one phase of production.
The increasing use of production
contracts has also promoted farmers’ specialization
in the hog enterprise. Because contractors supply
feed from off-farm sources to their growers, individual
growers can use their time and financial resources
to increase the scale of hog operations rather than
expand crop acreage to produce feed. Between 1992
and 2004, hog production as a share of the total
production value on hog farms increased from 46
to 71 percent. At the same time, hog farms grew
a smaller share of their hog feed: the share of
grain produced on their farms for hog feed fell
from about half to below 20 percent.
Farm Productivity Gains
Mean Lower Production Costs
Hog farms, particularly the specialized
feeder pig-to-finish operations that are more likely
to use production contracts, showed large increases
in productivity between 1992 and 2004 (see box,
“How Do We Measure Productivity?”).
The average quantity of feed required per hundredweight
gain declined 44 percent for feeder pig-to-finish
operations, and the average quantity of labor used
fell 83 percent.
Farrow-to-finish operations exhibited
smaller productivity gains than feeder pig-to-finish
operations. For farrow-to-finish operations, the
average quantity of feed required per hundredweight
of gain declined by only 15 percent over the period,
while the average quantity of labor used per hundredweight
declined by 52 percent. The stronger productivity
growth of feeder pig-to-finish operations, compared
with farrow-to-finish operations, helps account
for the growth in their share of finished hog output.
Productivity gains contributed
to a decline in production costs between 1992 and
2004. For all farrow-to-finish hog producers, average
production costs (in 2004 dollars) per hundredweight
of gain were 28 percent lower in 2004 than in 1992.
This change amounts to a 2.7-percent average annual
rate of decline. Real costs declined faster for
feeder pig-to-finish hog producers, falling 44 percent
between 1992 and 2004, or 4.7 percent annually.
Structural change in the U.S. hog
industry is the outcome of economic competition
to increase farm productivity and lower production
costs. If larger operations are more profitable
than smaller ones, competitive pressures may be
expected to result in a larger average farm size
in the long run. Similarly, operations that are
first to adopt a cost-saving technology, are in
regions with lower input costs, or are closer to
markets have a competitive advantage that makes
them more likely to survive and grow. Business relationships
between growers and processors also evolve to reflect
productivity gains from increased specialization
of the various phases of hog production on separate
operations.
Technology and Structural
Change Drive Farm Productivity Gains
Recent technological innovations,
made possible in part by investments in research
and development, include advances in genetics, nutrition,
housing and handling equipment, veterinary and medical
services, and management practices. The use of artificial
insemination (AI) to improve genetic potential and
conception rates has spread widely. According to
the National Animal Health Monitoring System (NAHMS),
73 percent of sows were impregnated using AI by
2000, compared with only 1 percent in 1990. The
use of “all-in/all-out” housing management,
which commingles pigs of a similar age and weight
and keeps the entire group together as it moves
through each production phase, also increased from
25 percent of finishing-hog operations in 1990 to
57 percent in 2000 (accounting for about 85 percent
of finished hogs produced). All-in/all-out management
allows hog producers to tailor feed mixes to the
age of their pigs (instead of offering either one
mix to all ages or having to offer several different
feed mixes at one time). All-in/all-out also helps
limit the spread of infections to new arrivals by
allowing for cleanup of the facility between groups
of hogs being raised.
Specialized hog producers were
more likely than farrow-to-finish operations to
use innovative practices. Specialized farrowing
operations used AI, commercial high-quality breeding
hogs, and terminal crossbreeding—where all
replacement females are purchased from outside suppliers—more
often than farrow-to-finish operations. Specialized
feeder pig-to-finish operations used phase feeding—where
hogs or pigs are fed diets of varying protein and
energy at different phases of life to match their
changing nutritional requirements—and all-in/all-out
management of finishing facilities more often than
farrow-to-finish operations.
Larger hog operations tend to
use more innovative technologies. In 2004, AI was
used on only 4 percent of the farrow-to-finish operations
with fewer than 500 head, but on 92 percent of operations
with at least 5,000 head. Because large, specialized
hog operations can spread fixed costs over more
production and more easily take advantage of resulting
productivity gains, they are better able to invest
in current hog-production technologies. The survey
data show increasing returns to scale—per
unit production costs decline as the scale of production
increases. With scale economies, farms should be
able to reduce their unit costs as they expand.
Then, as smaller farms leave the business and larger
farms enter and expand further, industrywide costs
should fall.
After analyzing the changes in
hog farm productivity between 1992 and 2004, ERS
estimates that almost all farm productivity gains
could be attributed to increases in the scale of
production and technological innovation, with each
factor accounting for about half of the total increase
in farm productivity over the period.

|
Feeder pig-to-finish
farm size and productivity grew rapidly |
| Item |
|
|
|
|
Farm size (hogs sold/removed) |
804 |
2,756 |
4,730 |
Productivity measures: |
Feed conversion rate (lbs per cwt gain) |
383 |
282 |
214 |
Labor rate (hrs per cwt gain) |
0.89 |
0.24 |
0.15 |
| Source:
USDA, Economic Research Service using data
from the 1992 Farm Costs and Returns Survey
and 1998 and 2004 Agricultural Resource Management
Surveys. |
Productivity Gains Should Continue
ERS researchers estimate that
relatively small productivity gains can be achieved
solely by further increases in scale for the largest
operations (operations with output of more than
25,000 hundredweight gain) using current technologies.
However, for operations that produce less than an
annual total of 25,000 hundredweight gain, there
appears to be scope for future productivity gains
in the hog-production sector from further increases
in scale. Scale can be increased by smaller farms
expanding or smaller farms being replaced by larger,
new farms. In addition, the rate of technological
innovation showed no signs of abating from 1998
to 2004, compared with 1992 to 1998. This suggests
that new research and the adoption of more efficient
methods of hog production will prolong the sector’s
productivity gains into the foreseeable future.
How Do We Measure Productivity?
Productivity is a measure
of how much output can be produced for a given
quantity of inputs, or equivalently, how many
inputs are required per unit of output. Output
can be measured as the number of hogs sold
or removed in a year or as the hogs’
weight gain: the weight of hogs sold or removed
under contract less the weight of hogs purchased
or placed under contract, plus the weight
of inventory change each year.
When there are multiple
inputs, total factor productivity (TFP) is
the quantity of farm output per unit of an
aggregate input, where the inputs are usually
combined using weights based on prices. A
farm’s productivity reflects the production
technology available (which determines the
rate at which inputs can be combined to make
outputs), the degree to which the farm is
operating at an efficient scale of production,
the efficiency with which inputs are combined
given the production technology, and the degree
to which the farmer takes into account the
relative prices of inputs. Partial factor
productivity is the quantity of output produced
per unit of a single input. ERS uses inverse
partial productivity measures (for example,
lbs of feed per cwt gain) in this article
because these are easier to interpret than
the TFP, which is a unitless index.
|
|