|
Copyright © 2008, Eli Lilly and Company and the National Institutes of Health Chemical Genomics Center. All Rights Reserved. For more information, please review the Privacy Policy and Site Usage and Agreement.
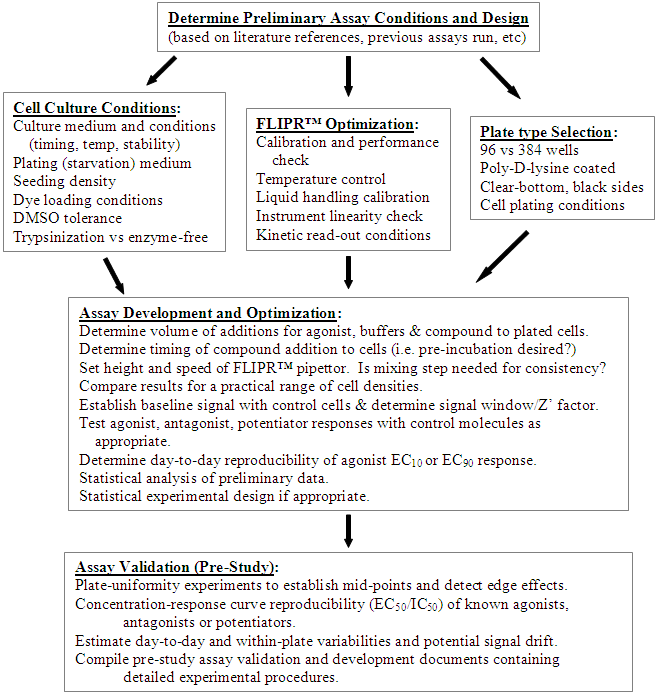
- OVERVIEW: FLIPR™ ASSAY DEVELOPMENT
- INTRODUCTION
- TYPES OF FLIPR™ FORMATS
- REAGENTS AND BUFFERS FOR METHOD DEVELOPMENT
- METHOD DEVELOPMENT AND OPTIMIZATION
- FLIPR INSTRUMENT SET-UP
- POTENTIAL ARTIFACTS
- REFERENCES
Reagents Needed:
- Cell line(s) expressing GPCRs, ion Channels, and coupling proteins.
- Control cell line without target.
- Suitable fluorescent dye (e.g. Fluo-3AMA, Calcium 4, etc).
- Suitable agonist or ion channel modulators.
- Standard antagonists, potentiators, and control compounds.
- Appropriate buffer solutions, additives, etc.
The introduction of FLIPR™ (Fluorescence Imaging Plate Reader) in the 1990's provided biologists with a fast and easy method of detecting GPCR activation through changes in intracellular calcium concentration. By coupling receptors to Gq proteins which stimulate intracellular calcium flux upon binding, a functional response can be measured using calcium-sensitive dyes and a fluorescence plate reader. The FLIPR™ instrument has a cooled CCD camera imaging system which collects the signal from each well of a microplate simultaneously. The FLIPR™ can read at sub-second intervals, which enables the kinetics of the response to be captured, and has an integrated pipettor that may be programmed for successive liquid additions.
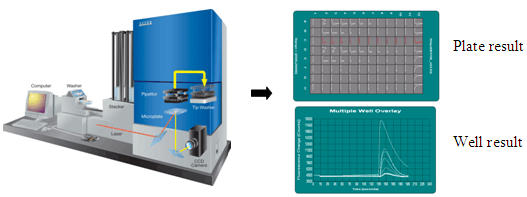
Figure 1. Diagram of a FLIPR™ instrument and typical kinetic tracings. The FLIPR™ collects a signal from each well of a multi-well plate at sub-second intervals, which captures and records a kinetic tracing of the calcium flux response. By successive additions to the same well, the FLIPR™ instrument allows one to distinguish between agonist, antagonist and allosteric modulators.
The integrated pipettor capabilities of the FLIPR™ provide an opportunity to detect agonists, antagonists, and allosteric modulators of GPCRs all in one assay. In the first addition, compounds of screening interest are added. The timing can be adjusted to allow for a pre-incubation period with the compounds, and agonist activity is detected by monitoring the calcium flux response in this step. In the second addition, a small amount of a known agonist that results in ~10% of maximal response is added to detect potentiator activity. The third addition consists of a maximal concentration of known agonist (~90% of the maximal response) to test for antagonism. This experimental design can encompass either two or three additions depending on the specific responses to be detected.
The FLIPR™ has also been utilized to screen ion channel targets using membrane permeable fluorescent dyes, such as the bis-oxanol dye DiBAC4(3), to measure changes in membrane potential. Compared to the rapid sub-second kinetics of channel opening observed by electrophysiology approaches, redistribution of the dye often takes minutes to produce a measurable response, and has prompted the development of more rapid dyes compatible with the FLIPR™.
GPCR targets that naturally couple via Gq produce a ligand-dependent increase in intracellular Ca+2 that can be measured using a calcium-sensitive dye. GI/o-coupled GPCR receptor activation can be “switched” to induce an increase in intracellular calcium in two ways: by the use of chimeric G-proteins (Gαqi5 or Gαqo5), or by engineering the cells to over-express a promiscuous G-protein (G α16 or Gα15).

Figure 2. GPCR targets that couple via Gq naturally produce an increase in intracellular Ca+2 that can be measured using calcium-sensitive dyes and a FLIPR™ instrument. GPCR targets that naturally couple via GI/o can be adapted to respond to agonist with a ligand-dependent increase in intracellular calcium by the use of chimeric G-protein or by the introduction of an over-expressing promiscuous G-protein (G α15 or G α16).
The integrated pipettor capabilities of the FLIPRTM, as well as internal software modifications, provide an opportunity to detect agonists, antagonists, and allosteric modulators all in one assay. One-, two-, or three-addition assays may be performed depending on the desired assay format. A one-addition assay can be performed to detect agonists, where the compound of interest is added to look for a response. This mode could also be used to look for allosteric modulators or antagonists if the test compounds are added “off-line”, although this is not the preferred method of operation. Until 2006, the two-addition assay was the standard assay format. In this method, the test compounds are added in the presence of an EC10 dose of the agonist in the first addition to detect agonists or allosteric modulators. The second addition is an EC90 dose of the max control to identify antagonists. While this scheme works, it requires a secondary assay to distinguish the agonists from the allosteric modulators; this need was abolished by the advent of a three-addition assay. In the three-addition mode, you can detect all three modes of activity in a single assay, saving considerable time and reagents. Another advantage found during testing of the three-addition assay was better mixing and a pre-incubation of the cells with compound resulting in better identification of potentiators.
Typical assay formats and the resulting curves are summarized below (Table 1).
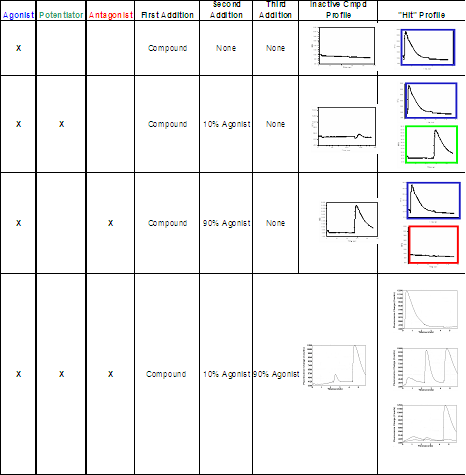
Table 1. Typical FLIPR™ Assay Formats
Ion channel targets with significant Ca+2 permeability, such as the iGluRs, produce an increase in intracellular calcium that can be measured using calcium-sensitive dyes and the FLIPR™ instrument. The methodology used is analogous to that for the GPCRs.
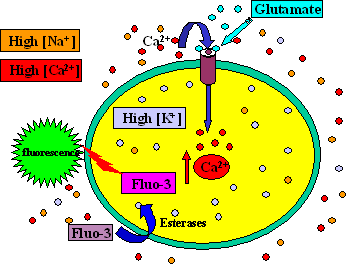
Figure 3. Schematic of the calcium flux response in ion channel targets.
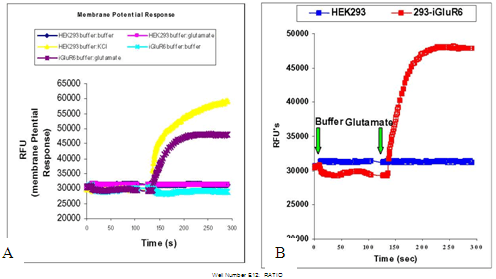
Ion channel targets such as the iGluRs with ion permeability that significantly affects the membrane potential can be measured using a membrane potential dye and the FLIPR™ (see Baxter, et al).

Figure 4. Measuring changes in membrane potential of ion channel targets.
It is critical to ensure the appropriate cell lines expressing the target, control agonist and antagonist standards are available before beginning method development and validation. The minimal requirements are:
- Transfected cell line with the Gq-coupled hGPCR target. (eg. HEK293, CHO, THP-1 etc.). Receptors coupling through Gi, Go, Gs or Gz can be coupled to Gq via promiscuous G proteins as previously described.
- Parental cell line control without the target and grown under identical conditions.
- Agonist, antagonist, and allosteric modulator reference standards (with a wide range of potencies, if available).
- Poly-D-lysine coated 96- or 384-well plates.
- Appropriate cell growth media, buffer solutions, trypsinizing reagents.
- The reagents for ion channels are the same as for GPCRs, with the exception of the FLIPR™ buffer. It is recommended that 5mM calcium be used in the buffer for ion channel experiments. Since HBSS contains 1.3mM calcium, 3.7mM calcium chloride (Sigma) must be added prior to use.
- Additional reagents needed for a FLIPR assay:
|
Reagent
|
Manufacturer
|
|
Calcium dyes (Fluo-3, Fluo-4, Calcium 3, Calcium 4, etc.)
|
Molecular Probes, Molecular Devices
|
|
HBSS
|
BioWhittaker, Invitrogen
|
|
HEPES
|
BioWhittaker, Invitrogen
|
|
Probenecid (if needed)
|
Sigma
|
|
Pluronic Acid
|
Sigma, Molecular Devices
|
Early method development should include the following experiments to demonstrate the validity of the assay concept:
- Gq coupling (or promiscuous G-protein coupling) of the cells expressing the GPCR should be demonstrated. Load selected cell clones with Fluo-3AM or other suitable dye, trigger Ca+2 flux with a known agonist, and measure fluorescence signal. Select the clones with the most robust response.
- Determine whether cells need to be constantly maintained in culture or whether they can be prepared as frozen aliquots to be thawed and plated the day prior to the assay. The use of frozen cell stocks is a convenient and efficient alternative if it can be shown that the FLIPR™ signal is sufficiently robust and stable.
- Conduct dye-loading experiments. Select the combination of cell line, agonist and dye concentrations that produces the most significant signal window. Use a control cell line without receptor expression to establish signal base line. Choose between use of cells in culture and frozen cell stocks.
- Conduct preliminary experiments to establish a reasonable cell density that could be further optimized in subsequent experiments as described below.
- Using a known antagonist or potentiator, demonstrate that the Ca+2 mobilization induced by the agonist can be blocked or enhanced, respectively.
- Test poly-D-lysine coated plates with selected cell lines and conditions demonstrated in preliminary experiments. Select the plate with a stable and acceptable signal window.
- Establish preliminary growth conditions and DMSO tolerance for the selected cell line.
Statistical experimental design can be employed to optimize these conditions and the following factors should be included:
- Cell clones
- Cell seeding density/well
- Type of dye (wash vs. no-wash)
- Dye loading concentration
- Dye loading temperature
- Dye loading duration
- Coated plate type
- Buffer additives: eg: probenecid, concanavalin A, etc.
- Height, speed and mixing of FLIPR pipettor
- Volume of addition
Notes on optimization experiments for GPCR targets coupled to Ca+2 mobilization:
Some general points regarding a FLIPR™ assay for GPCRs need to be noted:
- Some receptors contain trypsin-sensitive sites in their extracellular domain that results in a loss of response if the cells are harvested by trypsinization. In these instances, cells should be harvested by either scraping or using enzyme-free dissociation buffer.
- Care should be taken when removing media and dye from the cell plate. It is common for mechanical aspiration to disrupt the cell monolayer, resulting in a deterioration of the assay performance. It is recommended to manually invert the plate and shake or “flick” the liquid out of the plate and blot onto paper towels if you are using a dye that requires washing.
- Several no-wash dyes are commercially available. Testing of multiple dyes is strongly recommended, as signals differ widely. Depending on the receptor studied, media may interfere with the no-wash dyes, so testing both with and without media may be required. An example of the difference between the signal obtained from the traditional Fluo-3 dye and the new Calcium 4 no-wash dye is shown in Figure 5.
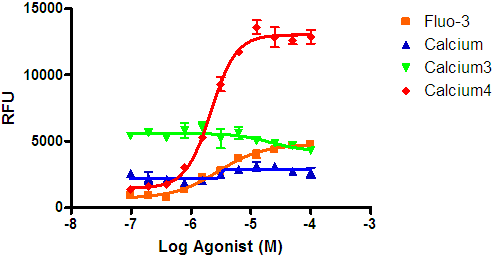
Figure 5: Comparison of different Ca+2 dyes on maximum response of a GPCR. In this example, a no-wash dye produced a significantly larger signal window than the traditional Fluo-3 dye. Signal windows are specific to receptors and cell lines, so it is recommended that testing be done during the initial optimization to ensure the appropriate choice of dye.
- Probenecid should be included in the dye and the buffer following dye loading whenever using CHO cells (5mM probenecid is sufficient). This prevents the release of dye from the cells back into the medium. AV12 and HEK293 cells do not require probenecid.
- CHO cells are dye-loaded at 37°C, whereas AV12 and HEK293 cells can be dye- loaded at 25°C.
- Poly-D lysine coated plates can improve the results obtained from some cell lines.
- Variability in the signal obtained on the FLIPR™ can sometimes be improved by adjusting the tip height or dispense speed on the FLIPR™.
- The standard assay buffer used in FLIPR™ experiments is HBSS with 20mM HEPES.
- The most common fluid addition volumes for a FLIPR assay are:
| |
Volume per Well
|
|
96-Well Format
|
384-Well Format
|
|
Dye
|
50ul
|
20ul
|
|
Buffer
|
50ul
|
20ul
|
|
1st addition in FLIPR
|
50ul
|
20ul
|
|
2nd addition in FLIPR
|
100ul
|
20ul
|
The development of a FLIPR assay generally requires the following experiments:
- Cell density determination and incubation time:
This is typically the first parameter that is examined. The best way to assess cell density requirements is to seed an entire assay plate at a single density; therefore, several plates are required to examine multiple cell seeding densities. The cells should be examined on the FLIPR™ using buffer in the first addition and a maximal concentration of agonist in the second addition. This will allow one to assess the extent of variability within the plate and detect any patterns in variability. The most common variability pattern we have observed is an edge effect which can usually be resolved by increasing the cell density or the humidity during incubation. We recommend examining the following cell densities for the indicated cell types:
| |
Seeding Densities (cells/wells)
|
|
Cell Line
|
96-Well Format
|
384-Well Format
|
|
AV12
|
30K, 40K, 50K, 60K
|
20K, 30K, 40K, 50K, 60K
|
|
CHO
|
10K, 20K, 30K, 40K
|
5K, 10K, 15K, 20K, 30K
|
|
HEK293
|
30K, 40K, 50K, 60K
|
20K, 30K, 40K, 50K, 60K
|
Some assays will perform best with a 24-hour incubation time prior to assay, while others may need a 48-hour incubation time.
- Dye loading time, dye concentration and temperature:
The optimal dye loading can range from 30 minutes to 2 hours depending on the cell line and the dye used. The concentration of Fluo-3 used in the majority of FLIPR assays is 8µM. Lower concentrations can be examined in order to reduce the cost of the assay. The no-wash dyes have been shown to be effective at lower concentrations as well. CHO cells are dye loaded at 37°C, whereas AV12 and HEK293 cells can be dye loaded at 25°C.
- DMSO tolerance:
DMSO can alter the response of the cells as well as shift the dose response curve for agonist. It is recommended to perform an agonist dose response curve in the presence of different concentrations of DMSO in order to assess the DMSO tolerance of the assay. Extreme care should be taken if a DMSO concentration >0.1% is required.
- Agonist/antagonist dose response curves:
The reproducibility of the assay can be examined by performing two independent days of agonist/antagonist/or potentiator dose-response curves. The EC50/IC50 values should remain relatively constant over the course of the two experiments.
- Full plate variability and Z’ factor determination:
The variability of the assay is determined by running triplicate max/mid/min plates on three days and then calculating the Z’factor.
Considerations when performing 384-well FLIPR™ assays:
384-well FLIPR assays have a number of challenges that are not apparent in the 96-well format. The first is mixing in the well. Most 96-well experiments are designed to allow a larger volume to be added to a larger space where mixing is not a concern. In a typical 96-well assay, 50µl of test compound are added to 50µl of buffer in the cell plate at a height of approximately 80 to 95µl. The height is the liquid height in the well at which the tips dispense. The 384-well plate is limited to a maximum volume of a 30-µl addition in a much smaller diameter well, and using the 96-well technique will result in variable response. When adding to a 384-well plate, the tips are typically in the buffer solution of the cell plate when the dispense takes place. In a number of cases, the speed of dispense has to be increased as well. These heights and speeds should be tested with buffer to check for unwanted “pre-firing” of the cells. Another issue that arises with the 384-well format is the limited amount of diluent that can be added to the compound plate. This limitation can result in having to create intermediate dilution plates off-line, thereby slowing throughtput and adding costly consumables. This has been eliminated by using an in-tip dilution on the FLIPR™ (Figure 6). Although the final DMSO concentration is the same, the bolus of DMSO in the bottom of the tip can have an effect on the cells (Figures 7a and b). In our hands, a ratio of 15µl buffer/5µl compound was found to have the least DMSO effect. However since this result can be variable, different combinations should be tested during development. This in-tip dilution method can be used in both the two- and three-addition FLIPR™ methods.
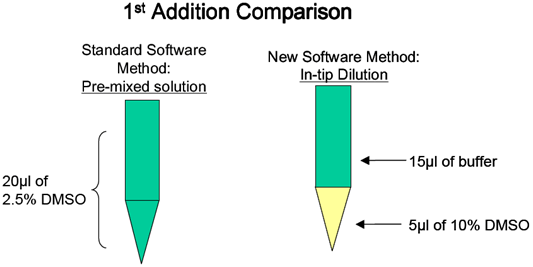
Figure 6. Schematic of in-tip dilution method.

Figure 7(a). Effects of bolus of DMSO on shapes of kinetic tracings
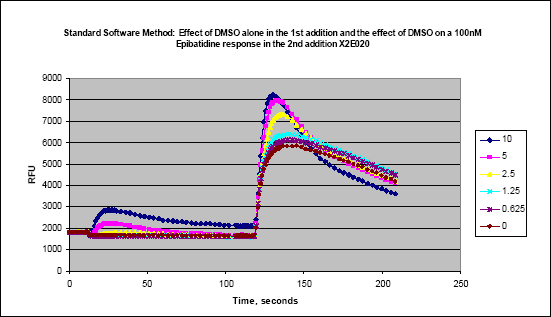
Figure 7(b). Effects of bolus of DMSO on shapes of kinetic tracings.
Notes on tip washing:
The FLIPR™-2 and FLIPR™-3 have tip wash stations that can be incorporated into the assay to eliminate the need to change tips. This allows one to use reservoirs without fear of cross contamination among the test compounds. In addition, a DMSO pre-wash can be performed at the tip load station with the proper adapter. When running a single-point screen of more than 100K compounds, tip washing should be tested first to minimize cost and maximize throughput. Occasionally, the compound used for the EC90 addition cannot be washed off the tips, resulting in significant carry-over of active compounds in to the subsequent plate (example in Figure 8); in these cases, the tips will have to be changed. This typically happens when peptides are added as the EC90 dose.

Figure 8(a). Example of max addition with tip wash in agonist/potentiator assay.

Figure 8(b). Carry-over from tips in (a) in subsequent plate (buffer addition only).
Some ion channels (e.g. ionotropic glutamate receptors) differ from GPCRs in that they desensitize very quickly to agonist exposure, and in most cases, it is not possible to see a response in FLIPR™ with agonist alone. Such targets require the use of agents that decrease the rate of desensitization, which are called channel modulators or “clamps”. The choice of which channel modulator to use is dependent upon the receptor. The following is a brief summary of modulators that we have used:
|
Receptor
|
Channel modulator
|
|
iGluR1 flip
|
Cyclothiazide (CTZ)
|
|
iGluR1 flop
|
LY compound
|
|
iGluR4 flip
|
Cyclothiazide (CTZ)
|
|
iGluR4 flop
|
LY compound
|
|
iGluR5 & 6
|
Concanavalin A (Con A)
|
Since ion channel modulators are needed to decrease the rate of desensitization of the channel to agonist, the assay design is somewhat different than for GPCRs. Like for GPCRs, the ability of the FLIPR™ to make two fluid additions to the cells enables the detection of agonists, antagonists, and allosteric modulators in one assay. Representative kinetic profiles for iGluR1 flip and flop are shown in Figure 9A. Test compounds are added in the first addition along with a 90% dose of the known agonist, in this case glutamate, which normally does not generate a measurable Ca+2 response because the rate at which the receptor desensitizes is too fast to be detected on the FLIPR™. A response in the first read will indicate that the test compound is either a non-desensitizing agonist or a positive allosteric modulator (Figure 9B). The second addition consists of an optimal concentration (~90%) of a known allosteric modulator which results in maximal response by clamping the channel open and decreasing receptor desensitization. A reduced response in the second read will indicate that the compound is an antagonist (Figure 9C). The question of whether the compound is a non-desensitizing agonist or an allosteric modulator will be answered in the secondary assay in which the compound is added in the absence of any glutamate in the first read. If the compound alone elicits a response, it is a non-desensitizing agonist. Alternatively, if the compound only gives a response in the presence of glutamate (read 2), then it is a potentiator.
In the case of the Kainate receptor iGluR6, the allosteric modulator ConA needs to be incubated on the cells for a minimum of 5 minutes prior to adding agonist. ConA takes longer to bind and has an effect on receptor desensitization.
Figure 9. Expected kinetic profiles of iGluR1 Flip and Flop receptors. (A) Expected kinetic profile of 0.5mM glutamate (agonist) in the 1st addition followed by 20µM LY (allosteric modulator) in the 2nd addition. (B) Expected kinetic profile of an agonist or an allosteric modulator where 20µM LY (control potentiator) and 0.5mM glutamate are added in 1st addition. (C) Expected kinetic profile of an antagonist where 10µM NBQX (control inhibitor) and 0.5mM are added in the 1st addition, followed by 20µM LY in the second addition. In B and C, the test compounds will be added at the 1st addition with 0.5mM glutamate, followed by 20µM LY in the 2nd addition.
Changes in membrane potential associated with ion channel activity may be measured on the FLIPR™ instrument using a voltage-sensitive dye available from Molecular Devices. The following are some of the parameters that need to be considered in developing a FLIPR™-based membrane potential assay:
So far, we have been describing methods appropriate for adherent cells cultures. In these cases, dye can be loaded directly onto cells grown to confluency in microtiter plates. In contrast, when the transfected cell line is weakly adherent or grows in suspension culture the following procedures should be followed:
- Remove growth media from cell culture flask.
- Add 10ml PBS to each flask to rinse.
- Remove PBS and repeat rinse step.
- Add 10ml cell dissociation buffer to each flask.
- Rock flask gently.
- Add 10ml Alpha-MEM and discard the rinse.
- Transfer cells to 50ml centrifuge tube.
- Add 30 ml buffer.
- Pellet cells for 5 min at 2000 rpm.
- Remove supernatant.
- Add 30ml buffer with 30 µL Fluo-3 AM (1:1000 dilution) and 30 µl pluronic acid.
- Cover tube with foil and shake gently.
- Place on shaker for 60 min at 180 rpm at room temperature.
- Fill up tube with buffer and spin for 5 min at 2000 rpm and remove supernatant.
- Repeat step #14.
- Resuspend cells at 1 x10⁶ cells/ml.
- Plate 50 µl/well of Poly-D-Lysine pre-coated plates.
- Wait 20 min and centrifuge plates for 3 min at 1500 rpm.
- Place plates in FLIPR until ready for use.
Notes:
- If cells are weakly adherent, start at step #1.
- If cells are in suspension, start at step #7.
- If using a no-wash dye, skip steps #14-15.
Pre-Assay Setup for FLIPR™-2 and -3:
In this screen, which is the same for 96- or 384-well assay set-up, the user defines the labware used in the experiment from a drop-down list. The other options on this screen are the filter selection, camera configuration, and the output file setup.
- Assign Plate: This is where the user configures the deck layout. If the plate you are using is not included, there is a default 96-well and default 384-well that can be used until the correct plate is defined.
- Camera configuration: The exposure length is typically set to 0.4 secs. The gain is only applicable to The FLIPR™-3 with the Andor camera.
Note: To adjust the baseline signal of the plate, first adjust the laser intensity from the keypad before adjusting the exposure time. This should be done for each plate to set the same baseline over a run.
- Filter selection: The FLIPR™ has a two-position filter slide. Typically, filter #1 is a 488-nm filter used for calcium assays, and filter #2 is either blank or a 535-nm filter for membrane potential assays.
- Create document name: This is where the filename is created. A “1” in the field means this will be included in the file name and a “0” means it will not. A few issues deserve a warning here: If you use the date only, it is very possible that the data generated will be overwritten if another run is made on the same date. Therefore, it is a good practice to include a user-defined string in your file name. ALWAYS include the experiment number in the output. This is the flag that assigns the _n1,_n2, etc to the plates in the run. Failure to include this will result in every plate being labeled _n1, thereby overwriting all previously generated data. The best practice here is to use a lab notebook number and page as the filename. An example would be: D00567_143, where D00567 is the notebook number and 143 is the page.
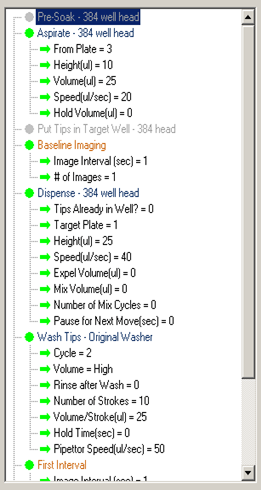
Sequences Setup:
The sequence setup is where the entire experiment is defined. This includes defining the number of reads to be taken as well as all liquid handling steps, wash sequences, automated tip unload, etc. These settings should be done with the assistance of an automation engineer or an experienced FLIPR™ user.

By double clicking on the circle beside each step, the user can activate/deactivate that part of the sequence. A green circle indicates the step is active while grey indicates inactive. By single clicking on the sequence step, the step’s setup box appears on the right side of the window with all parameters that can be accessed by the user.
- Pre-Soak: This is typically not used.
- Aspirate: The FLIPR™ can aspirate from any of the four deck positions as long as a plate has been defined there in the initial setup page.
- Put tips in target well: This will move the tips into the target plate before dispensing. Typically not used. NEVER use this if dispensing at a low height where the tips are in contact with the buffer. We have observed that this can cause a response from the compound on the outside of the tips.
- Baseline imaging: The pipettor head will not move to the cell plate until the baseline imaging is complete. A typical setting is 1 to 5 secs.
- Dispense: The FLIPR can dispense to any of the four deck positions as long as a plate has been defined there in the initial setup page.
- Wash tips: This will wash tips in the wash station at position 6 if the unit has a wash station installed. A pre-wash can be performed at position 5 by clicking the “rinse after wash” button. This will use the same wash parameters defined, only perform them at position 5.
- First Interval: This sets the number of images to be acquired and the interval between each image. Typically, the interval is short (1 sec) and the number of images are 30 to 60 to capture the compound addition. This should be set long enough to capture past the peak response.
- Second Interval: This set the number of images to be acquired and the interval between each image. Typically, the interval time is longer (3-5 secs) and the number of images is sufficient to capture when the response decreases to background. In some cases, the signal will never return to background and it is the judgment of the scientist to set this range.
- Automated Tip Unload: This will automatically unload the tips to the rack when all pipetting steps are completed. This should only be done in the last sequence.
- Clear Pipette Head: This return the pipettor head to the home position.
Post Assay Setup:
In the post-assay setup section, the user selects where data will be saved, what type of data to save, and considers the option to automatically export and print data at the end of each plate. When setting the save location, you must type in the exact path to the save directory. The software will generate an error if the location is invalid or if it is a network location that is not available. In most instances, only FWD files should be saved. This saves storage space, as the FID files are larger image files. In some instances, such as when a heated stage is used, the open door may need to be turned off to maintain better temperature control in the FLIPR™.
Graph Setup:
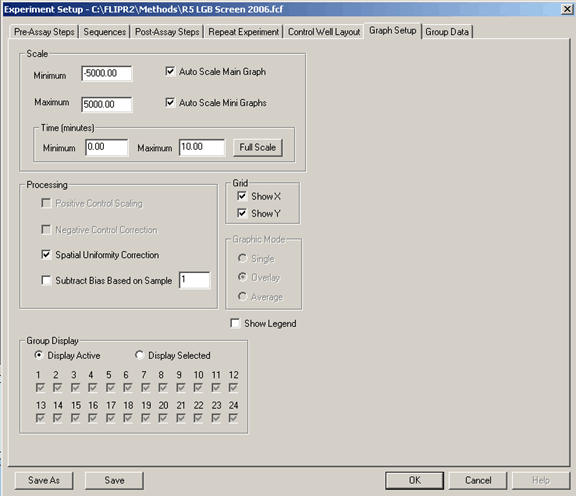
Typically, Spacial Uniformity Correction is used without subtracting the background. Spacial Uniformity Correction is basically a software normalization that sets all wells to the average RFU of the plate when starting the experiment.
In most cases, subtract bias is not used. This will background subtract the data set which can mask the assay window. An example would be to start with a baseline of 5000 RFU and the max signal response being 6000 RFU. In most situations, this is not a screenable window, but if the 5000 RFU background is subtracted, the window “looks” good (0 to 1000).
One-, Two- and Three-Addition Assay Examples:
All three of these formats will require the same initial setup described above.
One-addition assays will need one or two sequences dependent upon the use of an in-tip dilution. The example below shows a 384-well aspiration from position 3 with a dispense into the cell plate at position 1 (Read Position), followed by a wash.
A one-addition assay with an in-tip dilution is shown below. The first step aspirates 17µl from plate 1 and then 8µl from plate 3.
Note: When performing an in-tip dilution, the volume in the second step is the final total volume aspirated (17µl + 8µl). This is a result of the way the FLIPR™ software keeps track of the pipettor head.

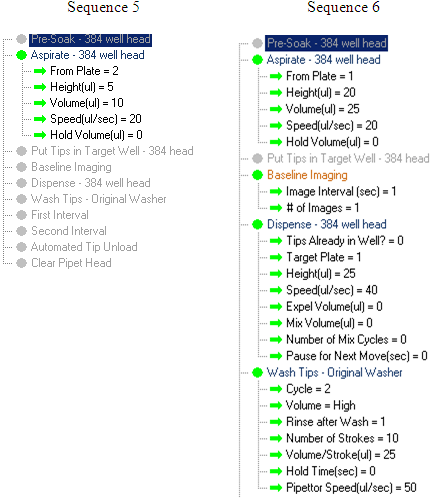
A two-addition or three-addition assay can be run by simply adding sequences. It is recommended that if the assay is targeting potentiators, the in-tip dilution and pre-incubation time be used to maximize the sensitivity of the assay. Below is the complete liquid handling setup for a three-addition assay. Volumes and read times will vary.

Deck Layout for a three-addition assay

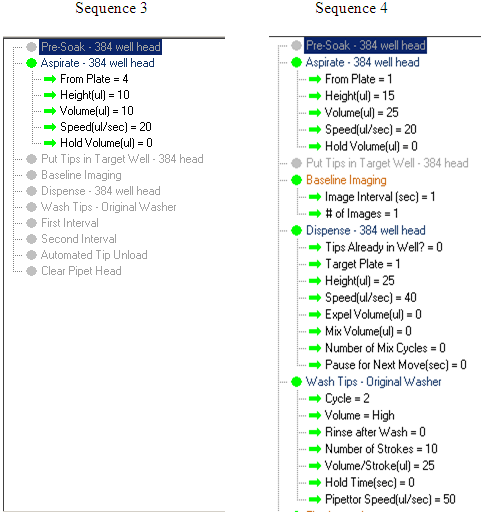
Note that in sequence 3 and 5, the order of aspiration is reversed. This is due to the fact that unknown test compounds have been added to the cell plate and to aspirate from there first would be a source of contamination to the EC10 reservoir. This is not the case for the 4th and 6th sequence as the tips have been washed.
Although the FLIPR™ has facilitated advances in cellular calcium mobilization screens, these assays remain difficult to configure, relatively slow, and fraught with potential artifacts. Blocked FLIPR™ tips will lead to false positives in an inhibitor screen, or false negatives in an agonist screen. Fluorescent compounds, Ca+2 ionophores, and compounds that permeabilize the cell membrane can all contribute to false positives in the agonist read (Figure 11). These types of nuisance or interference compounds can often be identified from the kinetic traces of the response, but this kind of in depth data review is time consuming and requires experience to correctly recognize strange response profiles. In addition, compounds with agonist activity may interfere with antagonist reads due to desensitization or internalization of the receptor, resulting in false positives.
The utility of the FLIPR™ and calcium dye approach for screening GPCR targets has been greatly enabled by the use of over-expression of promiscuous and chimeric G proteins that provide a method to “switch” GI/o-coupled receptor activation to an increase in intracellular calcium. However, screens designed to detect receptor activity against a backdrop of stable, high-level promiscuous G protein expression are also susceptible to artifacts - - false positives derived presumably from other cell surface receptors hi-jacking the promiscuous G proteins. Indeed, even in the absence of a promiscuous G-protein, any endogenous GPCR that couples through Gq and induces a Ca+2 response may show up as an agonist or interfere with antagonist reads. It is well documented that GPCRs, particularly those in heterologous expression systems, can activate multiple signal transduction pathways, and indeed there is also evidence for cross-talk between recombinant and native receptors that may also complicate the responses to compounds. Thus, we recommend routinely performing a secondary screen against the parent cell line that lacks the receptor of interest in order to definitively identify false positives.
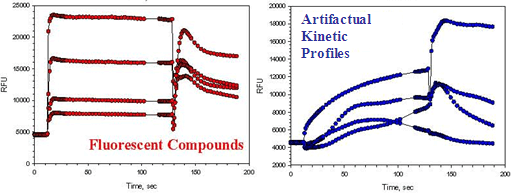
Figure 11. Typical kinetic traces that can result from FLIPR™ artifacts.
- Baxter, D. F. et al. (2002) A novel membrane potential-sensitive fluorescent dye improves cell-based assays for ion channels. J. Biomolecular Screening 7, 79-85.
- Benjamin, E. R. et al. (2006) Pharmacological characterization of recombinant N-type calcium channel (Cav2.2) mediated calcium mobilization using FLIPR. Biochemical Pharmacology 72, 770-782.
- Coward, P. et al. (1999) Chimeric proteins allow a high-throughput signaling assay of GI-coupled receptors. Analytical Biochemistry 270, 242-248.
- Hodder, P. et al. (2004) Miniaturization of intracellular calcium functional assays to 1536-well plate format using a fluorometric imaging plate reader. J. Biomolecular Screening 9, 417-426.
- Jensen, A. (2005) Functional characterization of human glycine receptors in a fluorescence-based high throughput screening assay. European J. Pharmacology 521, 39-42.
- Liu, A.M.F. et al. (2003) G-α16/z chimeras efficiently link a wide range of G protein-coupled receptors to calcium mobilization. J. Biomolecular Screening 8, 39-49.
- Liu, E.C-K. And Abell, L. M. (2006) Development and validation of a platelet calcium flux assay using a fluorescent imaging plate reader. Analytical Biochemistry 357, 216-224.
- Lubin, M. et al. (2006) A nonadherent cell-based HTS assay for N-type calcium channel using Calcium 3 dye. Assay and Drug Development Technologies 4, 689-694.
- Miret, J. et al. (2005) Multiplexed G-protein-coupled receptor Ca2+ flux assays for high-throughput screening. J. Biomolecular Screening 10, 780-787.
- New, D.C. and Wong, Y. H. (2004) Characterization of CHO cells stably expressing a Gα16/z chimera for high throughput screening of GPCRs. Assay and Drug Development Technologies 2, 269-280.
- Reynen, P. H. et al. (2000) Characterization of human recombinant α2A-adrenoreceptors expressed in Chinese hamster lung cells using Ca+2 changes: evidence for cross-talk between recombinant α2A- and native α1A-adrenoreceptors. British J. Pharmacology 129, 1339-1346.
- Robas, N.M. and Fidock, M.D. (2005) Identification of orphan G protein-coupled receptor ligands using FLIPR assays. Methods in Molecular Biology 306, 17-26.
- Schroeder, K. S. and Neagle, B. D. (1996) FLIPR: a new instrument for accurate, high throughput optical screening. J. Biomolecular Screening 1, 75-80.
- Wolff, C. (2003) Comparative study of membrane potential-sensitive fluorescent probes and their use in ion channel screening assays. J. Biomolecular Screening 8, 533-543.
- Zhang,Y. et al. (2003) Evaluation of FLIPR Calcium 3 Assay Kit—a new no-wash fluorescence calcium indicator reagent. J. Biomolecular Screening 8, 571-577.
|