|
Copyright © 2008, Eli Lilly and Company and the National Institutes of Health Chemical Genomics Center. All Rights Reserved. For more information, please review the Privacy Policy and Site Usage and Agreement.
- STEPS TO ASSAY DEVELOPMENT
- INTRODUCTION
- MATERIALS AND REAGENTS
- MEMBRANE PREPARATIONS AND ASSAY BUFFERS
- BASIC ASSAY PROTOCOL
- ASSAY OPTIMIZATION
- DATA ANALYSIS
- FILTRATION ASSAYS
- NON-RADIOMETRIC GTPγS ASSAYS
- LITERATURE REFERENCES

Binding of GTP to the alpha subunit of heterotrimeric GTP binding proteins is an early event in agonist-induced activation of G-Protein-Coupled Receptors. Although GTPγS binding assays are carried out using membrane preparations in much the same way as radioligand binding assays, these are functional assays and can thus be used to differentiate agonist, antagonist, and inverse agonist activities. Such assays are carried out using [35S]guanosine-5’-O-(3thio)triphosphate which provides a radioactive ligand with high affinity for G-protein alpha subunits that is highly resistant to the inherent GTPase activity of alpha subunits such that it remains bound for sufficient periods of time to allow counting of radioactivity.
Although the classical method used for GTPγS binding has been filtration of radiolabeled membranes, scintillation proximity assays (SPA) are much more convenient and allow the use of an antibody capture technique which permits determination of receptor-mediated activation of specific G-protein families. Thus there are two basic methods for running homogeneous SPA GTPγS binding assays in 96 well plate format: whole membrane binding in which labeled membranes are bound to wheat germ agglutinin (WGA)-coated SPA beads in the same way as these beads are used for radioligand binding assays, and antibody capture binding assays in which membranes are solubilized with detergent followed by isolation of the desired G-protein using a specific antibody along with capture of antibody-G-protein complexes onto anti-IgG coated SPA beads.
Advantages of GTPγS functional assays in comparison to determinations of second messengers produced as a result of receptor activation are:
- The assays are very simple to run and utilize membrane preparations which can be frozen at -80°C for periods of months
- Because GTP exchange is an event proximal to receptor activation these assays typically have lower degrees of receptor reserve than other functional assays and are thus useful for differentiating full from partial agonists
- The assays are useful for determination of antagonist inhibition constants since agonists and antagonists can be equilibrated prior to starting the incubation by addition of GTPγ35S
- One can often measure specific coupling of receptor subtypes to different G-protein families, even in native tissues, under very similar assay conditions.
The major disadvantage is the relatively low signal to background which limits GTPγS binding to medium throughput evaluations. The power of the antibody capture technique is its ability to easily generate multiple concentration response curves thus allowing true pharmacological evaluation of receptor-mediated coupling to individual G-proteins, an accomplishment that is prohibitive by older immunoprecipitation techniques.
The list below includes materials and reagents, which have been used successfully to enable GTPγS binding assays for a variety of G-Protein Coupled Receptors:
- 96 well plates: Costar 3632, white clear bottom
- WGA SPA beads: Amersham SPQ0031
- Anti-rabbit SPA beads: Amersham RPNQ 0016
- Anti-mouse SPA beads: Amersham Care RPNQ 0017
- GTPγ35S: Perkin Elmer Life Sciences NEG030H
- NP40 detergent 10%: Roche 1 332 473
- Anti-Gs/olf: Santa Cruz SC-383, rabbit polyclonal
- Anti-Gi3: Santa Cruz SC-262, rabbit polyclonal (recognizes Gi-1, Gi-2, and Gi-3)
- Anti-Gq/11: Santa Cruz SC-392, rabbit polyclonal
- Anti-Go: Chemicon MAB3073, mouse monoclonal
- Crude homogenates (2)
- Plasma membrane preparations (P2 fraction, 3)
- Sucrose density gradient enriched receptors (1)
- Commercially available membranes, which includes:
- Receptors cloned into mammalian cells (Perkin Elmer, Euroscreen, Cerep)
- Receptors cloned into Sƒ9 insect cells co-expressing mammalian G-proteins.
- Lazareno and Birdsall buffer (2) 20 mM HEPES, 100 mM NaCl, 5 mM MgCl2, pH 7.4.
- Buffers with HEPES replaced by 50 mM Tris HCl (1,9)
- Incubate membranes, GTPγ35S, and compounds tested in 200 μl/well at room temperature for 30 – 60 minutes.
- Add 50 μl per well of suspended WGA beads (1 mg/well)
- Seal plates and incubate for one hour or more at room temperature
- Centrifuge at 200 x g and count plates in a Wallac microbeta
- Incubate membranes as for whole membrane assay
- Add 20 μl per well of 3% NP40 and incubate for 15 minutes
- Add 20 μl per well of primary antibody and incubate for 15 minutes
- Add 50 μl per well of anti-rabbit or anti-mouse SPA beads (1 mg)
- Seal and incubate for three hours, centrifuge as above and count.
Using a starting buffer such as listed under assay buffer above, determine the optimal amount of membrane protein per well from 5 to 50 μg in the presence of varying concentrations of GDP (guanosine diphosphate) from 0 – 10 μM for transfected cell membranes and from 0 up to 300 ?M for native tissue membranes using a concentration of 200 –500 pM GTPγ35S. Note that Gi/o coupled receptors will require higher concentrations of GDP than Gs or Gq coupled receptors which may give optimal signals in the absence of added GDP. Figure 1 illustrates the marked difference in GDP requirement for determination of muscarinic agonist-stimulated GTPγS binding in rat brain striatal membranes measured by anti-Gq/11 (M1 receptor) versus anti-Go (M4 receptor).
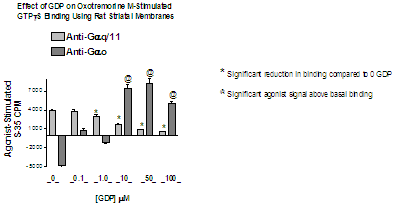
Figure 1. Difference in [GDP] required for Gq versus Go coupled GPCR’s
Determine the optimal Mg++ concentration for the best signal to noise over the range of 1 mM to 10 mM. Figure 2 shows the variation of Mg++ on agonist-stimulated GTPγS binding mediated by GPCR receptors in rat striatal membranes.

Figure 2. Agonist-stimulated GTPγS binding in brain membranes
Determine the optimal amount of NaCl for best signal to noise over the range of 0 – 200 mM. Although 100 mM NaCl is commonly used in these assays note that at times better agonist stimulation may be achieved at lower Na++ and if higher constituitive activity is desired (for evaluating inverse agonists) lowering Na++ will likely provide the best opportunity. Figure 3 demonstrates the effect of NaCl on the constituitive activity of an orphan GPCR.
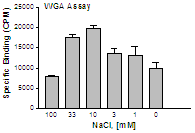
Figure 3. Optimization of NaCl to measure constituitive activity of an orphan GPCR
The effect of adding saponin at 3 – 100 μg/ml can be explored, but recognize that while saponin may increase signal to background, it may also compromise the quality of concentration response curves. Figure 4 demonstrates the optimization of saponin to achieve the highest signal to background for an orphan receptor where constituitive activity was measured to allow evaluation of inverse agonists. Figure 5 shows how saponin may compromise the quality of some concentration response curves.

Figure 4. Optimization of saponin to measure constituitive activity of an orphan GPCR

Figure 5. Effect of saponin on agonist concentration response curves for some receptor subtypes
The optimal incubation time for the best signal to background may be determined, but thirty minutes is usually satisfactory for cell membranes and one hour for native tissue membranes.
If using the antibody capture method the optimal dilution will have to be determined for each lot of antibody. Figure 6 below illustrates the effect of various dilutions of anti-Gs/olf on GTPγS binding mediated by a specific GPCR receptor.
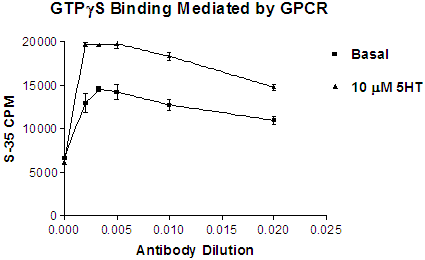
Figure 6. Effect of antibody dilution on basal and agonist-stimulated binding
Experimental design and JMP analysis are convenient tools for optimizing a variety of conditions in a small number of experiments and determining if there are any interactions among the factors. Figure 7A shows an example in which four factors were optimized in a single experiment. Figure 7B shows the two factor interaction profiles from JMP analysis. Parallel lines indicate no interaction and intersecting lines indicate interactions. For instance in this experiment there is virtually no interaction between NaCl and saponin, but there is a significant interaction between the amount of protein and GDP concentration.
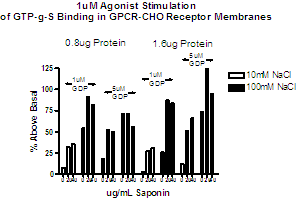
Figure 7A. Experimental Design with 4 factors (GDP, Saponin, NaCl and Membrane protein)

Figure 7B. Interaction Plots for Experimental Design (using JMP)
Determine the signal window for the assay under the optimal conditions by running background and maximal stimulation multiple times across assay plates on separate days. Calculate the Z’ factor for the assay using the formula:
Z’ = 1- (3(SDmax) + 3(SDmin)/Max-Min)
A Z’ factor of > 0.5 indicates a useful assay. GTPγS binding assays can be quite reproducible and will give reliable results when signals are greater than 40-50% over background. Even with smaller signals, one can generate reliable concentration response curves by using 4 to 8 replicates per data point.
After determining optimal conditions for the assay concentration response curves should be run for standard agonists and antagonists to determine variability and comparability to literature values if available. Most assays will require duplicate determinations per concentration but with exceptional signals one may be able to use single data points for each.
Good assays for Gi/o may be developed using whole membranes and WGA beads. Use of antibody capture for Gi/o coupled receptors, however, may reduce assay variability. For Gq and Gs coupled GPCR’s, the antibody capture assay will most likely be superior since most cells and tissues are dominated by inhibitory G-proteins and it is often not possible to develop reliable signals without the antibody technique unless receptors are fused to Gs or Gq (3, 13).
As with other functional assays, concentration response data may be fitted using a four-parameter logistic equation with variable slope to determine half maximal responses. Keep in mind that GTPγS assays will often show some degree of receptor reserve even though typically less than a cAMP or Ca++ mobilization assay and for this reason agonist EC50’s may not agree with Ki values for agonists determined in radioligand binding assays. For antagonists, Kb values may be determined from rightward curve shifts in the presence of a fixed antagonist concentration or from antagonist concentration response curves run at a fixed agonist concentration (at or somewhat below the concentration that produces a maximal response). For curve shift at a single antagonist concentration the following equation may be used to determine the Kb:
EC50b = EC50a (1 + [antagonist]/antagonist Kb)
where EC50a is the agonist EC50 in the absence of antagonist and EC50b is that in the presence of antagonist.
For antagonist concentration responses the following equation is used (14):
Kb = IC50/ (2 +([agonist]/agonist EC50)n)1/n - 1
where n is the slope of the agonist curve.
In antagonist concentration response experiments it is desirable to determine the agonist EC50 in each experiment along with the IC50 for the antagonist. Figure 8 below illustrates the use of both methods for measuring antagonist Kb values.


Figure 8: Examples of determining antagonist Kb values in GTPγS assays with a single antagonist concentration
Filtration whole membrane assays may be used for GTPγS binding using the same methods employed for radioligand binding. The potential advantages of filtration assays are the lack of non-proximity effects, which are present in SPA assays and the ability to use higher concentrations of GTPγ35S. Such advantages are not usually worth sacrificing the convenience of homogeneous SPA assays. There are many examples of the use of filtration for GTPγS binding in the literature (1,2,8, 9). As for WGA whole membrane binding, filtration assays are mostly limited to Gi/o coupled receptors since they cannot employ antibody capture.
Perkin Elmer Life Sciences has developed an assay based on the use of a europium-GTP complex, which has been used successfully by some scientists. This is a fluorescent whole membrane assay. It is not as convenient and is more expensive to use than GTPγ35S method. However, it does not require radioactivity, there is no non-proximity effect, and the data are just as reliable (see figure 9 below).

Figure 9: Side by side comparison of GTP-Eu vs. GTPγ35S assay methods with four agonist compounds.
- Hilf G, Gierschik P, and Jakobs KH. Muscarinic acetylcholine receptor-stimulated binding of guanosine 5’-O-(3-thiotriphosphate) to guanine-nucleotide-binding proteins in cardiac membranes. Eur. J. Biochem. 186: 725-731, 1989.
- Lazareno S, and Birdsall NJM. Pharmacological characterization of acetylcholine-stimulated [35S]-GTPγS binding mediated by human muscarinic m1-m4 receptors: antagonist studies. Br. J. Pharmacol. 109: 1120-1127, 1993.
- DeLapp N, McKinzie J, Sawyer BD, Vandergriff A, Falcone J, McClure D, and Felder CC. Determination of [35S] guanosine-5’-O-(3-thio)triphosphate binding mediated by cholinergic muscarinic receptors in membranes from Chinese hamster ovary cells and rat striatum using an anti-G-protein scintillation proximity assay. J. Pharmacol. Exp. Ther. 289: 946-955, 1999.
- Porter AC, Bymaster FP, DeLapp NW, Yamada M, Wess J, Hamilton SE, Nathanson N, Felder CC. M1 muscarinic receptor signaling in mouse hippocampus and cortex. Brain Res. 944: 82-89, 2002.
- Bymaster FP, Falcone J, Bauzon D, Kennedy JS, Schenk K, DeLapp NW, and Cohen ML. Potent antagonism of 5HT3 and 5HT6 receptors by olanzapine. Eur. J. Pharmacol. 430: 341-349, 2001.
- Pullar IA, Boot JR, Carney SL, Cohen ML, Colvin EM, Conway RG, Hardy CH, Lucaites VL, Nelson DL, Shenk KW, Tomlinson R, Wedley S. In vitro activity of LY303558, and inhibitor of the 5-hydroxytryptamine transporter with 5-HT (1B/1D/2) receptor antagonist properties. Eur. J. Pharmacol 432: 9-17, 2001.
- Wainscott DB, Johnson KW, Phebus LA, Schaus JM, Nelson DL. Human 5-HT1F receptor-stimulated [35S]GTPγS binding: correlation with inhibition of guinea pig dural plasma protein extravasation. Eur. J. Pharmacol 352: 117-124, 1998.
- Alper RH, Nelson DL. Characterization of 5-HT1A receptor-mediated [35S]GTPγS binding in rat hippocampal membranes. Eur. J. Pharmacol. 343: 303-312, 1998.
- Gupta SK, Pillarisetti K, Thomas RA, and Aiyar N. Pharmacological evidence for complex and multiple site interaction of CXCR4 with SDF-1α: implications for development of selective CXCR4 antagonists. Immunology Letters 78: 29-34, 2001.
- Cussac D, Newman-Tancrdi A, Duqueyroix D, Pasteau V, and Millan MJ. Differential activation of Gq/11 and Gi3 proteins at 5-HT2C receptors revealed by antibody captures assays: influence of receptor reserve and relationship to agonist-directed trafficking. Mol. Pharmacol. 62: 578-589, 2002.
- Newman-Tancredi A, Cussac D, Marini L, and Millan MJ. Antibody Capture Assay Reveals Bell-Shaped Concentration-Response Isotherms for h5-HT1A Receptor-Mediated Gαi3 Activation: Conformational Selection by High-Efficacy Agonists, and Relationship to Trafficking of Receptor Signaling. Mol. Pharmacol. 62: 590-601, 2002.
- Newman-Tancredi A, Cussac D, Marini L, Touzard M, and Millan MJ. hH5-HT1B receptor-mediated constitutive Gαi3-protein activation in stably transfected Chinese hamster ovary cells: an antibody capture assay reveals protean efficacy of 5HT. British J. Pharmacol. 138: 1077-1084, 2003.
- Milligan G. Principles: Extending the utility of [35S]GTPγS binding assays. TIPS 24: 87-90, 2003.
- Leff P, and Dougall IG. Further concerns over Cheng-Prusoff analysis. TIPS 14: 110-112, 1993.
|


