 |
|
|
|
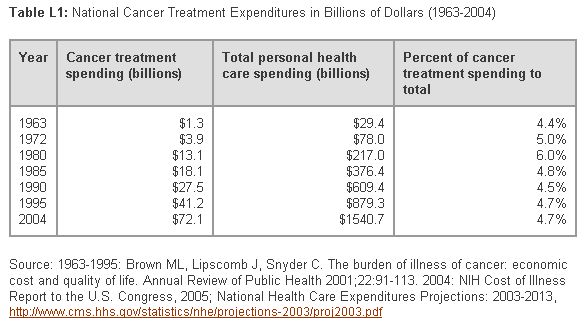
The financial costs of cancer treatment are a burden to people diagnosed with cancer, their families, and society as a whole. Cancer treatment accounted for an estimated $72.1 billion in 2004—just under 5 percent of U.S. spending for all medical treatment. Between 1995 and 2004, the overall costs of treating cancer increased by 75 percent. In the near future it is expected that cancer costs may increase at a faster rate than overall medical expenditures. As the population ages, the absolute number of people treated for cancer will increase faster than the overall population, and cancer cases will increase relative to other disease categories—even if cancer incidence rates remain constant or decrease somewhat. Costs also are likely to increase at the individual level as new, more advanced, and more expensive treatments are adopted as standards of care. Updated estimates are currently being calculated for cancer treatment costs by phase of care and the national economic burden of cancer treatment for all cancers combined, as well as for cancer of the lung, breast, colorectal, prostate, head/neck, bladder, ovary, kidney, endometrial, cervix, pancreas, and esophagus; and lymphoma, leukemia, and melanoma. These cost estimates will be available in 2009. NCI will continue to monitor cancer costs and track the percentage of total medical costs accounted for by cancer care. Over the last three decades, this percentage has remained remarkably constant. As total spending for medical treatment rose between 1963 and 2004, so did spending for cancer treatment. Table L1: National Cancer Treatment Expenditures in Billions of Dollars (1963-2004)
Source: 1963-1995: Brown ML, Lipscomb J, Snyder C. The burden of illness of cancer: economic cost and quality of life. Annual Review of Public Health 2001;22:91-113. 2004: NIH Cost of Illness Report to the U.S. Congress, 2005; National Health Care Expenditures Projections: 2003-2013, http://www.cms.hhs.gov/statistics/nhe/projections-2003/proj2003.pdf Download: data (Excel) | image (JPEG) | slide (PowerPoint)Spending for each year is expressed in current dollars for that year. While cancer treatment costs increased dramatically between 1963 and 2004, the proportion of these costs to all health care expenditures remained stable. Cancer spending in this chart does not include screening, which cost an additional $10 to $15 billion in 2004. Total treatment expenditures for each of the four most common cancers are remarkably similar. However, individual costs for other cancers based on Medicare data show wide variation by type of cancer. Table L2: Estimates of National Expenditures for Medical Treatment for the 15 Most Common Cancers (based on Cancer Prevalence in 1998 and Cancer-Specific Costs for 1997–1999, projected to 2004 using the medical care component of the Consumer Price Index)
Source: Based on methods described in: Brown ML, Riley GF, Schussler N, Etzioni RD. Estimating health care costs related to cancer treatment from SEER-Medicare data. Medical Care 2002 Aug;40(8 Suppl):IV-104-17. Phase-specific prevalence and cost estimates are for SEER-Medicare cases diagnosed between 1996 and 1999, with costs expressed in 2001 dollars using CMS cost adjusters. Estimates are updated to 2004 using the medical care services component of the Consumer Price Index: U.S. Department of Labor, Bureau of Labor Statistics: CPI Detailed Report and Producer Price Indexes . Washington . U.S. Government Printing Office. Monthly reports for January 1999–March 2004. Download: data (Excel) | image (JPEG) | slide (PowerPoint) Among the four most common cancers, the first-year costs for lung and colorectal cancer are higher because screening is not as commonly used in the detection of these cancers. While there is no lung cancer screening recommendation, if screening for colorectal cancer were performed as recommended, the proportion of cases presenting at advanced stages—when treatment is more extensive and costly—would be reduced. Medicare does not cover certain cancer care expenses, such as oral medicines commonly used to treat cancers of the breast and prostate. These out-of-pocket costs may add as much as 10 percent to the estimates shown above. Direct medical expenditures are only one component of the total economic burden of cancer. The indirect costs include losses in time and economic productivity resulting from cancer-related illness and death. The total economic burden of cancer in 2004 is estimated to have been $190 billion. |
||||||||||||||||||||||||||||||||||||||||||||||||||||||||||||||||||||||||||||||||||||||||||||||
|
|
