

Although African Americans are only 13% of the U.S. population, they account for 47% of HIV/AIDS cases in 2006.
- African American males had over 7 times the AIDS rate as non-Hispanic white males.
- African American females had over 21 times the AIDS rate as non-Hispanic white females.
- African American men were over 9 times as likely to die from HIV/AIDS as non-Hispanic white men.
- African American women were over 20 times as likely to die from HIV/AIDS as non-Hispanic white women.
At a glance – HIV/AIDS Cases (Adults and Children):
|
2002 |
2003 |
2004 |
2005 |
2006 |
% of total 2006 cases |
|---|---|---|---|---|---|---|
Non-Hispanic Black |
19,372 |
17,668 |
16,718 |
16,629 |
17,356 |
47% |
Non-Hispanic White |
10,723 |
10,033 |
10,181 |
10,528 |
10,758 |
29% |
Total Population |
37,529 |
36,102 |
37,894 |
35,634 |
36,817 |
|
Source: CDC 2008. HIV/AIDS Surveillance Report: Cases of HIV infection and AIDS in the United States, 2006. v.18. Table 1.
http://www.cdc.gov/hiv/topics/surveillance/resources/reports/2006report/pdf/2006SurveillanceReport.pdf[PDF, 2.6MB]
|
2002 |
2003 |
2004 |
2005 |
2006 |
% of total 2006 cases |
|---|---|---|---|---|---|---|
Non-Hispanic Black |
193,797 |
202,951 |
212,425 |
221,439 |
231,957 |
46% |
Non-Hispanic White |
139,947 |
145,081 |
151,694 |
158,375 |
166,000 |
33% |
Total Population |
409,407 |
443,916 |
465,005 |
486,028 |
509,681 |
|
Source: CDC 2008. HIV/AIDS Surveillance Report: Cases of HIV infection and AIDS in the United States, 2006. v.18. Table 8.
http://www.cdc.gov/hiv/topics/surveillance/resources/reports/2006report/pdf/2006SurveillanceReport.pdf[PDF, 2.6MB]
At a glance – HIV/AIDS Cases by Transmission (Adults):
Transmission |
% of Non-Hispanic Black Cases |
% of Non-Hispanic White |
|---|---|---|
Male-to-male sexual contact |
49% |
77% |
Injection drug use |
22% |
9% |
Male-to-male sexual contact and injection drug use |
7% |
8% |
Heterosexual contact |
22% |
5% |
Other |
1% |
1% |
Source: CDC 2008. HIV/AIDS Surveillance Report: Cases of HIV infection and AIDS in the United States, 2006. v.18. Table 9.
http://www.cdc.gov/hiv/topics/surveillance/resources/reports/2006report/pdf/2006SurveillanceReport.pdf[PDF, 2.6MB]
Transmission |
% of Non-Hispanic Black Cases |
% of Non-Hispanic White |
|---|---|---|
Injection drug use |
23% |
33% |
Heterosexual contact |
75% |
65% |
Other |
2% |
2% |
Source: CDC 2008. HIV/AIDS Surveillance Report: Cases of HIV infection and AIDS in the United States, 2006. v.18. Table 9.
http://www.cdc.gov/hiv/topics/surveillance/resources/reports/2006report/pdf/2006SurveillanceReport.pdf[PDF, 2.6MB]
At a glance – HIV (not AIDS) Cases by Transmission (Male Adults and Adolescents):
Transmission |
# of Non-Hispanic Black Cases |
% of Non-Hispanic Black Cases |
# of Non-Hispanic White Cases |
% of Non-Hispanic White Cases |
|---|---|---|---|---|
Male-to-male sexual contact |
6,203 |
44% |
11,963 |
73% |
Injection drug use |
1,594 |
11% |
858 |
5% |
Male-to-male sexual contact and injection drug use |
483 |
3% |
1,092 |
7% |
Heterosexual contact |
1,714 |
12% |
522 |
3% |
Other |
4,151 |
29% |
1,956 |
12% |
Total Cases |
14,187 |
|
16,434 |
|
Source: CDC 2008. HIV/AIDS Surveillance Report: Cases of HIV infection and AIDS in the United States, 2006. v.18. Table 20.
http://www.cdc.gov/hiv/topics/surveillance/resources/reports/2006report/pdf/2006SurveillanceReport.pdf[PDF, 2.6MB]
Transmission |
# of Non-Hispanic Black Cases |
% of Non-Hispanic Black Cases |
# of Non-Hispanic White Cases |
% of Non-Hispanic White Cases |
|---|---|---|---|---|
Male-to-male sexual contact |
30,148 |
37% |
55,725 |
69% |
Injection drug use |
11,997 |
15% |
5,512 |
7% |
Male-to-male sexual contact and injection drug use |
3,489 |
4% |
5,578 |
7% |
Heterosexual contact |
10,905 |
13% |
2,658 |
3% |
Other |
24,632 |
30% |
11,147 |
14% |
Total Cases |
81,503 |
|
81,172 |
|
Source: CDC 2008. HIV/AIDS Surveillance Report: Cases of HIV infection and AIDS in the United States, 2006. v.18. Table 20.
http://www.cdc.gov/hiv/topics/surveillance/resources/reports/2006report/pdf/2006SurveillanceReport.pdf[PDF, 2.6MB]
At a glance – HIV (not AIDS) Cases by Transmission (Female Adults and Adolescents):
Transmission |
# of Non-Hispanic Black Cases |
% of Non-Hispanic Black Cases |
# of Non-Hispanic White Cases |
% of Non-Hispanic White Cases |
|---|---|---|---|---|
Injection drug use |
1,034 |
13% |
690 |
26% |
Heterosexual contact |
3,451 |
44% |
1,132 |
46% |
Other |
3,370 |
43% |
850 |
32% |
Total Cases |
7,882 |
|
2,687 |
|
Source: CDC 2008. HIV/AIDS Surveillance Report: Cases of HIV infection and AIDS in the United States, 2006. v.18. Table 22.
http://www.cdc.gov/hiv/topics/surveillance/resources/reports/2006report/pdf/2006SurveillanceReport.pdf[PDF, 2.6MB]
Transmission |
# of Non-Hispanic Black Cases |
% of Non-Hispanic Black Cases |
# of Non-Hispanic White Cases |
% of Non-Hispanic White Cases |
|---|---|---|---|---|
Injection drug use |
7,105 |
14% |
4,260 |
26% |
Heterosexual contact |
23,732 |
46% |
7,593 |
46% |
Other |
20,244 |
39% |
4,567 |
28% |
Total Cases |
51,440 |
|
16,590 |
|
Source: CDC 2008. HIV/AIDS Surveillance Report: Cases of HIV infection and AIDS in the United States, 2006. v.18. Table 22.
http://www.cdc.gov/hiv/topics/surveillance/resources/reports/2006report/pdf/2006SurveillanceReport.pdf[PDF, 2.6MB]
At a glance – AIDS Cases and Rates (Adults)
# Cases |
Rate (per 100,000) |
Non-Hispanic Black/ |
|
|---|---|---|---|
Non-Hispanic Black males |
11,540 |
92.9 |
7.4 |
Non-Hispanic White males |
9,267 |
11.2 |
|
|
|||
Non-Hispanic Black females |
6,391 |
40.4 |
21.3 |
Non-Hispanic White females |
1,659 |
1.9 |
|
|
|||
Non-Hispanic Black (both sexes) |
17,930 |
60.3 |
9.4 |
Non-Hispanic White (both sexes) |
10,926 |
6.4 |
|
Source: CDC 2008. HIV/AIDS Surveillance Report: Cases of HIV infection and AIDS in the United States, 2006. v.18. Table 5a.
http://www.cdc.gov/hiv/topics/surveillance/resources/reports/2006report/pdf/2006SurveillanceReport.pdf[PDF, 2.6MB]
At a glance – AIDS Cases and Rates (Children <13 years)
# Cases |
Rate (per 100,000 population) |
|
|---|---|---|
Non-Hispanic Black |
30 |
0.4 |
Non-Hispanic White |
4 |
0.0 |
Total Population |
38 |
0.1 |
Source: CDC 2008. HIV/AIDS Surveillance Report: Cases of HIV infection and AIDS in the United States, 2006. v.18. Table 5a.
http://www.cdc.gov/hiv/topics/surveillance/resources/reports/2006report/pdf/2006SurveillanceReport.pdf[PDF, 2.6MB]
At a glance – AIDS Cases (Adults and Children)
|
2002 |
2003 |
2004 |
2005 |
2006 |
% of total 2006 cases |
|---|---|---|---|---|---|---|
Non-Hispanic Black |
19,246 |
19,512 |
18,909 |
18,081 |
17,960 |
47% |
Non-Hispanic White |
11,233 |
10,948 |
11,066 |
10,676 |
10,929 |
29% |
Total Population |
39,250 |
39,690 |
38,807 |
37,662 |
37,852 |
|
Source: CDC 2008. HIV/AIDS Surveillance Report: Cases of HIV infection and AIDS in the United States, 2006. v.18. Table 3.
http://www.cdc.gov/hiv/topics/surveillance/resources/reports/2006report/pdf/2006SurveillanceReport.pdf[PDF, 2.6MB]
At a glance – AIDS Cases (Children only)
|
2002 |
2003 |
2004 |
2005 |
2006 |
% of total 2006 cases |
|---|---|---|---|---|---|---|
Non-Hispanic Black |
70 |
46 |
33 |
38 |
30 |
79% |
Non-Hispanic White |
14 |
12 |
7 |
4 |
4 |
9% |
Total Population |
106 |
70 |
53 |
53 |
38 |
|
Source: CDC 2008. HIV/AIDS Surveillance Report: Cases of HIV infection and AIDS in the United States, 2006. v.18. Table 4.
http://www.cdc.gov/hiv/topics/surveillance/resources/reports/2006report/pdf/2006SurveillanceReport.pdf[PDF, 2.6MB]
At a glance –AIDS Cases by Transmission (Adults):
Transmission |
% of Non-Hispanic Black Cases |
% of Non-Hispanic White |
|---|---|---|
Male-to-male sexual contact |
45% |
75% |
Injection drug use |
27% |
10% |
Male-to-male sexual contact and injection drug use |
8% |
9% |
Heterosexual contact |
19% |
5% |
Other |
1% |
1% |
Source: CDC 2008. HIV/AIDS Surveillance Report: Cases of HIV infection and AIDS in the United States, 2006. v.18. Table 11.
http://www.cdc.gov/hiv/topics/surveillance/resources/reports/2006report/pdf/2006SurveillanceReport.pdf[PDF, 2.6MB]
Transmission |
% of Non-Hispanic Black Cases |
% of Non-Hispanic White |
|---|---|---|
Injection drug use |
30% |
38% |
Heterosexual contact |
68% |
59% |
Other |
2% |
3% |
Source: CDC 2008. HIV/AIDS Surveillance Report: Cases of HIV infection and AIDS in the United States, 2006. v.18. Table 11.
http://www.cdc.gov/hiv/topics/surveillance/resources/reports/2006report/pdf/2006SurveillanceReport.pdf[PDF, 2.6MB]
At a glance –AIDS Cases by Transmission (Male Adults and Adolescents):
Transmission |
# of Non-Hispanic Black Cases |
% of Non-Hispanic Black Cases |
# of Non-Hispanic White Cases |
% of Non-Hispanic White Cases |
|---|---|---|---|---|
Male-to-male sexual contact |
4,309 |
36% |
6,251 |
65% |
Injection drug use |
1,635 |
14% |
733 |
8% |
Male-to-male sexual contact and injection drug use |
526 |
4% |
732 |
8% |
Heterosexual contact |
1,875 |
16% |
416 |
4% |
Other |
3,579 |
30% |
1,400 |
15% |
Total Cases |
11,958 |
|
9,578 |
|
Source: CDC 2008. HIV/AIDS Surveillance Report: Cases of HIV infection and AIDS in the United States, 2006. v.18. Table 19.
http://www.cdc.gov/hiv/topics/surveillance/resources/reports/2006report/pdf/2006SurveillanceReport.pdf[PDF, 2.6MB]
Transmission |
# of Non-Hispanic Black Cases |
% of Non-Hispanic Black Cases |
# of Non-Hispanic White Cases |
% of Non-Hispanic White Cases |
|---|---|---|---|---|
Male-to-male sexual contact |
103,297 |
37% |
253,927 |
73% |
Injection drug use |
83,369 |
30% |
31,737 |
9% |
Male-to-male sexual contact and injection drug use |
22,134 |
8% |
31,434 |
9% |
Heterosexual contact |
29,952 |
11% |
7,850 |
2% |
Other |
40,268 |
14% |
16,469 |
5% |
Total Cases |
280,842 |
|
348,600 |
|
Source: CDC 2008. HIV/AIDS Surveillance Report: Cases of HIV infection and AIDS in the United States, 2006. v.18. Table 19.
http://www.cdc.gov/hiv/topics/surveillance/resources/reports/2006report/pdf/2006SurveillanceReport.pdf[PDF, 2.6MB]
At a glance – AIDS Cases by Transmission (Female Adults and Adolescents):
Transmission |
# of Non-Hispanic Black Cases |
% of Non-Hispanic Black Cases |
# of Non-Hispanic White Cases |
% of Non-Hispanic White Cases |
|---|---|---|---|---|
Injection drug use |
982 |
16% |
482 |
28% |
Heterosexual contact |
3,103 |
46% |
725 |
42% |
Other |
2,612 |
39% |
499 |
29% |
Total Cases |
6,739 |
|
1,725 |
|
Source: CDC 2008. HIV/AIDS Surveillance Report: Cases of HIV infection and AIDS in the United States, 2006. v.18. Table 21.
http://www.cdc.gov/hiv/topics/surveillance/resources/reports/2006report/pdf/2006SurveillanceReport.pdf[PDF, 2.6MB]
Transmission |
# of Non-Hispanic Black Cases |
% of Non-Hispanic Black Cases |
# of Non-Hispanic White Cases |
% of Non-Hispanic White Cases |
|---|---|---|---|---|
Injection drug use |
38,914 |
34% |
14,981 |
40% |
Heterosexual contact |
49,876 |
44% |
15,799 |
42% |
Other |
23,894 |
21% |
4,801 |
13% |
Total Cases |
114,375 |
|
37,574 |
|
Source: CDC 2008. HIV/AIDS Surveillance Report: Cases of HIV infection and AIDS in the United States, 2006. v.18. Table 21.
http://www.cdc.gov/hiv/topics/surveillance/resources/reports/2006report/pdf/2006SurveillanceReport.pdf[PDF, 2.6MB]
At a glance – Death Rate:
|
African Americans |
Non-Hispanic White |
African American/ |
|---|---|---|---|
All ages, Men (age-adjusted) |
28.2 |
3.0 |
9.4 |
All ages, Women (age-adjusted) |
12.0 |
0.6 |
20.0 |
|
|||
Age 25-44, Men |
36.2 |
4.9 |
7.4 |
Age 25-44, Women |
20.7 |
1.2 |
17.3 |
|
|||
Age 45-64, Men |
66.2 |
6.0 |
11.0 |
Age 45-64, Women |
22.0 |
1.1 |
20.0 |
Source: CDC 2007. Health, United States 2007. Table 42.
http://www.cdc.gov/nchs/data/hus/hus07.pdf#042[PDF, 6MB]
At a glance – AIDS Deaths:
|
2002 |
2003 |
2004 |
2005 |
2006 |
% of total 2006 cases |
|---|---|---|---|---|---|---|
African Americans |
9,037 |
8,675 |
8,581 |
8,679 |
7,426 |
51% |
Non-Hispanic White |
5,214 |
5,097 |
4,836 |
4,758 |
3,860 |
26% |
Total Population |
17,628 |
17,283 |
16,982 |
16,865 |
14,627 |
|
Source: CDC 2008. HIV/AIDS Surveillance Report: Cases of HIV infection and AIDS in the United States, 2006. v.18. Table 7.
http://www.cdc.gov/hiv/topics/surveillance/resources/reports/2006report/pdf/2006SurveillanceReport.pdf[PDF, 2.6MB]
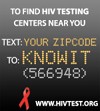
br /> At a glance – HIV Testing:
Non-Hispanic Black |
Non-Hispanic White |
Non-Hispanic Black/ |
|
|---|---|---|---|
Ever tested |
50.4% |
33.5% |
1.5 |
Never tested |
49.6% |
66.5% |
0.7 |
Source: CDC 2007. Summary Health Statistics for U.S. Adults: 2006. Table 41.
http://www.cdc.gov/nchs/data/series/sr_10/sr10_235.pdf[PDF, 3.7MB]
You will need Adobe Acrobat® Reader™ to view PDF files located on this site. If you do not already have Adobe Acrobat® Reader™, you can download here for free.
