|
|
| |
|
|
|
|
|
|
|
|
|
|
|
| | |||||||||||
| |
|
|||||||||||
 | |
| Issue 5 | 2006 |
|
In Brief |
|
Research suggests a strong relationship between the use of drugs and youth violence.1,2 The National Survey on Drug Use and Health (NSDUH) asks youths aged 12 to 17 to report on their involvement in violent behaviors during the 12 months before the survey. In this report, a past year violent behavior is defined as getting into a serious fight at school or work, participating in a group-against-group fight, or attacking others with the intent of seriously hurting them. NSDUH also includes questions about respondents' use of illicit drugs during the past year. Any illicit drug refers to marijuana/hashish, cocaine (including crack), inhalants, hallucinogens, heroin, and prescription-type drugs used nonmedically.3
This report presents the estimated number and percentage of youths aged 12 to 17 who engaged in violent behavior in the past year. It further compares rates of violent behavior for those who used and those who did not use illicit drugs in the past year. All findings presented in this report are annual averages based on combined 2002, 2003, and 2004 NSDUH data.
| Figure 1. Percentages of Youths Aged 12 to 17 Engaging in Past Year Violent Behavior, by Family Income Relative to Federal Poverty Threshold: 2002, 2003, and 2004 | Table 1. Percentages of Youths Aged 12 to 17 Engaging in Past Year Violent Behavior, by Past Year Illicit Drug Use and Sociodemographic Characteristics: 2002, 2003, and 2004 |
 |
 |
Based on data from 2002 through 2004, an estimated 31.6 percent of youths aged 12 to 17 (approximately 7.9 million adolescents) engaged in violent behavior in the past year.4 Rates of past year violent behavior were higher among youths aged 13, 14, and 15 (33.2, 33.3, and 33.1 percent, respectively) than those younger (age 12, 30.2 percent) or older (ages 16 and 17, 30.7 and 28.7 percent, respectively).
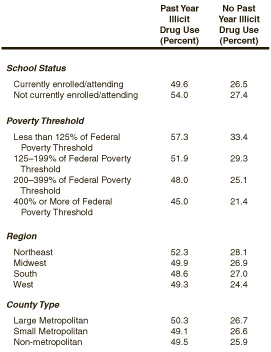
Males aged 12 to 17 were more likely than females in this age group to have engaged in violent behavior in the past year (35.6 vs. 27.4 percent). Additionally, adolescents who were not attending or enrolled in school at the time of the interview were more likely to have engaged in violent behavior than those who were attending or enrolled in school (39.9 vs. 31.4 percent). The rate of past year violent behavior was higher among adolescents in families with incomes less than 125 percent of the federal poverty threshold than those in income categories further above the poverty threshold (Figure 1).5
Adolescents in the West were less likely to have engaged in past year violent behavior (30.0 percent) than those in the South (31.5 percent), the Midwest (31.9 percent), and the Northeast (33.4 percent). However, rates of violent behavior were similar among youths in large metropolitan areas, small metropolitan areas, and non-metropolitan areas.
Youths aged 12 to 17 who used any illicit drug in the past year were almost twice as likely to have engaged in violent behavior as those who did not use any illicit drug (49.8 vs. 26.6 percent). This finding was consistent across age and gender, as well as other demographic and geographic variables (Table 1). For example, among adolescents who lived in the Northeast, 52.3 percent of those who used an illicit drug reported violent behavior compared to 28.1 percent of those who did not use an illicit drug.
| Table 2. Percentages of Youths Aged 12 to 17 Engaging in Past Year Violent Behavior, by Type of Illicit Drug Used in Past Year: 2002, 2003, and 2004 | Figure 2. Percentages of Youths Aged 12 to 17 Engaging in Past Year Violent Behavior, by Number of Illicit Drugs Used in the Past Year: 2002, 2003, and 2004 |
 |
 |
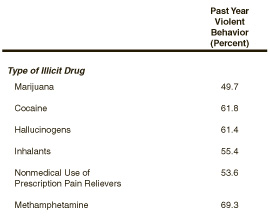
An estimated 49.7 percent of the adolescents who used marijuana in the past year engaged in past year violent behavior, as did 55.4 percent of those who used inhalants (Table 2). About two-thirds (69.3 percent) of the adolescents who used methamphetamine in the past year engaged in past year violent behavior.
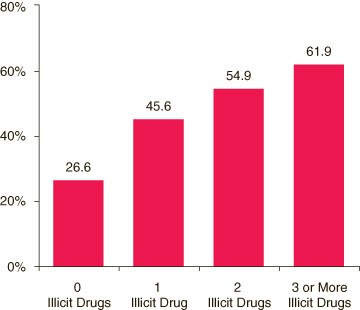
The likelihood of having engaged in violent behavior increased with the number of drugs used in the past year.6 Approximately 26.6 percent of adolescents who did not use any illicit drugs reported past year violent behavior compared to 45.6 percent of those who used 1 illicit drug, 54.9 percent of those who used 2 illicit drugs, and 61.9 percent of those who used 3 or more illicit drugs (Figure 2).
Source: SAMHSA, 2002, 2003, and 2004 NSDUHs.
| The National Survey on Drug
Use and Health (NSDUH) is an annual survey sponsored by the Substance Abuse and
Mental Health Services Administration (SAMHSA). Prior to 2002, this survey was
called the National Household Survey on Drug Abuse (NHSDA). The 2002, 2003, and
2004 data are based on information obtained from 68,611 persons aged 12 to 17.
The survey collects data by administering questionnaires to a representative
sample of the population through face-to-face interviews at their place of
residence. The NSDUH Report is prepared by the Office of Applied Studies (OAS), SAMHSA, and by RTI International in Research Triangle Park, North Carolina. (RTI International is a trade name of Research Triangle Institute.) Information on NSDUH used in compiling data for this issue is available in the following publications: Office of Applied Studies. (2005). Results from the 2004 National Survey on Drug Use and Health: National findings (DHHS Publication No. SMA 05-4062, NSDUH Series H-28). Rockville, MD: Substance Abuse and Mental Health Services Administration. Office of Applied Studies. (2004). Results from the 2003 National Survey on Drug Use and Health: National findings (DHHS Publication No. SMA 04-3964, NSDUH Series H-25). Rockville, MD: Substance Abuse and Mental Health Services Administration. Office of Applied Studies. (2003). Results from the 2002 National Survey on Drug Use and Health: National findings (DHHS Publication No. SMA 03-3836, NSDUH Series H-22). Rockville, MD: Substance Abuse and Mental Health Services Administration. Also available online: http://www.oas.samhsa.gov Because of improvements and modifications to the 2002 NSDUH, estimates from the 2002, 2003, and 2004 surveys should not be compared with estimates from the 2001 or earlier versions of the survey to examine changes over time. |
The NSDUH Report (formerly The NHSDA Report) is published periodically by the Office of Applied Studies, Substance Abuse and Mental Health Services Administration (SAMHSA). All material appearing in this report is in the public domain and may be reproduced or copied without permission from SAMHSA. Additional copies of this report or other reports from the Office of Applied Studies are available on-line: http://www.oas.samhsa.gov Citation of the source is appreciated. For questions about this report, please e-mail: shortreports@samhsa.hhs.gov
|
This page was last updated on December 30, 2008. |
|
SAMHSA, an agency in the Department of Health and Human Services, is the Federal Government's lead agency for improving the quality and availability of substance abuse prevention, addiction treatment, and mental health services in the United States. 
* PDF formatted files require that Adobe Acrobat Reader® program is installed on your computer. Click here to download this FREE software now from Adobe. |