In the last decade, genomic technologies have become gradually integrated into several phases of drug development. In the field of toxicology, drug safety laboratories have begun to use these technologies to assist research to conduct toxicity evaluations on as many potential lead compounds as feasible and to gain a better understanding of the mechanisms of toxicities. For investigators to be successful in the selection of compounds most likely to succeed during preclinical development, the methods they use should have a medium throughput, a short turnaround time, a good predictivity, and be reproducible.
In vitro systems are being used in toxicology studies to determine several kinds of toxicities. Mouse lymphoma cells, primary rat hepatocytes, and human lymphocytes are among the mammalian cell systems used to determine mutagenicity (Kilbey et al. 1984). Primary rat or human hepatocytes are used to determine cytotoxicity as well as metabolism of compounds or their ability to induce cytochrome P450 genes (Gómez-Lechón et al. 1988; Paillard et al. 1999). However, only a few laboratories have investigated whether in vitro systems can be used in the toxicogenomics evaluation of development compounds. Harries et al. (2001) used the human liver HepG2 cell line to investigate gene expression changes of two hepatotoxins. The results strongly suggested that different mechanisms of hepatotoxicity may be associated with specific markers of gene expression. Waring et al. (2001) showed that gene expression profiles for compounds with similar mechanisms of toxicity tested in vitro on primary rat hepatocytes formed clusters, suggesting a similar effect on transcription. Conversely, Boess et al. (2003) characterized several hepatic in vitro systems on the basis of gene expression profiling and concluded that the results were poorly comparable with the in vivo outcome, depending on the cell culture system used. It is therefore essential to obtain more knowledge on the in vitro system used to achieve better understanding and interpretation of genomics data.
As genomics technologies have been introduced more and more in toxicology, the International Life Sciences Institute Health and Environmental Sciences Institute (ILSI/HESI) has formed a consortium with more than 30 pharmaceutical companies to address the issues of reliability and reproducibility of these assays (Robinson et al. 2003). Within the ILSI/HESI consortium, the hepatotoxicity working group evaluated the two hepatotoxicants methapyrilene (MP) and clofibrate by gene expression analysis of rat livers (Baker et al. 2004; Chu et al. 2004; Hamadeh et al. 2002; Pennie et al. 2004; Ulrich et al. 2004; Waring et al. 2004). The results of these studies showed that the transferability of microarray technologies between laboratories posed serious protocol-related issues that could be solved only with appropriate and sophisticated statistical tools (Waring et al. 2004).
In the present study, a toxicogenomics experiment using primary rat hepatocytes was performed in the laboratories of four pharmaceutical companies: Bayer HealthCare AG (BA), Boehringer Ingelheim Pharma GmbH & Co. KG (BI), F. Hoffmann-La Roche Ltd. (RO), and Schering AG (SAG). The cell cultures were exposed to two concentrations of MP, an H1 histamine receptor antagonist (Noguchi et al. 1992) that is known to cause periportal cell necrosis (Steinmetz et al. 1988) and liver tumors in rats (Liijnski et al. 1980; Mirsalis 1987). The study was designed to assess the biologic and experimental variability of the in vitro systems of the laboratories, to compare their statistical analysis strategies, and to determine whether an in vitro toxicogenomics experiment, performed in different laboratories from cell culture to data analysis, would identify a toxic compound with the same reliability.
To reduce the experimental variability, a cell culture protocol with a standardization of the main parameters such as culture medium was used. However, many steps, including perfusion and RNA isolation, followed the individual in-house protocols. Each laboratory performed Affymetrix gene expression analysis on the RG-U34A chip and analyzed the data according to its own methods/software.
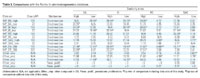
Table 1.
|
Test article and formulation. Methapyrilene hydrochloride (CAS no. 135-23-9, lot no. 037F0929) was obtained from Sigma Chemical Corp. (St. Louis, MO, USA). MP was formulated in dimethyl sulfoxide (DMSO).
Primary rat hepatocytes. Primary rat hepatocytes were isolated from 10- to 12-week-old male Han:WIST rats (200-300 g body weight; SAG: Tierzucht Schoenwalde GmbH, Schoenwalde, Germany; BA: Harlan Winkelmann, Borchen, Germany; BI: Charles River Deutschland GmbH, Sulzfeld, Germany; RO: RCC Ltd., Itingen, Schweiz) by a two-step collagenase liver perfusion method (Seglen 1972). After perfusion the liver was excised and the cells were resuspended in William's E medium (WME) without phenol red and filtered. Dead cells were removed by a Percoll (Sigma) centrifugation step (Percoll density, 1.06 g/mL, 50 g, 10 min; only at RO and SAG). Primary hepatocyte viability was assessed by trypan blue exclusion and ranged between 72 and 92% (Table 1).
Cells were cultured in six-well plates coated with collagen (Menal GmbH, Herbolzheim, Germany) at a density of 106 cells/well in 2 mL WME supplemented with 10% fetal calf serum (Invitrogen Technologies, Paisley, UK), glutamine (2 mM), hydrocortisone (54 ng/mL), glucagon (7 ng/mL), insulin (5 µg/mL), penicillin (100 U/mL), streptomycin (100 mg/mL), and gentamicin (10 µg/mL) at 37°C in an atmosphere of 5% CO2/95% air. After an attachment period of 3 hr, the medium was replaced by 2 mL serum-free WME, with the same supplements.
Treatment conditions. To determine the concentration of MP that causes a toxic response in hepatocytes, each laboratory performed two-dose finding studies. After an overnight preculture period of 16-18 hr, the cells were treated with MP, 0-300 µM (BA and RO), and 0-1,000 µM (BI and SAG) in 0.2% DMSO (final concentration) or vehicle (0.2% DMSO, final concentration). The same procedure was performed for the main study, using the two selected concentrations.
Biochemistry. Cytotoxicity was determined as lactate dehydrogenase (LDH) release into the cell culture medium. LDH activity was determined spectrophotometrically with commercially available test kits (Table 1). Enzyme activity in the medium was determined and expressed as percentage of LDH activty present in the medium of vehicle-treated cells.
RNA isolation. Cells were harvested at 24 hr after treatment either in Qiagen lysis buffer (RNeasy mini kits; Qiagen, Hilden, Germany) without (BA and SAG) or with proteinase K (BI) or in RNAzol/Bio101 (RO) (RNAzol: Tel-Test, Inc., Friendswood, TX, USA; Bio101: Buena Vista, CA, USA). Total RNA was isolated using Qiagen RNeasy columns. The quality of the RNA was determined using the Agilent Bioanalyzer (Agilent Technologies, Palo Alto, CA, USA). Amounts of RNA were determined with RiboGreen (Molecular Probes, Leiden, the Netherlands) or by OD260/OD280 determination.
DNA microarray analysis. Processing of RNA and microarray experiments were carried out basically as recommended by Affymetrix (Affymetrix, Inc., High Wycombe, UK) (Lockhart et al. 1996), with some user-specific variations (Table 1). Labeled in vitro transcripts (10-20 µg) for each RNA sample were hybridized on the RG-U34A array. A starting amount of 5-20 µg total RNA was used for the synthesis of double-stranded cDNA with a commercially available kit (Superscript Choice System; Invitrogen Life Technologies) in the presence of a T7-(dT)24 DNA oligonucleotide primer. The cDNA was purified by phenol/chloroform/isoamyl alcohol extraction and ethanol precipitation or using the Affymetrix cleanup columns. The purified cDNA was then transcribed in vitro (Enzo Diagnostics, Inc., Farmingdale, NY, USA; Ambion, Inc., Austin, TX, USA) in the presence of biotinylated ribonucleotides to form biotin-labeled cRNA. The labeled cRNA was purified on an affinity resin (RNeasy, Qiagen, or Affymetrix cleanup), quantified, and fragmented. Labeled cRNA (10-20 µg) was hybridized for approximately 16 hr at 45°C onto the RG-U34A array. The arrays were washed and stained with streptavidin-R-phycoerythrin (SAPE, Molecular Probes, CA, USA), and the signal was amplified using a biotinylated goat anti-streptavidin antibody (Vector Laboratories, Burlingame, CA, USA) followed by a final staining with SAPE. Arrays were stained using the GeneChip Fluidics Workstation 400 (Affymetrix). The arrays were then scanned using a confocal laser scanner (GeneArray Scanner 2500; Hewlett Packard, Palo Alto, CA, USA, or Agilent Technologies) resulting in an image file (*.DAT file). Using the Affymetrix software, *.CEL files were calculated from the image files.
Data analysis. The *.DAT and *.CEL files were distributed among the participants. The data were condensed and normalized (Table 1). The individual analysis strategy of the raw data is described below.
Investigators at BA identified the genes that are regulated to a statistically significant extent by performing a t-test (Welch's modification; Welch 1938) between the control group and each of the treatment groups using Expressionist software (GeneData, Basel, Switzerland). A p-value of 0.01 was chosen in conjunction with a 1.5-fold change cutoff.
Investigators at BI, in addition to the values derived from Microarray Analysis Software (MAS, version 5.0; Affymetrix), performed analysis calculations using the Statistical Analysis System (SAS) software (version 6.12; SAS Institute, Cary, NC, USA). To extract differential expressed genes, the following cutoff criteria were defined. The extracted genes must have a p-value of 0.05 (one-sided) according to the Mann-Whitney U-test. In addition, each probe set (gene) with a fold change value of at least 1.2 was selected. This approach was used as a first filter (and not considered statistically significant). The generated data can then be analyzed by using in-house marker genes [selected in earlier studies of a licensed database (DB)] or in-depth analysis of single selected genes.
Investigators at RO compared treated and control groups and statistical analyses were performed with in-house developed software. Gene expression changes are measured by the Affymetrix software as fluorescence intensities with a given signal (numerical value) and a qualifier or call (present, absent, marginal). If probe sets are detected as expressed, the call is set to 1; if the probe set is absent, this value is set to 0, and if marginal to 0.5. To allow comparability between microarrays, the signal is scaled using the mean intensity of all probe sets on a chip. The numerical values for several replicates are condensed by using the mean and the SD. Differences in expression levels are expressed as change factors (CHGF), which report the change in expression (signal) between two experimental conditions (baseline = control and treated). If an increase is seen, CHGF is calculated as [(signal treated/signal control) - 1]; for a decrease it is [- (signal control/signal treated) + 1]. Thus, the data are symmetrically distributed around 0; a 2-fold increase gives a CHGF of 1, whereas a 50% reduction gives a CHGF of -1. Statistical analysis was based on analysis of variance and Student's t-test. Gene probes considered "expressed" in 50% of the samples (call ≥ 0.5) and showing fold changes > 1.25 or < -1.25 with a significance value of at least 0.1 (paired t-test) in one of the individual data sets were selected.
Investigators at SAG, compared treated and control groups, and statistical analyses were performed with Expressionist software. To extract differentially expressed genes, a t-test was used. Genes with a p-value < 0.01 and a fold change > 1.5 were extracted from every participant's experiment set of three.
Comparison with an in vitro toxicogenomics database. The data sets processed by RO were compared with the Roche proprietary in vitro toxicogenomics DB consisting of 17 compounds that had been tested previously in at least two concentrations. These compounds were tested following Roche-specific cell culture protocols, which were similar but not identical to the protocol described here. Among them was a previous experiment with MP on rat primary hepatocytes at two concentrations (MP_DB; 100 and 300 µM). The comparisons are based on the individual gene expression ratios (fold changes).
|
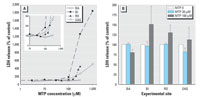
Figure 1. LDH release in the culture medium. (A) Pilot study. (B) Main study (n = 3). Inset in A shows the increase in LDH release at 100 µm MP.
|
|

Figure 2. One-dimensional hierarchical clustering of all experiments using all genes of the RG-U34A GeneChip. Distance metric used: positive correlation.
|
Table 2.
|
|
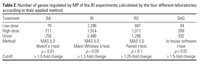
Figure 3. (A) PCA of all experiments using the union of genes regulated by MP according to the method of SAG (744 probe sets). Distance metric used: covariance matrix. (B) One-dimensional hierarchical clustering of all experiments using the union of genes regulated by MP according to the method of SAG (744 probe sets). Distance metric used: positive correlation.
|
|
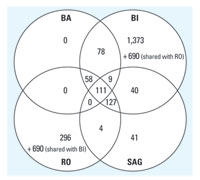
Figure 4. Venn diagram depicting the differentially expressed genes of the BI experiments determined by the four different analysis strategies.
|
|
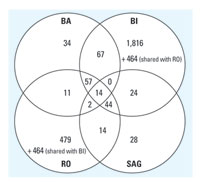
Figure 5. Venn diagram depicting the differentially expressed genes of each company's experiments determined by its own analysis strategy.
|
Table 3.

|
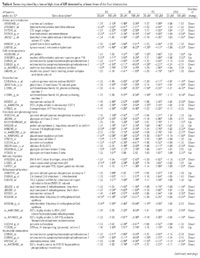
Table 4, part 1.
|
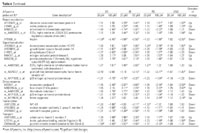
Table 4, part 2.
|
Table 5.
|
Biochemistry. In a pilot study the four different laboratories performed a cell culture experiment by incubating primary rat hepatocytes with several concentrations of MP (0-1,000 µM) and analyzing liver enzyme (LDH) release into the medium 24 hr after treatment. Of the four companies, three showed a slight but significant increase of LDH release into the medium at a concentration of 100 µM MP, whereas at a lower dose (20 µM) there was no enhanced LDH leakage compared with untreated cultures (Figure 1A). On the basis of this result, investigators chose a high dose of 100 µM and a low dose of 20 µM for the toxicogenomics experiments.
As anticipated from the results of the pilot experiments, a tendency toward increased LDH release was seen after 24-hr treatment with 100 µM MP during the toxicogenomics experiment (Figure 1B). However, in agreement with the pilot experiment (Figure 1A), this was not seen in all companies. It is important to note that the absolute values of LDH release in the vehicle controls varied considerably between the individual repeats within as well as between the companies, depending on the respective batch of freshly isolated hepatocytes and the different methodologies used to measure the LDH. Therefore, the results were expressed as percentage of LDH release in vehicle-treated cells.
Gene expression--comparisons across users. In the toxicogenomics experiment rat primary hepatocytes were incubated with 0, 20, or 100 µM of MP for 24 hr and analyzed for gene expression responses using Affymetrix GeneChips. The raw data (*.CEL and *.DAT files) were exchanged among the participants of this study for individual analysis.
Analysis of all data sets with one method. All data sets were analyzed following the analysis strategy from SAG. First, to obtain a general overview of similarities among experimental data sets, a one-dimensional hierarchical clustering (Figure 2) was performed on all data sets. This analysis shows that the data sets cluster together according to their origin. The differences in the gene expression responses are greater between different laboratories than between treated and control hepatocytes.
In the next round of analyses, SAG identified differentially regulated probe sets for each of the participating laboratories (t-test with p < 0.01 plus fold change > 1.5). This approach eliminates the variability caused by different analysis strategies and reveals the variability due to hepatocyte culture and chip processing protocols. In all studies a substantial increase in regulated probe sets is seen when the MP dose is increased (data not shown). The data set generated from the BI study appeared to have significantly more differentially regulated probe sets at the low dose compared with the other laboratories, whereas the data set of SAG showed the fewest changed probe sets at the high dose. The union of all differentially expressed probe sets results in a number of 744. The overlapping number of probe sets detected as regulated in the experiments of all four users was only five and in at least three of four experiments was 46 (data not shown). The highest concordance between two companies, defined as percentage of "own" genes shared with another company, was 34% (data not shown). When using all 744 probe sets detected as regulated in a principal component analysis (PCA), a distinct separation can be achieved between the untreated samples and those treated with the high-dose MP (Figure 3A). This is in good agreement with the biochemistry data, which showed that slight cytotoxicity was observed at the highest dose of MP, at least by most of the companies. The low-dose samples do not separate well from the untreated for all laboratories. This low dose was chosen as a dose that would not show toxicity based on LDH release. The data show that PC1 (accounting for 15.4% of the variance) drives the treatment-related differences as indicated by the arrows, whereas PC2 (accounting for 8.9% of the variance) shows a separation of the individual laboratories.
The same group of probe sets was used in an unsupervised clustering method, hierarchical clustering. The dendrogram (Figure 3B) shows a clustering of the low-dose samples with their untreated counterparts as well as a clustering of the high-dose samples. The only exception is one of the low-dose samples of BI that clusters together with the high-dose sample of the same experiment.
Analysis of one data set with different methods. The four laboratories used very different analysis approaches with different main objectives (described in "Materials and Methods" and Table 2). To evaluate the differences of the resulting gene lists generated by the analysis method, the four participating laboratories analyzed one data set (*.DAT or *.CEL files provided by BI) according to their own standard methods. The methods used basically selected genes according to p-values from a given statistical test and fold changes (Table 2). RO and BI used a relatively low stringency to select a high number of differentially regulated genes, which then can be compared with their gene expression DB to search for similarities with known toxic compounds. BA and SAG used methods with a higher stringency to obtain gene lists with a low number of false positives. The resulting genes are then annotated and assigned to pathways to determine their biologic significance with respect to the mechanism of toxicity of the investigated compound. Table 2 lists the number of genes found with each method, and Figure 4 displays a Venn diagram depicting the number of genes shared between the different analysis methods. As expected, the different analysis strategies have an immense impact on the number of genes that are defined as differentially regulated. A total of 111 genes were detected with all four methods, whereas three of four methods detected an additional 194 genes (i.e., at least three of four methods detected 305 genes).
Analysis of each data set with individual methods. Each laboratory analyzed its own data set using the specific methods as described in "Materials and Methods." The resulting lists of differentially expressed genes are given in Table 3. Again, as expected, more stringent criteria used by BA and SAG detected only 126 and 185 probe sets as changed, respectively; whereas BI and RO obtained 2,486 and 1,085 probe sets, respectively. Comparison of the gene lists resulting from these analyses shows that BA and SAG share 45% or more of their changed probe sets with BI and RO but only 9-16% with each other. The Venn diagram in Figure 5 shows the relation between the different gene lists. Fourteen genes were detected as regulated by all companies, and an additional 103 genes by three of four companies. The identity of the regulated genes as well as the affected cellular pathways and their biologic significance were determined (Table 4). The probe sets consistently detected by all involved users are associated with detoxification, mitochondrial function, energy production, cell stress, and many general housekeeping processes.
Comparison with a gene expression database. The gene expression profiles of the high- and low-dose MP from the experiments performed in the individual companies (*.DAT files) and analyzed with the strategy of RO were compared with the Roche in vitro toxicogenomics DB. At the time of analysis, this proprietary DB contained 47 data sets from 17 different hepatotoxic compounds. The comparison revealed that the high-dose data of each company, except those of SAG, fitted best to the Roche MP data, which were generated in a previous, independent experiment (Table 5). The high dose of SAG and the low doses of all companies were more difficult to predict. When the data sets of this study were incorporated in the DB, the MP data from each company always fitt best to the data from this experiment of the other companies. In most cases, this was also true for the low-dose experiments (Table 5).
The aim of this multisite experiment was to obtain an estimate of lab-to-lab variability for in vitro gene expression analysis and to determine whether an in vitro toxicogenomics experiment performed in different laboratories from cell culture to data analysis would identify a toxic compound with the same reliability. The toxicogenomics in vitro approach shows the known advantages of other in vitro test systems, namely, the reduction of the number of animals used for biologic assays as well as the time involved and the cost of the assays. For this investigation, we selected the well-known nongenotoxic hepatocarcinogen MP, which had earlier been chosen as a model hepatotoxin within the ILSI/HESI consortium. To comply with minimal statistical requirements (Lee et al. 2000), each experiment was performed in triplicate using three different batches of primary rat hepatocytes. The number of replicates required to achieve the necessary statistical power was not addressed in this work. Although the main cell culture conditions were standardized, slight differences were already observed when comparing the cytotoxicity of various concentrations of MP during the pilot studies performed to define suitable concentrations. Although increased LDH release was observed with concentrations of 100 µM MP and above in three of the four companies, no increased LDH leakage was observed by BA with concentrations up to 300 µM in a pilot experiment (Figure 1A). The reason for this was not investigated further, and concentrations that caused only marginal or no LDH release were chosen for the main experiment (20 and 100 µM).
Analysis of the gene expression data with one-dimensional hierarchical clustering using the whole set of genes available on the RG-U34A GeneChip revealed that the differences between laboratories were greater than the differences between treatment groups. This was not surprising, as it has already been observed in an interlaboratory analysis reported by Waring et al. (2004). However, when focusing on the statistically significant gene expression changes from the data sets of all laboratories (genes were obtained by using the statistical methods of laboratory SAG: t-test, p < 0.01, fold change > 1.5), the clustering results reflected the experimental design, allowing the high-concentration samples to be separated from the controls and low-dose samples (Figure 3B). In addition the hepatocyte cultures of BA and BI appeared to be more sensitive to MP treatment than those of RO and SAG because PCA showed the separation of the low dose from the untreated for BA and BI. This might be because RO and SAG perform a Percoll gradient to separate the live hepatocytes from dead cells. This also removes other cell types from the preparation and might affect the sensitivity of the test system. Thus, using a suitable statistical method, the effect of the treatment supersedes the experimental variability. Differences on the experimental systems such as cell preparation (Percoll purification step) were also detected. In addition to the statistical methods applied by SAG, RO used its own analysis method and cutoff values from all data sets to compare each of them with a reference in vitro toxicogenomics DB. This proprietary DB contained 17 known toxic compounds tested on rat hepatocytes, including an independent exposure to MP under slightly different experimental conditions. For three of the data sets (BA, BI, RO), the gene expression profiles allowed the correct identification of MP as the best match in the DB, independently of the site where the experiment was performed.
Next, we investigated the influence of the use of different data analysis strategies to identify altered genes on the same data set. The individual analysis methods are described in Table 2, including differences in the definition of cutoff values for parameters such as fold change or p-value. The arbitrary choice of these cutoff values is not trivial and greatly influences the outcome of the analysis. On the one hand, stringent cutoff values lead to a smaller false-positive rate and a high false-negative rate (or low power). This approach can be recommended if each single gene will be interpreted and discussed regarding safety assessment. However, important signals might be missed because relatively small changes in expression may be of high biologic and toxicologic relevance. On the other hand, less stringent filtering criteria cause a high number of false positives but ensure that no relevant genes will remain undetected. In our case, BA and SAG used stringent statistical approaches (t-test with p-value < 0.01, fold change > 1.5 fold), whereas BI and RO used smaller fold changes as cutoff criteria (1.2-fold or 1.25-fold, respectively). As expected, BA and SAG detected fewer regulated genes than did BI and RO (Figure 4, Table 2). For BI the obtained gene list was used as a first-pass filter for the comparison with in-house defined marker genes or for hypothesis generation with a subsequent in-depth analysis of selected genes. When all companies analyzed their own data with their own methods, only 14 probe sets were considered deregulated by all the users in all experiments, and an additional 103 were detected by three of the four laboratories (Figure 5). This demonstrates that an additional layer of complexity and a source of differing interpretation originate from different statistical analysis methods.
The gene changes observed after 24 hr of incubation with the test compound might not be ideal to elucidate the primary events (cause) that trigger the hepatotoxicity of MP. However, the elucidation of downstream gene expression changes, indicative of general cellular dysfunction as a consequence of MP toxicity is valuable as a possible predictor for hepatotoxicity. The identity of the genes that were found changed in at least three of four laboratories (117 genes) represent biologically relevant processes that are obviously affected by MP. Several genes involved in amino acid and nucleotide metabolism were down-regulated. Also, the expression of genes that play a role in the cell cycle and/or apoptosis was changed by MP. Among them, the mitogen-activated protein kinase 6 and ornithine decarboxylase antizyme inhibitor were up-regulated, whereas ectonucleotide pyrophosphatase/phosphodiesterase 2 and insulin growth factor-binding protein were down-regulated. These signals appear contradictory because those genes promoting cell proliferation are not regulated in the same direction. However, the detected changes were generally consistent across users, increasing the confidence in the findings. Another affected pathway involved genes related to the glutathione homeostasis. Ratra et al. (2000) showed that the levels of reduced glutathione are increased to 140% of the control after administration of MP to male Han:Wistar rats. In agreement with this, our experiments show that MP had a substantial effect on genes involved in glutathione metabolism (5-oxoprolinase) and glutathione conjugation (glutathione S-transferase 3 and Yb). Also, other genes involved in detoxification, such as l-gulono-gamma-lactone oxidase and sulfotranferase family 1A were down-regulated. MP also seems to have an effect on the energy balance of the liver. Many genes in the glycolysis pathway and several genes involved in mitochondrial function were down-regulated by the treatment. This finding is also in agreement with previous results obtained in vivo and in vitro. It has been described that MP leads to a significant increase in mitochondria of periportal hepatocytes in rats (Reznik-Schuller and Lijinski 1981). Also, MP caused mitochondrial dysfunction, as detected by mitochondrial swelling, significant losses of ATP, and loss of mitochondrial calcium homeostasis in cultured hepatocytes (Ratra et al. 1998). In addition to the metabolic and energy impairment responses, MP elicits a stress response in the hepatocytes. Reactive oxygen producing systems are repressed, and stress-response genes are up-regulated. This is indicative of the oxidative stress produced by MP (Ratra et al. 1998) and was also described using gene expression profiles of livers of rats treated with MP (Waring et al. 2004). We observed the up-regulation of the ribosome associated membrane protein 4, which belongs to a family consisting of several ribosome associated membrane protein sequences that are known to stabilize membrane proteins in response to stress (Yamaguchi et al. 1999). Also, the myeloid differentiation primary response gene 116 (Gadd34), whose overexpression promotes apoptosis (Hollander et al. 2003), was detected as induced. The Gadd family is known to be up-regulated upon cellular stress and was strongly up-regulated by MP after in vivo exposure (Waring et al. 2004). Because we analyzed the toxicity of MP in isolation, we cannot determine which of these gene changes are specific to MP or might be regulated by other compounds. Also, most of the gene-by-gene changes described occurred at the high concentration, concomitant with slight cytotoxicity. However, some of the differentially expressed genes were also detected at the low dose by some laboratories. It was clear from the clustering data that both RO and SAG could not separate the low dose from the untreated samples. Gene expression data from BA and BI, however, showed that > 25% of the genes were already detectable at the low concentration (Table 4). These two laboratories did not perform a Percoll purification step during the hepatocyte isolation procedure. This interesting finding led us to the hypothesis that in the presence of additional cell types not eliminated by a Percoll purification step (e.g., Kupffer cells or damaged hepatocytes), gene expression changes occur already at concentrations that do not show an effect on the viability of the cells. Further experiments with controlled cell compositions should be performed to clarify this point and define the best-suited in vitro system in terms of sensitivity.
Our results show that several factors from experimental conditions to statistical data analysis contribute to the interlaboratory variability observed for gene expression results. Our data and other published results (Harries et al. 2001; Waring et al. 2001) show that in vitro assays coupled with microarray analysis are useful for detection of hepatotoxicity and mechanistic elucidation of cellular events related to it. This applies best when the experimental and analytical variability is reduced to a minimum, which cannot always be ensured. However, we were able to show that using suitable statistical analysis tools, we could, despite the experimental variability, uncover the commonalities among the experiments. We demonstrated that using a subset of deregulated genes for the analysis, the effects of a high concentration of MP on the cells supersede the interlaboratory variability and that this variability does not mask clear treatment-dependent effects. This finding agrees with a similar analysis performed in vivo (Waring et al. 2004) and also held true when we compared the data obtained at several sites with one in vitro toxicogenomics DB. The encouraging outcome of the comparison with an independent DB is pivotal and indicates that gene expression profiles have the potential to be used as a diagnostic tool for toxicology. However, it is also clear from the presented results that the differences between laboratories make the gene-by-gene comparison of gene expression data from different sources very difficult. This task can be undertaken only with sound statistical tools that allow a relevant subset of genes to be selected.
From a mechanistic point of view, it is important to note that there was good concordance among all users regarding the affected biologic processes, as shown in Table 4. Most of the consistently regulated genes play a role in detoxification/metabolism, processes of growth and death control, immune response, stress, and transport. This indicates that the interpretation of the data from different sources leads to similar conclusions in terms of toxicity and underlying mechanisms despite the differences in number and identity of genes and in the intensity of the regulation.
In summary, our data show that both experimental and statistical variability are important sources of different outcomes between laboratories. To minimize the experimental variation, it is advisable to perform the cell culture and microarray experiments whenever possible at the same experimental site. This is not always possible because often experimental protocols need to be transferable. In these cases, suitable and robust statistical analyses help overcome the differences. Also, we showed that cellular mechanisms involved in MP toxicity can be consistently detected, as illustrated by the gene expression changes listed in Table 4. In addition the positive outcome of the comparison with an in vitro DB underlines that microarray analyses of in vitro systems are robust and can be predictive of toxicity. Whether the involved cellular pathways are specific for MP and are causal to the toxicity in vitro and/or in vivo requires further investigations.