|
|
|
|
Breast and Colon Cancer Family Registries
About Colon CFR: Colon-CFR Summary Data
Table 1: Summary Data and Biospecimen Collection by Ascertainment Source
and Participant Type for Phase I and Phase II
| |
Population-based
Ascertainment |
Clinic-based
Ascertainment |
Total |
| Phase-I |
Phase-II |
Phase-I |
Phase-II |
Phase-I & II |
| CRC-Affected Proband |
| with epidemiology data |
5,111 |
2,141 |
441 |
448 |
8,141 |
| with blood or mouthwash sample |
4,661 |
1,852 |
450 |
415 |
7,378 |
| with tumor block |
4,391 |
1,131 |
406 |
383 |
6,311 |
| Unaffected Proband |
| with epidemiology data |
N/A |
N/A |
145 |
83 |
228 |
| with blood or mouthwash sample |
N/A |
N/A |
142 |
117 |
259 |
| CRC-Affected Relative |
| with epidemiology data |
533 |
132 |
516 |
143 |
1,324 |
| with blood or mouthwash sample |
425 |
126 |
506 |
132 |
1,189 |
| with tumor block |
433 |
100 |
596 |
149 |
1,278 |
| Unaffected Relative |
| with epidemiology data |
12,332 |
2,923 |
3,273 |
1,288 |
19,816 |
| with blood or mouthwash sample |
5,913 |
2,539 |
3,053 |
1,233 |
12,738 |
| Population-based Control |
| with epidemiology data |
3,754 |
354 |
0 |
0 |
4,108 |
| with blood or mouthwash sample |
2,431 |
301 |
0 |
0 |
2,732 |
| Spouse Control |
| with epidemiology data |
720 |
68 |
195 |
0 |
983 |
| with blood or mouthwash sample |
688 |
70 |
200 |
0 |
958 |
| |
| Represents recruitment and data collection through December
31, 2006 |
Table 2: Summary of Biospecimens
Dispatched to Date by Type
| Common Sample Types |
Total # samples dispatched |
| Genomic DNA |
96,117 |
| Tissue sections on slides |
21,699 |
| Slow-frozen lymphocyte cells |
20,898 |
| PET Tissue DNA |
16,729 |
| Plasma |
2,128 |
| DNA from Buccal Cells |
255 |
| RNA |
58 |
| LCL (lymphoblast cell line) |
41 |
| Fresh frozen tissue DNA |
2 |
| TOTAL |
157,927 |
Table 3: General Characteristics of Phase-I Colon CFR Probands
| PROBANDS |
TOTAL |
| Sex |
| Male |
3,273 |
| Female |
3,323 |
| Age at diagnosis |
| <30 years |
66 |
| 30-39 years |
366 |
| 40-49 years |
1,134 |
| 50-59 years |
1,888 |
| 60-69 years |
2,177 |
| ≥70 years |
965 |
| Primary site |
| Colon (ICD-O: 18.0, 18.2-18.7) |
2,930 |
| Rectum (ICD-O: 19.9, 20.9, 21.8) |
1,858 |
| Colorectal (ICD-O: 18.8, 18.9, 26.0) |
381 |
| Appendix (ICD-O: 18.1) |
37 |
| Multiple sites (synchronous primaries) |
156 |
| Proband’s FDR history of CRC |
| 0 affected FDRs |
4,757 |
| 1 affected FDR |
1,451 |
| ≥2 affected FDRs |
388 |
| Race |
| American Indian/Alaska Native |
58 |
| Asian |
280 |
| Native Hawaiian or Other Pac.Islander |
27 |
| Black or African American |
140 |
| White |
5,806 |
| More Than One Race |
102 |
| Unknown or Not Reported |
183 |
| |
Only incident cases recruited during the funding period (1998-2002)
are reported.
Additional cases (either that were not selected for full
enrollment based on their
family history or were prevalent cases are
excluded from this report). |
Table 4: Active Follow-up on Phase I Enrollees
| Population-based enrollees |
Total |
| Probands eligible for active follow-up |
4,088 |
| Probands with active follow-up completed to date |
3,248 |
| Relatives with active follow-up completed |
9,140 |
| Clinic-based cases enrollees |
Total |
| Probands eligible for active follow-up |
578 |
| Probands with active follow-up completed to date |
502 |
| Relatives with active follow-up completed |
2,821 |
Table 5: Phase I Molecular Characterization Scheme
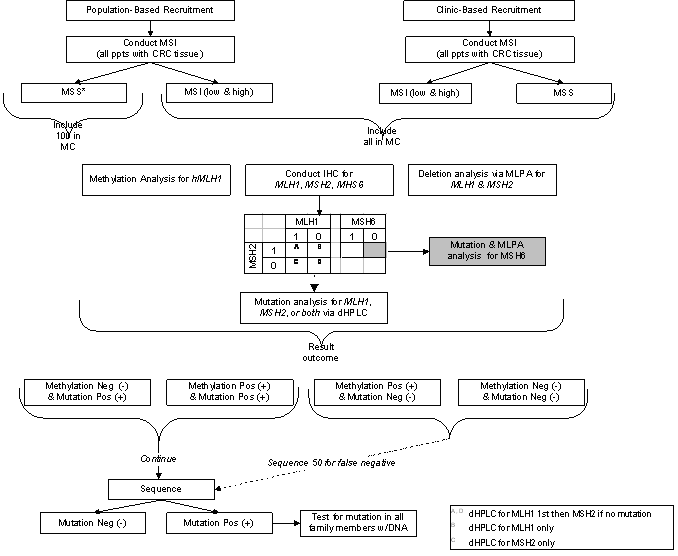
Table 6: Results of Germline Mutation Testing in DNA MMR Genes
December 2006
| |
MLH1 |
MSH2 |
MSH6 |
| # Eligible |
1,747 |
1,747 |
334 |
| # Tested |
1,747 |
1,747 |
334 |
| # Cases with deleterious mutations |
77 |
75 |
21 |
| # Polymorphisms |
2,021 |
1,569 |
727 |
| # Cases with unclassified sequence variants |
119 |
96 |
15 |
Table 7: Results of Methylation Testing of Tumor MLH1
| |
MLH1 Methylation |
| # Eligible |
2,469 |
| # Tested |
2,469 |
| # Cases with methylated MLH1 |
311 with high level methylation;
133 with low level methylation |
| |
| Population-based affected probands and clinic-based probands are
combined. |
Table 8: MLH1, MSH2, & MSH6 MLPA Testing
(Multiple Ligation Probe Assay)
December 2006
| |
MLH1 |
MSH2 |
MSH6 |
| # Eligible |
1747 |
1747 |
334 |
| # Tested |
1747 |
1747 |
332 |
| # With deleterious deletions |
7 |
39 |
2 |
| |
| Population-based affected probands and clinic-based probands are
combined. |
Table 9: Methylation Testing of Tumor MLH1
December 2006
| |
MLH1 Methylation |
| # Eligible |
2,469 |
| # Tested |
2,469 |
| # Cases with methylated MLH1 |
311 with high level methylation;
133 with low level methylation |
| |
| Population-based affected probands and clinic-based probands are
combined. |
Table 10: Phase II Recruitment and Data Collection
December 2006
| CRC-Affected Proband |
Total |
| with epidemiology data |
2,589 |
| with dietary data |
1,117 |
| with blood or buccal sample |
2,267 |
| with tumor block |
1,489 |
| with MSI results |
93 |
| with IHC results |
804 |
| Unaffected Proband |
Total |
| with epidemiology data |
83 |
| with dietary data |
53 |
| with blood or buccal sample |
117 |
| CRC-Affected Relative |
Total |
| with epidemiology data |
275 |
| with dietary data |
111 |
| with blood or buccal sample |
258 |
| with tumor block |
249 |
| with MSI results |
33 |
| with IHC results |
150 |
| Unaffected Relative |
Total |
| with epidemiology data |
4,211 |
| with dietary data |
1,838 |
| with blood or buccal sample |
3,772 |
| Population-based Control |
Total |
| with epidemiology data |
354 |
| with dietary data |
0 |
| with blood or buccal sample |
301 |
| Spouse Control |
Total |
| with epidemiology data |
68 |
| with dietary data |
65 |
| with blood or buccal sample |
70 |
Table 11: Characteristics of Colon CFR Probands from Phase II
| |
Total |
| Sex |
| Male |
1,464 |
| Female |
1,427 |
| Age at diagnosis |
| <30 years |
89 |
| 30-39 years |
420 |
| 40-49 years |
1,631 |
| 50-59 years |
278 |
| 60-69 years |
267 |
| ≥70 years |
206 |
| Primary site |
| Colon (ICD-O: 18.0, 18.2-18.7) |
1,389 |
| Rectum (ICD-O: 19.9, 20.9, 21.8) |
869 |
| Colorectal (ICD-O: 18.8, 18.9, 26.0) |
584 |
| Appendix (ICD-O: 18.1) |
27 |
| Multiple sites (synchronous primaries) |
22 |
| Proband’s FDR history of CRC |
| 0 affected FDRs |
2,360 |
| 1 affected FDR |
432 |
| ≥2 affected FDRs |
99 |
| Race |
| American Indian/Alaska Native |
34 |
| Asian |
316 |
| Native Hawaiian/Other Pac. Islander |
20 |
| Black or African American |
357 |
| White |
1,792 |
| More Than One Race |
236 |
| Unknown or Not Reported |
150 |
| |
| Represents recruitment and data collection through December 31, 2006 |
Table 12: Phase-I Tumor Phenotyping for DNA Mismatch Repair Deficiency:
Microsatellite Instability Results
| |
Total |
| Total MSI records |
3,986 |
| Tumor MSI |
|
| MSI-High |
668 |
| MSI-Low |
458 |
| MSS |
2,860 |
| |
MSI - Microsatellite Instability
MSI-High (30-100% makers unstable;
MSI-Low (1-29% markers unstable); MSI-Low (1-29% markers unstable)
MSI results shown only on those tumors with >4
markers successfully amplified.
*In addition, 30 Phase II Clinic-based
tumors have been tested for MSI. |
Table 13: Tumor Phenotyping for DNA Mismatch Repair Deficiency:
Immunohistochemistry Expression of DNA Mismatch Repair Gene Product
| |
Population-Based |
Clinic-Based |
Total |
| Phase I |
Phase II |
Phase I |
Phase II |
| Total IHC records |
3,362 |
394 |
320 |
328 |
4,404 |
| Tumor Immunohistochemistry Status |
|
|
|
|
|
| MLH1 or MLH1/PMS2 loss |
358 |
36 |
48 |
56 |
498 |
| MSH2 or MSH2/MSH6 loss |
82 |
17 |
45 |
26 |
170 |
| MSH6-only loss |
35 |
19 |
17 |
18 |
89 |
| PMS2-only loss |
34 |
24 |
8 |
18 |
84 |
| Other pattern of IHC loss |
6 |
1 |
0 |
0 |
7 |
| No loss |
2,847 |
297 |
202 |
210 |
3,556 |
Table 14: Phase II Fresh Frozen Tissue Ascertainment
| |
U of HI |
Mayo |
FHCRC |
USC |
Austr |
CCO |
Total |
| Number of consents obtained |
4 |
39 |
N/A |
58 |
N/A |
171 |
272 |
| Number of tissues obtained |
4 |
83 |
N/A |
58 |
N/A |
171 |
272 |
| Total goal for Phase II recruitment |
30 |
60 |
N/A |
120 |
N/A |
60 |
270 |
| |
| Reflects data collected through December 2006. |
|
|