National Cancer Institute
U.S. National Institutes of Health | www.cancer.gov

NCI Home
Cancer Topics
Clinical Trials
Cancer Statistics
Research & Funding
News
About NCI

Understanding Cancer Series: Genetic Variation (SNPs)
< Back to Main
    Posted: 01/28/2005    Reviewed: 09/01/2006
Page Options
Print This Page
Print This Document
View Entire Document
E-Mail This Document
View/Print PDF
View/Print PowerPoint
Quick Links
Director's Corner

Dictionary of Cancer Terms

NCI Drug Dictionary

Funding Opportunities

NCI Publications

Advisory Boards and Groups

Science Serving People

Español
Quit Smoking Today
NCI Highlights
Report to Nation Finds Declines in Cancer Incidence, Death Rates

High Dose Chemotherapy Prolongs Survival for Leukemia

Prostate Cancer Study Shows No Benefit for Selenium, Vitamin E

The Nation's Investment in Cancer Research FY 2009

Past Highlights
Slide 40  :  SNPs and Cancer Risk <  >  

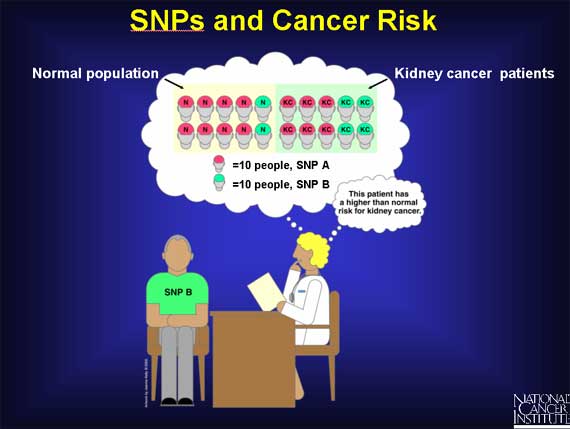
Scientists are also using SNPs to calculate risk factors associated with cancer in large populations.

First, imagine analyzing the SNPs in a random population of 100 people. 80 percent are found to have SNP A and the remaining 20 percent have SNP B. Now look at another 100 people, all with kidney cancer. In this group, 60 percent have SNP A and 40 percent have SNP B. Neither SNP A nor SNP B causes cancer. However, from this data, physicians can say that a person who has SNP B is at a higher risk for kidney cancer than a person with SNP A.

SNPs and Cancer Risk

< Previous  |  Index  |  Next Slide >


A Service of the National Cancer Institute
Department of Health and Human Services National Institutes of Health USA.gov