Contents
- Introduction
- The CEWG: Past, Present, and Future
- Research Questions
- Panel on Observations and Perspectives
- Drug Abuse Highlights for the United States
- International Highlights
Introduction
This Advance Report is a synthesis of findings presented at the 50th biannual meeting of the Community Epidemiology Work Group (CEWG) held in Rockville, Maryland, on June 12-15, 2001. Sponsored by the National Institutes of Health, National Institute on Drug Abuse (NIDA), the CEWG is a network of epidemiologists and researchers in the United States that meets biannually to review current and emerging substance abuse problems. The members present drug abuse indicator data, survey findings, and other quantitative information compiled from local, city, State, and Federal sources. To assess drug abuse patterns and trends, data from a variety of health and other drug abuse indicator sources are accessed and analyzed. Sources include public health agencies, medical and treatment facilities, medical examiners' and coroners' offices, criminal justice and correctional offices, law enforcement agencies, and sources unique to local areas. National data are used to enhance what is presented by CEWG members. Large-scale Federal and other databases used in analyses include the Treatment Episode Data Set (TEDS) maintained by the Substance Abuse and Mental Health Services Administration (SAMHSA); the Drug Abuse Warning Network (DAWN) data on emergency department (ED) drug-related mentions and medical examiner (ME) drug-related deaths (SAMHSA); the Arrestee Drug Abuse Monitoring (ADAM) program funded by the National Institute of Justice (NIJ); the Domestic Monitor Program (DMP), National Forensic Laboratory Information System (NFLIS), and other information on drug seizures, price, and purity from the Drug Enforcement Administration (DEA); the Uniform Crime Reports maintained by the Federal Bureau of Investigation (FBI); and poison control centers. These data are enhanced with qualitative information obtained from ethnographic research, focus groups, and other community-based sources.
The CEWG areas include:
| Atlanta |
Los Angeles |
Phoenix |
| Baltimore |
Miami |
St. Louis |
| Boston |
Mpls./St. Paul |
San Diego |
| Chicago |
Newark |
San Francisco |
| Denver |
New Orleans |
Seattle |
| Detroit |
New York |
Texas* |
| Honolulu |
Philadelphia |
Washington, D.C. |
* Includes Dallas and other areas in Texas |
Information reported at each CEWG meeting is distributed to drug abuse prevention and treatment agencies, public health officials, researchers, and policymakers. The information is intended to alert authorities at the local, State, regional, and national levels, and the general public to the current conditions and potential problems so that appropriate, timely action can be taken. Researchers also use this information to develop research hypotheses that might explain social, behavioral, and biological issues related to drug abuse.
In addition to ongoing assessment of drug patterns and trends in the United States, the CEWG provides a forum for the discussion of drug patterns and trends in other areas and regions of the world. This meeting included presentations on drug abuse surveillance and other research in Brazil, Canada, China, East and South Asia, Indonesia, Mexico, South Africa, and Thailand.
There were a number of special presentations. Staff of NIDA Offices and Divisions reported on the Center on AIDS and Other Medical Consequences of Drug Abuse, the Division of Treatment Research and Development's Clinical Trials Network, and the Office of Science Policy and Communications initiatives. There were reports also on NIDA-supported "HIV Risk Behaviors and Drug Injection Networks," the "Drug Evaluation Network System," and a school-based prevention trial.
Staff of other Federal agencies also presented information about their data systems. These reports included an overview of the National Drug Intelligence Center (NDIC), the Heroin Signature and Domestic Monitor Programs (DEA), the ADAM program (NIJ), and the redesign and update of DAWN (SAMHSA).
Of special interest was the panel on "Observations and Perspectives: NIDA's CEWG at 25 - Where We Have Been and Where We Should Be Going."
The CEWG: Past, Present, and Future
At this 25th anniversary of the Community Epidemiology Work Group, officials and staff of NIDA discussed the history of the CEWG, its impact on policy, planning, and research, and directions for the future. Participants were invited to discuss future directions.
Nicholas Kozel, Division of Epidemiology, Services and Prevention Research, NIDA, who has directed this project since its inception, began by providing an overview of the CEWG from its conceptualization in 1975 by the Director and staff of the White House Special Action Office for Drug Abuse Prevention within the Executive Office of the President, and its subsequent implementation by NIDA in 1976. After an initial focus on heroin in 15 CEWG areas, the membership grew to 21 areas and the focus included other illicit drugs and such consequences of abuse as HIV/AIDS. As time passed, the CEWG surveillance model was adopted by other countries and NIDA also provided technical assistance to States in implementing surveillance systems. By 1994, there was an International Epidemiology Work Group and, by 1997, an operational U.S.-Mexico Border Epidemiology Work Group. In the early 1990s, NIDA began to support qualitative research and all CEWGs collected and used such data to complement quantitative information. Over time, the CEWG has had a direct impact on initiating action to control the production and distribution of certain drugs and, thus, the consequences of their use.
Alan I. Leshner, Director of NIDA, commended the CEWG for its efforts and accomplishments. Dr. Leshner noted the unique and critical role the CEWG has played in identifying major drug events, either before they occurred or as they were about to "explode."
Despite the achievements, Dr. Leshner concluded that opportunities are being missed. NIDA needs to consider more effective ways of making use of CEWG data, including translating the findings in ways that will draw public attention, permit communities to take appropriate actions, and guide policymakers in allocating resources and implementing appropriate interventions. Many questions and issues emerge from the array of data and new findings presented by the CEWG. Insights are needed from CEWG members on how to use the CEWG data to frame research questions and expand NIDA's research agenda.
Research Questions
In response to Dr. Leshner's request for questions that might be addressed by NIDA research, the following were discussed at the meeting or derived from CEWG reports:
- What impact has the current high purity levels of heroin had on drug abuse treatment programs? Are treatment protocols being modified? Are methadone dosage levels changing?
- Private corporations are playing a greater role in providing methadone maintenance treatment services. How are these programs being regulated? What has been learned about the treatment services provided by the private corporations?
- What factors account for the dramatic rise in marijuana ED mentions and treatment admissions in most CEWG areas?
- Do marijuana treatment admissions referred by the criminal justice system differ from marijuana admissions referred by other sources?
- In both treatment and prevention interventions, what types of efforts are being focused on such drugs as MDMA, GHB, and semi-synthetic narcotic prescription drugs?
- What has been learned about the effectiveness of programs/modalities in treating primary marijuana abusers? Methamphetamine abusers? Abusers of semi-synthetic narcotic drugs other than heroin?
- What are the different patterns and combinations of drugs being used by different drug-abusing populations?
- What are the effects of different drug combinations? How can communities be alerted to the dangers associated with the use of different combinations of drugs (including alcohol)?
- What treatment protocols are most effective in treating different types of multiple drug users in hospital emergency rooms? In other treatment modalities?
- Why are increasing numbers of Hispanics appearing in the drug abuse indicators, e.g., treatment admissions, arrest data, ED mentions?
Panel on Observations and Perspectives: NIDA's CEWG at 25-Where Have We Been and Where Are We Going?
Richard Millstein, Deputy Director of NIDA, introduced the panel of experts from the drug abuse field. Mr. Millstein also thanked the CEWG members for the investments made in epidemiologic research. He pointed to the advancements made by the CEWG over the years in identifying and accessing sources of data, standardizing data collection and analysis, and improving the quality of the data reported.
Robert DuPont, M.D., former Director of NIDA and now head of the Institute for Behavior and Health in Rockville, Maryland, stressed the importance of epidemiologic data in establishing drug abuse policies and program initiatives. In the early 1970s, the White House Special Action Office for Drug Abuse Prevention and the National Institute on Drug Abuse used epidemiologic data to shape public policy and address the heroin epidemic. Dr. DuPont noted the role played by the Narcotics Treatment Administration (NTA) in the period from 1969 to 1973. NTA, located in Washington, D.C., established a drug surveillance program, a multi-modality treatment program, and a treatment research program. As a result, NTA had a major impact on national policy and the shift to a more balanced national strategy that included efforts to reduce the demand for illicit drugs.
David Musto, M.D., Yale University School of Medicine, presented a historical perspective on drug abuse epidemics in the United States. In developing strategies and programs to curtail drug abuse epidemics, he noted that we tend to have unrealistic expectations. We anticipate that change will occur quickly. Drug abuse problems can reemerge after remaining dormant for some time, as we have learned.
In 1972, the Nixon administration waged a war on drugs. It was widely believed that the heroin epidemic was largely responsible for rising crime rates. The administration provided unprecedented support for drug prevention and treatment programs, and strategies were developed to reduce the supply of drugs.
As marijuana and alcohol use peaked in the late 1970s, society became increasingly less tolerant. Harsher drug penalties were established. Attitudes about the harmful effects of alcohol and drugs changed.
Dr. Musto observed that we also fail to appreciate the results when change does occur. We can now see that change has occurred. Since 1980, alcohol consumption has decreased by 20 percent. Property crimes have been decreasing also. In some respects, the war on drugs has been won.
Richard Clayton, Ph.D., Center for Drug and Alcohol Abuse, University of Kentucky, reviewed the history of the CEWG, some of the reasons for its success, and lessons learned. Dr. Clayton pointed to essential truths that emerged out of the 50 CEWG meetings and the new challenges to be faced. He emphasized that the success is related largely to the transformation of correspondents from a variety of communities to a work group of committed individuals whose activities extend beyond just reporting results.
Another reason for the success is the continuity of leadership provided by Nick Kozel of NIDA. One of the challenges will be to synthesize the data/information reported to a variety of segmented audiences in appropriate formats so it can be digested and applied. The ultimate goal is to improve drug abuse science and practice and the connections between them.
Zili Sloboda, Sc.D., Institute for Social Policy, University of Akron, also cited the contributions made by the CEWG in identifying emerging trends, new ways that drugs are administered, and the demographics of different drug-abusing populations. The NIDA publication, Assessing Drug Abuse Within and Across Communities, has been a valuable resource for organizations like Join Together as well as local community groups.
Regarding the future direction of the CEWG, Dr. Sloboda recommended that more attention be focused on generating hypotheses and research questions from the data. For example: Why are DAWN ED marijuana mentions and primary marijuana treatment admissions increasing? What are the implications for research? In addition, Dr. Sloboda suggested that the CEWG continue to identify and access new sources of indicator data, including health-related adolescent data.
Dr. Sloboda also found that information on drug trafficking patterns and routes can be useful in assessing drug abuse patterns and trends, and the spread of drug problems from one area to another. CEWG data should be used to alert different areas of the country when new drug problems emerge and begin spreading. In addition, CEWG data/findings can be used for needs assessment at the national, State, and local levels.
Drug Abuse Highlights in the United States
Data from the 50th meeting of CEWG portrayed both the similarities and the diversity of drug abuse patterns within and across CEWG areas, as well as changes in trends over time. The findings presented are based primarily on 1999 and 2000 data, and on comparisons with data from earlier time periods. The major findings are highlighted below.
|
COCAINE/CRACK indicators remained at high levels in most CEWG areas. However, indicators declined in 10 areas, continuing the downward trend over the past few years.
|
|
HEROIN indicators continued to increase in most (n = 15) CEWG areas, and there is growing evidence that abuse of heroin is spreading to suburban and rural communities and among younger populations. Heroin purity is reaching peak levels, especially in the northeast. Prices are low and availability is high.
|
|
SEMI-SYNTHETIC PRESCRIPTION NARCOTIC DRUG indicators continued to increase in urban, suburban, and rural areas. However, the indicator numbers are relatively small, compared with other drug categories. Purchased on the street, pharmaceutical narcotics such as hydrocodone and oxycodone (including OxyContin) are being used as a substitute for heroin; these drugs also are being abused by other populations, including long-term prescription drug users, youth, and young adults. Oxycodone/OxyContin are known in areas such as Philadelphia, St. Louis, and Washington, D.C. as "the poor man's heroin."
|
|
MARIJUANA indicators began leveling off in 1999-2000 in 14 CEWG areas but continued to trend upward in 7. In some areas, substantial proportions of marijuana abusers are under age 18. Reports suggest high rates of referral to treatment by the criminal justice system.
|
|
METHAMPHETAMINE indicators varied in the CEWG areas that typically report relatively high levels of methamphetamine abuse. However, in the second half of 1999 and in the first half of 2000, DAWN methamphetamine ED mentions were trending upward in most of these areas. Levels of crystal methamphetamine remained high in Honolulu. Indicators decreased in one CEWG area (San Francisco) and were mixed in four (Los Angeles, San Diego, Phoenix, and Seattle). Methamphetamine increased in Minneapolis and St. Louis, another sign that use of this drug is spreading. The drug is reportedly popular in Atlanta.
|
|
"OTHER" DRUGS, including methylenedioxymethamphetamine (MDMA) ("ecstasy"), gamma hydroxybutyrate (GHB), ketamine, and phencyclidine (PCP), often referred to as "club drugs," are being abused by relatively small but growing numbers of people (primarily youth and young adults) in many CEWG areas. Ecstasy indicators point to increases in abuse in 13 CEWG areas. CEWG members continue to report use of ecstasy in settings other than nightclubs and raves. Reports on GHB indicators show they increased in nine CEWG areas and decreased in one. Ketamine indicators were reported in nine CEWG areas. Like ketamine, data on PCP use are limited. However, the data suggest a resurgence of PCP in some CEWG areas.
|
|
POLYDRUG use is the norm, rather than the exception among drug abusers. When asked what drugs they use, abusers in one CEWG area referred to "a trail mix - anything you can get your hands on." Many treatment admissions report current use of at least three drugs, with cocaine frequently being the most commonly reported secondary drug. Medical examiners report the presence of multiple substances in a majority of decedents. Both semi-synthetic narcotics and the so-called "club drugs" are commonly used concomitantly or sequentially with other drugs, including alcohol. In one site, heroin, crack, and marijuana are all sold in the same neighborhoods in $10 bags.
|
Cocaine/Crack
Cocaine/crack indicators decreased in 10 CEWG areas, increased in 5, and were stable or mixed in 6. However, in almost all CEWG areas - including those reporting decreases in indicators - cocaine/crack levels remained high.
The following excerpts are from CEWG reports in areas where cocaine/crack indicators have declined.
Baltimore: In the first half of 2000, declines were seen in both emergency department and treatment admissions rates for cocaine. The population in treatment for smoked cocaine (crack) continued to age; in the first half of 2000, 54 percent were older than 35.
Boston: The crack epidemic in Boston continues to decline. Indicators for cocaine use continue to decline. Crack seizures have fallen steadily in the past 5 years. Crack lab submissions to the Boston area police departments also have been declining. In the first half of 2001, only 9 percent of treatment admissions reported crack or cocaine as their drug of choice, compared with 27 percent in 1994.
Honolulu: Cocaine use indicators and law enforcement cases are down. In 2000, 550 treatment admissions were for primary cocaine abuse, a 16 percent decrease from 1999 cocaine admissions.
Miami: Cocaine/crack indicators continue to decline while still dominating in drug-related consequences. Cocaine is more frequently cited as a secondary than primary drug by people entering treatment.
Minneapolis: Cocaine/crack indicators including medical emergencies and deaths, declined somewhat in the metropolitan area but were still at high levels. In 2000, there were 60 cocaine-related deaths in Hennepin and Ramsey Counties, less than the number (n = 74) reported in the peak year (1996). Cocaine ED mentions declined in the first half of 2000. Of people admitted to addiction treatment programs in 2000, 13.5 percent identified cocaine as their primary drug of abuse.
Newark: In the first half of 2000, cocaine/crack (primary drug of abuse) represented only 9 percent (n = 218) of the treatment admissions in Newark City, compared with 27 percent in 1992. ED data for the first half of 2000 also suggest a decline in cocaine-related hospital emergencies.
New York City: In general, cocaine trends continued to show declines, but the drug still accounts for major problems in New York (e.g., deaths, ED mentions, treatment admissions, arrests).
Philadelphia: From the second half of 1999 to the first half of 2000, cocaine treatment admissions (primary drug of abuse) declined by 9 percent from 1,003 to 911. There were 1,062 such admissions in the first half of 1999. Similarly, the rate of ED cocaine mentions decreased from 130 in both the first and second halves of 1999 to 105 in the first half of 2000. There was, however, an increase in cocaine-related deaths in 2000, compared with 1999 (n = 311 versus 238).
Phoenix: Most cocaine indicators decreased. There was a substantial decline (25 percent) in cocaine-related deaths in 2000 (n = 161). Cocaine ED mentions also decreased slightly (4 percent) in the first half of 2000. Crack cocaine continued to be readily available, yet only 2 percent of Arizona's 1999 treatment admissions reported smoking cocaine.
Washington, D.C.: Cocaine indicators have been decreasing, although cocaine and crack remain widely available. Cocaine-related deaths reported by the medical examiner and cocaine-related ED mentions have declined in the most recent reporting period. Cocaine-positive urinalysis among arrestees (reported by the D.C. Pretrial Services Agency) declined substantially over the past decade, from 53 to 34 percent.
Among CEWG sites reporting increases in cocaine/crack indicators, most increases appear to be relatively modest.
Atlanta: The proportions of primary cocaine/crack abusers admitted to treatment increased slightly in the first half of 2000. ED cocaine mentions increased significantly from the first half of 1999 (n = 2,453) to the first half of 2000 (n = 2,934). Among ADAM arrestees, 79 percent of those age 31-35 and 66 percent of those 36 or older tested positive for cocaine in the first quarter of 2000.
Detroit: Cocaine deaths in Detroit/Wayne County increased by 16 percent in 2001 after a period of relative stability between 1995 and 1999; increases continued in the first quarter of 2000. Cocaine ED mentions increased 6 percent between 1999 and 2000 (projected). Cocaine (primarily smoked) accounted for 29 percent of all primary drugs among treatment admissions in Detroit/Wayne County.
Los Angeles: The rate of ED cocaine mentions per 100,000 population has been trending upward since the first half of 1997. The rate of cocaine ED mentions was 42 in the first half of 2000, compared with 28 in the first half of 1997. Approximately 24 percent of individuals entering substance abuse treatment programs in Los Angeles in the period from July 1, 1999, to June 30, 2000, reported cocaine/crack as their primary drug problem. This percentage has remained consistent over the 2 years. There has been a slight increase in powder cocaine indicators in the past year.
St. Louis: Cocaine indicators such as deaths, treatment admissions, and law enforcement data show a recent upswing. Cocaine ED mentions remained stable from the first half of 1999 (n = 1,180) and the second half of 1999 (n = 1,149) to the first half of 2000 (n = 1,134). The rate of cocaine ED mentions per 100,000 (47) for the first half of 2000 was similar to prior years-49 in the first half of 1999 and 48 in the second half of 1999.
In CEWG areas where indicators are relatively stable or "mixed," cocaine/crack, as in other CEWG sites, remains a serious drug problem.
Chicago: Cocaine use indicators have stabilized at a slightly lower level than in the mid-1990s. In the first half of fiscal year 2001, there were 13,354 cocaine-related treatment admissions in the State, but this represented a 28-percent decrease from the same period in 2000.
Denver: ED cocaine mentions, hospital discharges of cocaine patients, and ADAM positive urines for cocaine have leveled in 2000. In addition, the proportion of cocaine treatment admissions has declined considerably since 1994. In 1994, primary cocaine abuse accounted for 38.6 percent of treatment admissions, compared with only 21.5 percent in 2000. Other indicators have been climbing.
San Francisco: The cocaine scene continues to ebb in the view of local ethnographic researchers. Prevalence declined sharply in the mid-1990s and has remained at a low level since 1997. In FY 2000, cocaine (primary drug) treatment admissions in San Francisco totaled 7,647, 12 percent below the number admitted in 1999.
Texas: Cocaine indicators were relatively stable in Texas but differed by area. Cocaine abuse emerged as a significant problem in the border area. Although the rate of cocaine ED mentions per 100,000 population was lower in the first half of 2000 than the peak in 1998, it was still higher than in earlier years. Cocaine/crack comprised 31 percent of all adult admissions to TCADA-funded programs in 2000. Crack admissions in Texas have decreased from 28 percent of all adult admissions in 1993 to 23 percent in 2000. There continued to be a decrease in African-American crack admissions.
Nationally, DAWN ED cocaine mentions decreased significantly in the first half of 2000, after reaching the highest number in 2 1/2 years in the second half of 1999.
| Estimated Cocaine ED Mentions and Rates for the Total Coterminous United States: DAWN, 1H97-1H00 |
| |
1H98 |
2H98 |
1H99 |
2H99 |
1H00 |
| Mentions |
85,760 |
86,253 |
79,582 |
89,182 |
81,361 |
| Rates* |
36 |
36 |
33 |
37 |
33 |
SOURCE: Office of Applied Studies, SAMHSA
* Per 100,000 population.
|
As shown in the chart on page 10, cocaine ED rates have been trending downward in four CEWG areas, reaching the lowest level in 4 1/2 years in the first half of 2000. In another four CEWG areas, cocaine ED rates are trending upward.
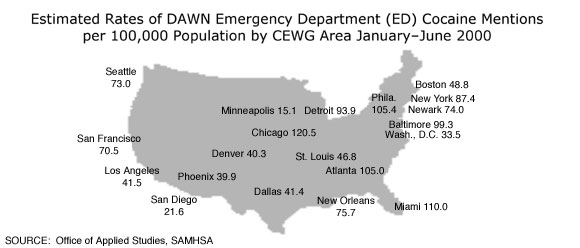
The estimated rates of DAWN ED cocaine mentions in 2000 are shown by CEWG area in the map on page 11.
In 1999, 15,748 adult male arrestees were tested in 16 CEWG sites in the ADAM program. The percentages testing positive for cocaine trended downward in seven sites: Chicago, Los Angeles, New Orleans, New York, Houston, San Diego, and Seattle. The three areas with the largest percentage decreases from 1997-99 are shown in the following chart.
| Selected Trends in Cocaine ED Mentions in Eight CEWG Areas: DAWN Rates,* 1H96-1H00 |
| |
1H96 |
2H96 |
1H97 |
2H97 |
1H98 |
2H98 |
1H99 |
2H99 |
1H00 |
| Decreases |
| Newark |
135 |
117 |
92 |
109 |
106 |
102 |
86 |
86 |
74 |
| New Orleans |
92 |
110 |
99 |
100 |
109 |
91 |
89 |
86 |
73 |
| New York |
136 |
128 |
124 |
120 |
120 |
114 |
88 |
87 |
73 |
| Wash., D.C. |
52 |
51 |
42 |
43 |
50 |
48 |
38 |
43 |
34 |
| Increases |
| Los Angeles |
33 |
36 |
28 |
29 |
31 |
37 |
37 |
42 |
42 |
| Miami |
81 |
87 |
88 |
86 |
94 |
94 |
99 |
112 |
110 |
| San Francisco |
74 |
74 |
63 |
63 |
57 |
58 |
48 |
72 |
71 |
| St. Louis |
38 |
42 |
30 |
33 |
43 |
44 |
49 |
48 |
47 |
* Per 100,000 Population
SOURCE: Office of Applied Studies, SAMHSA |
| CEWG Areas with the Largest Decreases in Percentages of Adult Males Testing* Cocaine-Positive: ADAM
|
| CEWG Area |
Percent Testing Positive |
| 1997 |
1998 |
1999 |
| New York |
57.6 |
47.1 |
44.2 |
| Chicago |
49.0 |
44.9 |
41.7 |
| San Diego |
21.4 |
19.1 |
16.5 |
SOURCE: National Institute of Justice
* Based on the Enzyme Multiplied Immunoassay Technology (EMIT). |
In four CEWG areas, the percentages of adult male arrestees testing cocaine-positive increased (Dallas, Minneapolis, Philadelphia, and Washington, D.C.), while remaining stable in the other five areas (Atlanta, Denver, Detroit, Miami, and Phoenix).
In 13 CEWG sites in 1999, the relatively small number of adult females (n = 5,150) testing cocaine-positive showed a different trend from that of their male counterparts. The percentages of females testing cocaine-positive increased in six sites (Chicago, Dallas, Minneapolis, New Orleans, Phoenix, and Seattle).
In 13 ADAM/CEWG sites where both adult males and females were tested in 1999, the percentages of females testing cocaine-positive exceeded those for males in all sites except New Orleans (2.4-percentage-point difference). In four sites, there was only a small percentage-point (1-6.5) difference between females and males (Los Angeles, Dallas, San Diego, and Minneapolis). The three sites with the largest percentage differences between females and males were Chicago (64.3 versus 41.7 percent), New York (65.1 versus 44.2 percent), and Philadelphia (59.8 versus 39.3 percent). In the other five sites, cocaine-positive females exceeded males by 10.4 to 18.9 percentage points (Denver, Atlanta, Phoenix, Seattle, and Detroit).
Heroin
Heroin indicators increased in 15 of the 21 CEWG areas, and remained stable or mixed in 5 others. Indicators decreased in Seattle, where heroin continues to have the greatest impact of all illicit drugs.
In nine CEWG areas, it was reported that heroin abuse continued to spread to younger populations and to suburban and rural areas. The purity of heroin has been increasing nationally and has reached very high levels in many CEWG areas. Because of the high purity, intranasal use is a common way to begin using heroin. The price of heroin is relatively low and the drug is more widely available.
Atlanta: As the crack market became saturated, heroin has become cheaper, purer, and more available.
Baltimore: Heroin abusers come into the city for treatment. Suburban areas are reluctant to open treatment facilities.
Boston: Heroin indicators are rising and heroin is surpassing cocaine as the street drug of choice. Primary heroin admissions now constitute the largest percentage (40 percent) of illicit drug admissions in Greater Boston's publicly-funded treatment programs. Treatment providers report seeing younger heroin users - many from stable backgrounds - who began intranasal heroin use recreationally, unaware of its high potential for addiction.
Chicago: There has been an upward trend in heroin indicators since 1992. The prevalence of heroin abuse in Chicago remains among the highest in the Nation, with increases in most indicators. A recent study shows that 38 percent of 700 injection drug users, age 18-30, reported a suburban residence and heroin was the drug of choice among most of these abusers. Injection use is higher in the suburbs for several reasons: lower cost, the stigmatization of injection in the inner city, and the prohibition of injection by gangs.
Denver: Heroin ED mentions and hospital discharges have been climbing throughout the 1990s and into 2000. Demographics for primary heroin treatment admissions have changed, with more white and younger users.
Detroit: Heroin deaths in Detroit/Wayne County increased by 23 percent in 2000 over 1999, and this increase continued in the first quarter of 2001. Almost 6 of every 10 heroin admissions reported statewide in the first half of FY 2001 were in Detroit/Wayne County, and admissions appear to be increasing outside the Detroit metropolitan area. Heroin is cheaper than it has ever been, and purity remains as high as 50 percent or more.
Miami: Indicators of heroin consequences continue their decade-long increase, reaching record levels in Miami-Dade County. An epidemic is emerging in South Florida. Heroin is at its highest purity level (23 percent) and its lowest price ($1.03 per milligram).
Minneapolis: Opiate-related mortality increased significantly in recent years. In 2000, heroin quality and supply remained high and prices low.
Newark: With its expansion to suburban and rural areas, there has been an unprecedented rise in heroin abuse. Heroin purity is at its highest level. In Newark and the State, the percentage of heroin injectors increased more sharply among 26 to 34-year-old treatment admissions than among heroin admissions in other age groups.
New Orleans: By 2000, heroin remained a drug of choice in the New Orleans area. Most indicators increased, with the exception of treatment admissions. Both law enforcement personnel and addiction counselors assert that heroin is the drug of choice for an increasing number of young people in the inner city.
Phoenix: The Maricopa County ME reported 137 morphine-related deaths in 2000, 29 percent more than in 1999. In the first half of 2000, heroin ED mentions increased 45 percent to 428. A continuing high percentage of clients (66 percent) sought heroin/morphine detoxification in the second quarter of FY 2001.
San Francisco: Heroin indicators suggest a rebound occurred at the end of the 1990s, possibly as a result of the unprecedented cheapness of the drug.
St. Louis: Heroin is increasingly prominent in most St. Louis indicators. Heroin is more widely available and of higher purity than in the past.
Texas: Most heroin indicators increased. Texas Poison Control Centers confirmed 271 exposure calls involving heroin in 2000. Emergency room mentions of heroin are rising also.
Washington, D.C.: Data compiled from the Washington/Baltimore High Intensity Drug Trafficking Area (HIDTA) system and ethnographic sources show that heroin use is up and the drug is readily available throughout the city. Indicator data continue to reflect an alarming development - the increased abuse of heroin by suburban youth. Young drug abusers are increasingly combining heroin with alcohol and other substances.
Nationally, when compared over a 6-year period, heroin/morphine ED mentions peaked in the first half of 2000 at 19.2 per 100,000 population. In the first half of 2000, heroin/morphine ED mentions also peaked for the 18-25-year-old age category (29 per 100,000) and for whites (19,455 mentions).
Comparison of the first half of 2000 with the first half of 1999 shows that heroin/morphine ED mentions increased overall by 12.4 percent across the 20 CEWG areas included in DAWN. The increases from the first half of 1999 to the first half of 2000 were statistically significant in seven CEWG areas: Atlanta, Boston, Detroit, Miami, New Orleans, San Diego, and San Francisco.
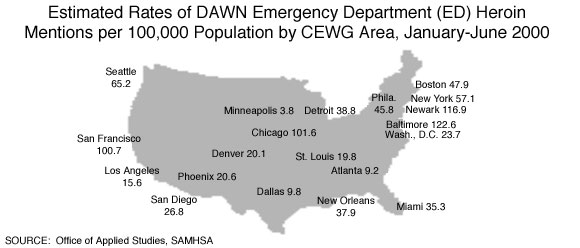
Estimated rates of DAWN ED heroin/morphine mentions per 100,000 population in the first half of 2000 were highest in Baltimore, Newark, Chicago, and San Francisco, as shown in the map on page 15.
Heroin/opiates continue to be implicated in many drug-related deaths and typically account for a sizable proportion of drug-related deaths nationally and across CEWG areas. In Boston, heroin mentions in drug-related deaths remained unchanged at 56 percent. In nine CEWG areas, heroin-related mentions decreased (Atlanta, Los Angeles, Miami, New York, St. Louis, San Francisco, Seattle, Washington, D.C., and Texas overall). In eight CEWG areas, deaths related to heroin/opiate abuse increased. The increases were substantial in Denver (38 percent), Detroit (23 percent), Minneapolis (52 percent), Newark (35 percent), New Orleans (34 percent), Philadelphia (41 percent), and Phoenix (29 percent). Heroin-related deaths remained stable in Honolulu and San Diego. Data were not reported for Baltimore or Chicago.
The 1999 ADAM data show that sizable percentages of adult arrestees tested positive for opiates, i.e., heroin, morphine, codeine, and/or a semi-synthetic narcotic. From 1998 to 1999, opiate-positive rates for adult male arrestees remained relatively stable in 9 of the 16 CEWG areas where adult males were tested; the percentages increased in 4 and decreased in 3 areas. Comparable data from the 13 CEWG areas where adult female arrestees were tested show a different pattern. The percentages of opiate-positives among women increased in eight CEWG areas, remained stable in three, and decreased in two. The largest increase was in Dallas (from 2.3 to 6.7 percent).
The data by gender for 1999 appear below:
| Percentage of Male and Female Adult Arrestees Testing Opiate-Positive: ADAM 1999 |
| Area |
Females |
Males |
| Chicago |
32.4 |
20.1 |
| New York |
21.1 |
15.2 |
| Seattle |
20.3 |
13.9 |
| Detroit |
16.4 |
8.6 |
| Philadelphia |
14.2 |
14.8 |
| Phoenix |
11.6 |
7.6 |
| New Orleans |
7.0 |
13.5 |
| Washington, D.C. |
* |
16.0 |
SOURCE: National Institute of Justice
* Females were not tested. |
The DEA describes the high purity and low price of heroin in recent years as "unprecedented." In the first 3 months of 2000, the purity of heroin varied considerably across CEWG areas. The CEWG areas with the highest heroin purity levels are shown in the following chart.
| Highest Percent of Heroin Purity by CEWG Area |
| Area |
Percent |
| Newark |
76.7 |
| Philadelphia |
72.8 |
| Honolulu |
67.0 |
| Boston |
65.6 |
| New York |
60.2 |
| Detroit |
52.2 |
| San Diego |
52.1 |
| Phoenix |
46.7 |
| Atlanta |
40.9 |
| SOURCE: Drug Enforcement Administration |
Purity levels in other CEWG areas ranged from a low of 16.4 percent in Dallas to 27.8 percent in Denver. Among cities in this range were Baltimore (18.4 percent), Chicago (22.6 percent), and San Francisco (24.6 percent), all areas with high levels of DAWN ED heroin/morphine mentions. The disparity between purity levels and ED mentions in these three CEWG areas is puzzling and warrants further examination by the CEWG representatives in those areas.
Based on DEA's Domestic Monitor Program data for 1999, the purity of South American (Colombian) heroin tended to be highest in the northeast and mid-Atlantic regions (ranging from 58-75 percent in most areas). The purity of Mexican heroin tended to be the highest near the U.S.-Mexico border (around 57 percent).
Recent price data from CEWG representatives indicate the most typical cost of heroin is between $10 and $20 per bag, although the price per bag in Boston may be only $4. The cost of a gram of heroin ranges from $100 to $350. The price, of course, varies by type of heroin, e.g., South American white is the most expensive and Mexican brown heroin the least expensive.
Narcotic Drugs Other than Heroin
CEWG areas continue to report increases in indicators of abuse of prescription semi-synthetic narcotic drugs, although the number of cases remains relatively low. The indicator data show that drugs such as hydrocodone (e.g., Lorcet, Lortab, Vicodin), hydromorphone (e.g., Dilaudid), and oxycodone (e.g., Percodan, Percocet, OxyContin) are being abused by greater numbers of individuals. Recently, OxyContin (a painkiller used for mild to moderate pain control, chronic pain, and the treatment of pain related to cancer and other debilitating conditions) has received considerable media attention, especially in its more potent time-release form. Drug abusers can "short-circuit" the time-release by chewing, crushing, or dissolving the pill; it can be injected, inhaled, or taken orally, and is often mixed with other pills or marijuana or alcohol.
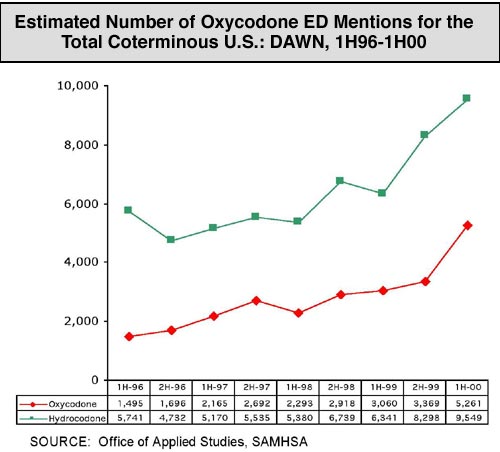
The graph on page 18 illustrates the increase in oxycodone and hydrocodone DAWN ED mentions nationally from the second half of 1996 to the first half of 2000.
Increases in oxycodone DAWN ED mentions from the second half of 1998 to the first half of 2000 are shown below for selected CEWG areas. Mentions were highest in Boston, Philadelphia, and Phoenix.
| Estimated Number of Oxycodone ED Mentions in Selected CEWG Areas: DAWN, 2H98-1H00 |
| City |
2H98 |
1H99 |
2H99 |
1H00 |
| Atlanta |
36 |
37 |
26 |
52 |
| Baltimore |
48 |
52 |
49 |
61 |
| Boston |
126 |
130 |
163 |
255 |
| Miami |
11 |
23 |
18 |
36 |
| Philadelphia |
182 |
174 |
209 |
230 |
| Phoenix |
56 |
80 |
92 |
103 |
| St. Louis |
26 |
13 |
29 |
37 |
| Seattle |
34 |
23 |
51 |
73 |
| SOURCE: Office of Applied Studies, SAMHSA |
Comparable data for hydrocodone appear in the following chart. Mentions were highest in Los Angeles, Detroit, San Diego, and Phoenix.
| Estimated Number of Hydrocodone ED Mentions in Selected CEWG Areas: DAWN, 2H98-1H00 |
| City |
2H98 |
1H99 |
2H99 |
1H00 |
| Boston |
50 |
59 |
46 |
92 |
| Denver |
39 |
49 |
56 |
67 |
| Detroit |
110 |
107 |
130 |
193 |
| Los Angeles |
159 |
157 |
199 |
199 |
| Phoenix |
85 |
93 |
98 |
109 |
| St. Louis |
52 |
48 |
40 |
78 |
| San Diego |
97 |
135 |
95 |
121 |
| San Francisco |
54 |
49 |
64 |
80 |
| SOURCE: Office of Applied Studies, SAMHSA |
Among the 129,423 individual drug items analyzed by the NFLIS from July 1 to September 30, 2000, hydrocodone (n = 688) and oxycodone (n = 568) ranked in the top 10 of the most frequently identified drugs. As the number of forensic labs expands, the DEA-supported NFLIS should generate statistically representative national and regional estimates.
Reports from CEWG representatives confirm the growing problems associated with abuse of semi-synthetic narcotics, especially hydrocodone and oxycodone.
 |
Atlanta: Reports of high-dose OxyContin as well as other opiate drugs are prevalent in the city and surrounding suburban areas.
Boston: Among diverted prescription medications, oxycodone (Percocet and more recently OxyContin) and clonazepam (Klonopin) are most frequently mentioned. The DPH drug lab reported a doubling of oxycodone samples statewide from 178 in 1999 to 374 in 2000, with 145 oxycodone samples confirmed for Greater Boston alone. State Police reported well-organized Percocet trafficking from New York, with distribution points in several Massachusetts cities. The State Police drug lab, the Boston police, treatment providers, and outreach workers report increased seizures and mentions of OxyContin.
Chicago: There was a 7.3 percent increase in codeine ED mentions in Chicago between the first half of 1999 and the first half of 2000.
Detroit: Codeine remains the most common opiate other than heroin, although there are growing indications that OxyContin abuse is increasing.
Miami: Oxycodone abuse indicators appear to be increasing sharply based on death data, emergency department data, and information obtained from addict informants. In Miami/Dade County, oxycodone and hydrocodone were implicated in 54 deaths and were the cause of 6. The figures were higher in Broward County. For the State overall, oxycodone and hydrocodone were present in 658 decedents and were the cause of death in 152 cases.
Minneapolis: OxyContin is becoming a more prevalent drug of abuse in non-metro, rural parts of Minnesota. Users are typically experienced heroin addicts who return to their hometown areas to obtain prescriptions from unsuspecting rural doctors.
New York: Prescription drugs, including medication for HIV disease, continue to be diverted. The State's Street Studies Unit reports that a variety of psychoactive prescription drugs are increasing in availability on the street, including Xanax ('footballs'), Klonopin, Vicodin, and Valium.
Philadelphia: Spring 2001 focus group participants reported that the use of oxycodone/OxyContin products and alprazolam (Xanax) is increasing.
Phoenix: The DEA reported that the most commonly abused pharmaceutical-controlled substances in the Phoenix area include hydrocodone products (Vicodin, Lortab), Percocet, OxyContin and other oxycodone products, benzodiazepines, and codeine products. Deaths involving propoxyphene and hydrocodone continued to increase from 59 in 1999 to 69 in 2000 (21 percent).
St. Louis: The use of hydromorphone (Dilaudid) remains common among a small, chronic population of white addicts. Abuse of oxycodone (Percocet and Percodan) is growing in popularity. The DEA reports that injection of a liquid form of oxycodone has been seen in the St. Louis area. Oxycodone is often referred to as 'the poor man's heroin.'
Seattle: Informants reported a significant increase in the street sale of OxyContin and other synthetic narcotics when heroin is not available. The number of drug-related deaths involving opiates other than heroin escalated from 34 in 1999 to 49 in 2000. The King County medical examiner reported 18 deaths involving oxycodone in 1999 and 13 in 2000.
Texas: According to DEA reports, hydrocodone products (generic hydrocodone, Lorcet, Lortab, Vicodin, and Norco or hydrocodone/APAP) are the most commonly diverted controlled narcotic substances within the Dallas area. The Poison Control Centers reported 64 confirmed exposures to drugs using the terms OxyContin or oxycodone. DPS labs examined 496 hydrocodone items in 2000, similar to the number in 1999 (n = 479). The number varied by geographic region. In Texas, abuse of codeine cough syrup continues to spread.
Washington, D.C.: Pharmaceutical narcotics such as hydromorphone (Dilaudid) continue to be substituted for heroin. Dilaudid, Percocet, Percodan, and codeine (Tylenol 3's and 4's) can be purchased near methadone clinics throughout the city. Addicts use these and other narcotic pills to ease withdrawal and heighten the effects of heroin. OxyContin, known as 'poor man's heroin,' has spread to D.C. and surrounding suburbs in recent months. On the street, OxyContin sells for 10 times its pharmaceutical price. The number of ED mentions for oxycodone increased from 50 in the first half of 1999 to 62 in the first half of 2000.
Marijuana
After increasing dramatically in all CEWG areas between 1990 and 1998, marijuana indicators began leveling off or stabilizing in 1999 and 2000 in 14 CEWG areas. However, marijuana indicators continued to increase in the following seven CEWG areas.
Chicago: The increase in marijuana use during the 1990s has continued into the first half of 2000. Among drug treatment entrants other than those admitted for alcohol-only, marijuana users were 26 percent of the total, with 10,301 admissions in the first half of FY 2001.
Denver: Most marijuana indicators are increasing. The most recent State household telephone survey data show that marijuana is the most used and abused drug of Colorado residents age 18-59; 5 percent of respondents reported marijuana use in the last 30 days, and 1 percent reported current abuse or dependence on the drug. Findings from the 1999 National Household Survey on Drug Abuse (NHSDA) on persons age 12 and over placed Colorado first among the 50 States in past-month marijuana use (at 8.1 percent).
Minneapolis: One out of five people entering addiction treatment programs reported marijuana as the primary substance problem and, of those, nearly half (48 percent) were under age 18. Multiple national and State student surveys note a marked increase in youth marijuana use since 1992. The consequences of this abuse are reflected locally by increases in young people entering addiction treatment programs. Hospital emergencies involving marijuana increased throughout the decade.
New Orleans: Marijuana indicators continue to increase.
New York: Marijuana activity in New York City continues to show steady and dramatic increases.
Phoenix: Marijuana ED mentions increased significantly between the first half of 1995 (279) and the first half of 2000 (441), representing a 58 percent increase. Marijuana is reported to be widely available throughout Arizona. Tucson remains a major transshipment point for marijuana destined across the United States. During the second quarter of FY 2001, the DEA seized 36 metric tons of marijuana.
St. Louis: Inner-city marijuana indicators are increasing: 1999 data show that ED mentions continued to rise, from 1,109 in 1997 to 1,640 in 1999. Treatment admissions more than doubled from 1997 (1,573 admissions) to 2000 (3,231 admissions). The under 26 age group accounted for more than 60 percent of primary marijuana treatment admissions in 2000.
In Texas, an increasing number of marijuana abusers are entering treatment. Most are referred to treatment by the criminal justice system. In Baltimore, more than half of the city's marijuana admissions are referred by the criminal justice system. Baltimore opened a drug court in 1994 that accounts, in part, for the high number of referrals.
Nationally, DAWN ED marijuana/hashish mentions continue to trend upward. For example, in the last half of 1995 there were 20,999 such mentions; in the first half of 2000, there were 47,535 mentions - a 126 percent increase. Marijuana ED mentions continued to trend upward in the five CEWG areas shown in the following chart.
| Estimated Marijuana ED Mentions in CEWG Areas:
DAWN, 1H98 -1H00 |
| Area |
1H98 |
2H98 |
1H99 |
2H99 |
1H00 |
| Denver |
293 |
287 |
292 |
389 |
389 |
| Miami |
564 |
555 |
576 |
709 |
859 |
| Minneapolis |
241 |
250 |
304 |
318 |
380 |
| San Francisco |
206 |
188 |
164 |
306 |
363 |
| St. Louis |
304 |
341 |
414 |
462 |
472 |
| SOURCE: Office of Applied Studies, SAMHSA |
In the first half of 2000, the CEWG areas with the highest rates of ED marijuana/hashish mentions per 100,000 population were: Detroit (50), Atlanta (49), Philadelphia (49), Miami-Hialeah (45), and Chicago (42).
Treatment data show great variability across CEWG areas in the percentages of admissions for primary abuse of marijuana. Colorado, by far, had the highest proportion (42 percent) of primary marijuana admissions, a pattern that has characterized the caseloads since 1995. Relatively high percentages of primary marijuana admissions also were reported in Chicago (26 percent), Minneapolis (22.6 percent), and Atlanta (18 percent). Marijuana represented relatively small proportions of primary admissions in Philadelphia (14 percent), Los Angeles (9 percent), Washington, D.C. (6 percent), Newark (6 percent), and Boston (4 percent).
Among adult arrestees in the ADAM program in 1999, males were more likely than females to test positive for marijuana. Marijuana was the drug most frequently detected in males in 9 of the 16 CEWG sites reporting to ADAM, with marijuana-positive percentages ranging from 32.3 percent (Los Angeles) to 47.9 percent (Detroit). Among adult females, the percentages testing marijuana-positive ranged from 21 percent (Los Angeles) to 34.1 percent (Denver).
Among juvenile arrestees in ADAM sites in 1999, marijuana was the most commonly used drug by both males and females. In the CEWG/ADAM, more than half of the juvenile males and almost 40 percent of the juvenile females tested positive for marijuana.
The type, quality, and cost of marijuana varies greatly, and the drug is used in a variety of ways. "Blunts," marijuana in cigar wrappers, is one popular form. In blunts, the marijuana may be mixed with other substances such as phencyclidine (PCP), known as "wet" or "loveboat," and with crack, known as "turbo." Marijuana cigarettes may be mixed with other substances also. Some abusers dip the cigarette in formaldehyde or embalming fluid.
CEWG representatives report various costs for marijuana. In Chicago, a bag sells for $5 to $20, while in Newark and Washington, D.C., a bag sells for $5 to $10. In New York City, bags of marijuana are priced between $10 and $50, with hydroponically-grown joints selling for $10 each and blunts selling for $15 each. In Newark, a joint sells for $2 to $5, while the cost of a joint in Honolulu ranges from $5 to $20. In Honolulu, an ounce of low quality marijuana sells for between $300-$500. Locally grown marijuana in Seattle costs between $325 and $400. In Atlanta, an ounce of marijuana sells for $120-$240. In Washington, D.C. an ounce of commercial grade marijuana sells for $75-$120.
Methamphetamine
Indicators of methamphetamine abuse varied in the CEWG areas that have reported relatively high levels of methamphetamine abuse in the past. Indicators remained high in Honolulu (for crystal methamphetamine), but decreased in San Francisco. Indicators were mixed in Los Angeles, San Diego, Phoenix, and Seattle. Two areas reporting substantial increases in methamphetamine indicators were Minneapolis and St. Louis. The drug is reportedly popular in Atlanta. In other CEWG areas, methamphetamine indicators were low or negligible.
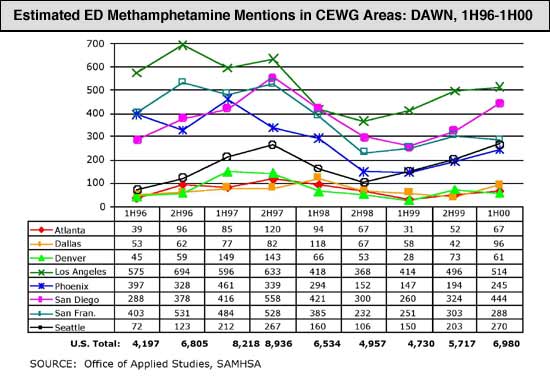
Nationally, the DAWN ED methamphetamine mentions fluctuated from 1997 through the first half of 2000, a trend reflected in the CEWG areas shown in the chart on page 23. A decrease occurred in 1998 after national and local efforts were taken to control the production, use, and distribution of methamphetamine. In the second half of 1999 and the first half of 2000, methamphetamine ED mentions were trending upward again. Nationally, methamphetamine ED mentions increased nearly 22 percent between the second half of 1999 and the first half of 2000; yet, total mentions for all drugs increased only 6 percent during the same time period.
Excerpts from selected CEWG reports illustrate the variability in methamphetamine indicators across sites.
Denver: Denver's methamphetamine indicators, which had been increasing from 1993 to 1997, mostly declined in 1998-99, but seem to have stabilized in 2000. Non-medical stimulant use rates in Colorado reported in the 1995 State household telephone survey were greater than those reported in the 1995 NHSDA. Indicator data show substantial fluctuations in methamphetamine and other stimulant use in Denver and across Colorado from 1994 to 2000.
Honolulu: Methamphetamine treatment demand has never been higher and the number of law enforcement cases is up. On the basis of several indicators, Hawaii remains the crystal methamphetamine capital of the U.S. It remains 'the' drug of choice in the island chain.
Los Angeles: Methamphetamine emergency department mentions showed a modest decline between 1997 and 1999, while other indicators remained stable.
Minneapolis: The methamphetamine-related deaths, treatment admissions, and seizures continued to climb.
Phoenix: Methamphetamine ED mentions reflected a gradual upward shift again, showing a 67 percent increase. However, a comparison of January-June 1995 and January-June 2000 mentions reveals an 85 percent decrease. Methamphetamine-related deaths continued to increase. The TASC Adult Deferred Prosecution Program data reveal that 28 percent of the March 1989 to December 2000 treatment admissions were for methamphetamine abuse. ADAM findings for 2000 revealed that 19 percent of both male and female arrestees tested positive for methamphetamine.
San Francisco: Methamphetamine indicators are turning downward from their recent peaks. The preferred route of use for many years has been injection (61 percent) among ED speed cases for which route of administration was known in 1998. Admissions for primary amphetamine problems in the five-county bay area increased by 100 percent between 1994 and 1999, then declined slightly in 2000.
San Diego: Methamphetamine indicators are mixed, but some show increases from 1999-2000. Methamphetamine overdoses increased 65 percent. ED mentions increased 2 percent from 1998-99, and first-half-2000 data suggest they may increase again. Methamphetamine continued to account for more than one-third of all treatment admissions. Adult females in the ADAM program were more likely than their male counterparts to test methamphetamine-positive.
St. Louis: Methamphetamine is increasingly prominent in most St. Louis indicators. In rural areas, methamphetamine recently appeared in treatment data. ED mentions increased significantly from 44 in 1H99 to 99 in 1H00-a 125 percent increase.
Seattle: Methamphetamine use appears stable at a level well below heroin and cocaine use in Seattle-King County, but is on an upward trend in other areas of the State. In keeping with the broader upward trend, indicators of methamphetamine-related activity within the criminal justice system also continue to rise at significant rates.
Texas: Methamphetamine use is widely reported, but reports of adverse effects remain low.
Production of methamphetamine reportedly increased or remained a problem in areas outside metropolitan CEWG sites, as did trafficking in some areas.
Atlanta: According to the DEA, production of methamphetamine has continued throughout all rural areas of Georgia. In the Atlanta metropolitan area, a few small labs have been found on the periphery. Use in Atlanta usually flows from Mexican nationals who pass it along to white dealers. Purity varies greatly across the Atlanta metro area and the State.
Denver: In 2000, methamphetamine seizures in metropolitan areas nearly doubled from 1999 to 212 pounds.
Detroit: Methamphetamine lab seizures continue to increase. Michigan State Police reported 32 lab seizures through mid-May 2001, compared with 40 in 2000, most in smaller counties outside the metropolitan area.
Honolulu: Over the past 6 months, there was a major seizure of crystal methamphetamine and an associated trafficking ring on the Big Island. Analysis of confiscated methamphe-tamine reveals that it is still high-quality d-methamphetamine hydrochloride in the 90-100 percent purity range.
Los Angeles: Methamphetamine production and trafficking continue to expand.
Minneapolis: Clandestine [methamphetamine] labs and seizures continued to climb.
St. Louis: Methamphetamine labs in rural areas continue to be a major problem.
The price and purity of methamphetamine appears to vary greatly within and across sites, according to reports from eight CEWG areas. For example, the street price of a gram of methamphetamine in Boston ranges between $70 and $200. The cost in Washington, D.C. is $100-$150 per gram. Prices per gram are lower in St. Louis ($37-$100), Seattle ($20-$60), and North Texas ($70-$100). In Honolulu, the street price of the less processed form of crystal methamphetamine is $150 to $300 per gram, although the price varies across the islands. In Los Angeles, the price per pound ranges from $45,000 to $100,000 for 15-20 percent purity. Pound quantities prices are lower in Boston ($8,000-$24,000), in Washington, D.C. ($23,000-$30,000), and in several parts of Texas, e.g., $8,500 for low grade methamphetamine in south Texas.
Other Drugs
MDMA (Ecstasy)
Having both stimulant and low-level hallucinogenic properties, ecstasy is a growing problem in most CEWG areas, although the number of cases is relatively small. Indicator data point to increases in abuse of this drug in 13 CEWG areas and easy availability in most other areas. CEWG members continue to report use of ecstasy in settings other than nightclubs and raves.
According to a recent DEA report, 80 percent of the MDMA consumed worldwide is produced in the Netherlands and Belgium. Europe experienced a growing recreational use of the drug in the 1980s and it spread to the United States. DEA classified MDMA as a Schedule I drug in 1995.
Federal agencies such as DEA and the U.S. Customs Service (USCS) report high levels of ecstasy seizures. USCS seizures increased from 750,000 in FY 98 to approximately 9.3 million in FY 00. DEA seized approximately 1 million tablets in 2000.
Nationally, the number of MDMA mentions in the DAWN ED system increased significantly from 1994 (n = 250) to 1999 (n = 2,850), nearly doubling in each of the 6 years. This pattern of increase characterized most CEWG areas. In the first half of 2000, the estimated number of MDMA ED mentions ranged from a low of 12 (Minneapolis) to a high of 100 (New York). The chart that follows shows the trends from the second half of 1998 to the first half of 2000 for the six CEWG areas with the highest numbers of mentions in 2000.
| Estimated Number of MDMA ED Mentions by CEWG Area: DAWN, 2H98-1H00 DAWN |
| City |
2H98 |
1H99 |
2H99 |
1H00 |
| Chicago |
16 |
45 |
58 |
73 |
| Los Angeles |
22 |
30 |
23 |
88 |
| New York |
18 |
67 |
68 |
100 |
| Philadelphia |
17 |
29 |
60 |
61 |
| San Francisco |
17 |
22 |
25 |
54 |
| Seattle |
10 |
10 |
22 |
51 |
| SOURCE: Office of Applied Studies, SAMHSA |
While two CEWG areas (Honolulu and Newark) report limited use of ecstasy, indicators in other sites portray a growing problem.
Atlanta: In 1999, the estimated rate of MDMA ED mentions in Atlanta was 2.2 per 100,000 population, according to a DAWN report on club drugs. This is nearly twice the U.S. total for that year (1.2 per 100,000), and the fourth highest among all reporting areas. MDMA remains popular in different settings. According to the Georgia Poison Control Center, MDMA calls are common in the metro area.
Boston: Although MDMA, known popularly as ecstasy or 'E,' has not appeared in treatment, ED, or arrest indicators, other sources indicate that ecstasy availability and use may still be increasing. The State Police lab reported that MDMA seizures continue to climb and DPH drug lab samples of MDMA both statewide and in Boston have risen sharply from 1998 to 2000.
Chicago: Ecstasy (MDMA) continues to be the most prominently identified stimulant used in the Chicago area. Ecstasy ED mentions increased over 1,000 percent between 1995 and 1999 and this upward trend has continued during the first half of 2000. Compared with the same time period in 1999, ecstasy ED mentions increased 62 percent.
Denver: The handful of MDMA-related calls to the Rocky Mountain Poison Drug Center ranged from only 3 to 11 during the 1994 to 1999 time period. ED mentions, however, jumped from 6 in 1998 to 15 in 1999 to 23 in the first half of 2000. DEA and police sources report increasing availability of MDMA.
Detroit: MDMA indicators are mixed. Deaths are low. However, MDMA use continues to diffuse outside the rave scene; several recent poison control cases involved multiple drug use including MDMA. Children's Hospital of Michigan Poison Control reported 43 MDMA-related cases in southeast Michigan through the first 4 months of 2001, compared with 66 cases in all of 2000.
Los Angeles: The number of ED mentions (of MDMA) has significantly increased since 1997, with the highest number of mentions ever in the first half of 2000 (88 mentions, as compared with 23 in July-December 1999 and 30 in January-July 1999).
Miami: The most dramatic lesson of the current reporting period is 'Pills that may thrill can also kill.' The impact of rising prescription drug abuse and the proliferation of MDMA pills are observed in drug deaths and other medical problems.
Minneapolis: MDMA was increasingly encountered by law enforcement and abused by young people in the metropolitan area. Its abuse has spread beyond raves or nightclub settings. MDMA abuse was reported at many recreational or party-type settings, such as going to the mall or informal social gatherings that follow high school sporting events. There were six MDMA-related deaths in 2000. Decedents were between the ages of 17 and 26. There were 16 hospital ED cases involving MDMA in 1999 and 12 in the first half of 2000. Hennepin Regional Poison Center received 45 calls regarding reported exposures to MDMA in 2000. Law enforcement seizures submitted to the lab in Minneapolis rose from 2,047 dosage units in 2000 to over 3,000 through April 2001. At the State crime lab, there were 213 tablets in 2000 and 2,839 through April 2001. Ramsey County seized 3,000 tablets in a single case this year in the Asian community. The local DEA office removed 1.7 kilograms of MDMA powder and 1,578 dosage units in 2000.
New York: Ecstasy is widely available on the street as well as at dance clubs throughout New York City. Field workers believe most dealing still takes place in nightclubs.
Philadelphia: In the last year, MDMA use has spread from whites of college age and typical club-goers in their 20s to African-Americans and Hispanics, and from teens to people in their 30s.
Phoenix: Ecstasy has grown in popularity because of its 4 to 6-hour euphoric high and the perception that the drug is not dangerous. One tablet sells wholesale for $5-$8 and retail for $20-$30.
San Diego: Club drugs were frequently mentioned in the media during 2000, with MDMA and GHB receiving the most attention. Little hard data were found to support public fears.
San Francisco: MDMA continues to increase its presence, according to street-based observers. The most noteworthy trend is usage among young blacks. Typical usage is in combination with marijuana and beer. 'Club drugs' (MDMA, GHB, and ketamine) each had the highest-ever ED mentions in early 2000.
St. Louis: MDMA is readily available at raves and other dance parties, and sells for $20-$30 per dose. 'Stacking' or 'piggybacking' is common, i.e., taking three or more tablets at a time or in a row. The rave scene has become quite popular in St. Louis where ecstasy is freely available. To date, little enforcement effort has been directed at this particular market. Ecstasy use appears to be an even bigger problem in Kansas City, according to the DEA. There appear to be two age groups of users, the 15-19-year-old group (high school age) and the 20-25-year-old group (college age).
Seattle: In a 2000 survey of patients in a substance abuse recovery program, 44 percent of 71 patients age 14-24 reported ever using MDMA, and 30 percent had used the drug in the past 6 months. Among patients age 25-50, 45 percent reported ever using MDMA and 10 percent had used the drug in the past 6 months. In 2000, the Seattle ME reported seven deaths involving MDMA, with most also involving other drugs such as alcohol, cocaine, marijuana, methamphetamine, and PCP. MDMA was incidental to the cause of death.
Texas: The number of MDMA cases reported to the Poison Control Centers is increasing. In 1999, there were 35 cases; in 2000, there were 96 cases. The average age of users was 20 years and 56 percent were male. While the number of ED mentions peaked in 1995, the increase between the second half of 1999 and the first half of 2000 was statistically significant. Admissions for a primary, secondary, or tertiary problem with ecstasy increased from 99 adults in 1999 to 141 in 2000, and from 17 adolescents to 58 in 2000. In 1999, there were 102 substances identified as MDMA by DPS labs; the number increased to 303 in 2000. According to the DEA, MDMA is readily available.
Washington, D.C.: The most striking feature of the club drug scene in D.C. is the skyrocketing use of ecstasy. One respondent said, 'E is on the rise; every week someone is trying it, every week someone is rolling (getting high on ecstasy).'
The street price of MDMA in nine reporting CEWG areas varied somewhat. The price was $20-$30 per dose or tablet in four areas (Boston, St. Louis, Seattle, and Washington, D.C.). Price varied little in New York and Philadelphia ($20-$25 per dose) but ranged more widely per dose in Atlanta ($15-$40), Chicago ($20-$40), and Dallas ($10-$40).
DEA reports increasing seizures of MDMA tablets over the past 7 years, as shown below:
| Year |
Seizures |
| 1993 |
196 |
| 1994 |
11,722 |
| 1995 |
27,759 |
| 1996 |
11,912 |
| 1997 |
79,599 |
| 1998 |
143,612 |
| 1999 |
954,878 |
According to DEA's Special Testing and Research Laboratory, the chemicals and equipment required to produce a single kilogram of MDMA can be purchased for as little as $500, depending on the method used and the fluctuating prices of the precursor chemicals.
Gamma Hydroxybutyrate (GHB)
Information from a variety of sources indicates that GHB abuse is on the rise in many areas of the Nation. Nine CEWG areas report increases in GHB indicators. One (Detroit) reports a decline in GHB indicators.
Nationally, DAWN ED mentions related to GHB increased significantly from 1994 to 1999; the increases from 1998 to 1999 were significant also. The number of mentions increased from 56 in 1994 to 1,282 in 1998 and to 3,178 in 1999. Although the number of mentions is small, it increased in most CEWG areas from the second half of 1998 to the first half of 2000. The following chart shows the trend for the six CEWG areas with the largest number of mentions in the first half of 2000.
| Estimated Number of GHB ED Mentions by CEWG Area: DAWN, 2H98-1H00
DAWN |
| City |
2H98 |
1H99 |
2H99 |
1H00 |
| Atlanta |
46 |
47 |
80 |
60 |
| Chicago |
54 |
84 |
51 |
90 |
| Dallas |
86 |
54 |
94 |
73 |
| Los Angeles |
9 |
70 |
59 |
76 |
| Minneapolis |
5 |
17 |
14 |
58 |
| San Francisco |
59 |
70 |
68 |
80 |
| SOURCE: Office of Applied Studies, SAMHSA |
In 2000, the Maryland Poison Control Center received 61 phone calls about GHB and GHB analogues, according to the University of Maryland's Drug Early Warning System (January 2001). Thirty-two of these calls involved hospital treatment. GHB analogues are believed to be the source of GHB in 71 percent of persons urine-tested for GHB in Maryland. GHB analogues are proving to be as dangerous as GHB.
The following excerpts from CEWG reports portray some of the problems and consequences associated with GHB abuse.
Atlanta: GHB (and Rohypnol) have become popular depressants in Atlanta. DEA reports seizures of GHB have been increasing, primarily due to disruption of Internet sales.
Boston: Significant among club drugs is GHB, which is now controlled as a date-rape drug in Massachusetts. The Massachusetts Poison Control Center continued to report many calls concerning GHB and its precursor GBL, involving mostly adolescent and young adult males.
Denver: During the 1994 to 1998 time period, the RMPDC reported only 1 to 6 calls about GHB. However, in 1999 the number of GHB calls jumped to 92. GHB ED mentions have also increased from 7 in 1997 to 13 in 1998 to 70 in 1999.
Detroit: Children's Hospital of Michigan Poison Control reported 40 cases of possible GHB or butanediol (BD) abuse in the first 4 months of 2001. Up to one-third of those calls were from people suspecting someone had given them something and follow-up contacts were not possible.
Los Angeles: Seventy-six ED mentions were reported in the first half of 2000, the highest number ever reported.
Miami: Abuse of GHB and its analogs resulted in increased medical emergencies in 2000, compared with 1999. GHB was detected in 23 decedents statewide in 2000 and identified as the cause of death in 6 cases.
Minneapolis: Of all the club drugs in the metropolitan area, the most marked increase in hospital emergencies was found with GHB. There were 58 hospital ED mentions of GHB in 2000 (first half), compared with 31 in 1999, and 8 in 1998. Hennepin Regional Poison Center reported 65 calls regarding GHB and related products in 2000. Addiction treatment programs also reported a growing number of patients presenting with GHB addiction who exhibited physical dependence, tolerance, and withdrawal.
Newark: It is increasingly reported that GHB (and ketamine) are routinely used at rave parties around college campuses. There were seven DAWN ED mentions of GHB in the first half of 2000.
New Orleans: GHB became widely available in nightclubs and raves.
Philadelphia: GHB was mentioned in 19, 25, and 41 DAWN ED cases in the 3Þ years beginning January 1999.
San Francisco: 'Club drugs' (MDMA, GHB, and ketamine) each had the highest-ever ED mentions in early 2000, the most recent half-year of observation.
St. Louis: GHB use has increased in the St. Louis area. Because it is a depressant, its use with alcohol and its unpredictable purity present users with major health risks.
Seattle: There has been a continued increase in local ED mentions where GHB, or its precursor drugs GBL and 1,4-butanediol, were the primary drugs mentioned.
Texas: In 1999, the rate of ED mentions per 100,000 for GHB was 6.0; only San Francisco and New Orleans had higher rates, at 8.6 and 6.3 per 100,000.
Ketamine
Although not as widely abused as other club drugs, this veterinary anesthetic is the target of veterinary office break-ins and is sold illicitly in many CEWG areas. Nationally, DAWN ED mentions related to ketamine increased from 55 in 1994 to 318 in 1997 and to 396 in 1999. Also, like other club drugs, ketamine ED episodes tend to involve more than one drug. In 1999, nationally, 37 percent of the ketamine ED episodes involved MDMA, 38 percent involved alcohol, and 21 percent involved marijuana. Finally, like other club drugs, the 1999 ketamine ED cases were likely to be under age 25 (80 percent) and white non-Hispanic (75 percent).
Ten CEWG members reported on ketamine.
Boston: Use of the anesthetic ketamine ('Special K'), a drug popular in the club and rave scenes, continues to be reported, although less frequently than MDMA and GHB. State Police reported a rise in ketamine seizures recently in Massachusetts, both in liquid and powder form. However, the DEA indicated that ketamine seems more available in Rhode Island than Massachusetts. Illicit ketamine is often diverted from veterinarian clinics and the DEA reported some trafficking from Mexico.
Chicago: It [ketamine] is somewhat available at 'rave' parties or clubs frequented by adolescents. There were six DAWN ED mentions of ketamine reported in the first half of 2000, compared with none during the same period in 1999.
Denver: There have been only six ketamine ED mentions from 1994 to the first half of 2000. However, 3 of the 6 were in the most recent reporting period.
Detroit: Ketamine remains a target of veterinarian office break-ins.
Minneapolis: There was one hospital case of ketamine in 1999. It is snorted, injected, or put into capsules or pills.
Newark: Ketamine ('Special K') is routinely used at rave parties around college campuses. According to DAWN, there were 14 ketamine ED mentions in 1999 and 5 in the first half of 2000 in the Newark PMSA.
New York: On the street, the drug is called 'Special K' and sells for approximately $20 per dosage unit. It may be snorted or injected and may be mistaken for cocaine HCl. While ketamine is not currently a controlled substance under Federal law, it is listed as a controlled substance in New York State.
Philadelphia: Ketamine was detected in three decedents in the first half of 2000. This is the first time this drug appeared in the Philadelphia mortality cases. There were no deaths with the presence of ketamine in the last half of 2000. There were 11 hospital ED mentions of this drug in the first half of 2000.
Texas: Seven cases of misuse of ketamine were reported to Texas Poison Control Centers in 1999, and 28 were reported in 2000. A 2000 survey showed that 0.3 percent of adults had ever used ketamine and 0.1 percent had used it in the last year.
Washington, D.C.: Ketamine (or 'K') is common in the nightclub and dance scenes in D.C. It is typically sold in a '20 bag,' containing an eighth of a gram. Also sold in bottles, liquid K may be injected or converted to powder form using a boiling process and then snorted or administered anally. According to ethnographic sources, ketamine prices increased during the first months of 2001, with bottles fetching $100 on the street.
PCP (Phencyclidine)
Although indicator data are limited, the existing data point to a resurgence of PCP in some CEWG areas.
Nationally, DAWN ED mentions of PCP and PCP combinations increased 48.7 percent when the first half of 1999 is compared with the first half of 2000. The estimated numbers of PCP/PCP combinations have been highest over time in the five CEWG areas shown below. The increase in Chicago from the first half of 1999 to the first half of 2000 was statistically significant.
| Estimated Numbers of ED PCP/PCP Combinations Mentions in Five CEWG Areas: DAWN, 2H98-1H00 |
| Area |
2H98 |
1H99 |
2H99 |
1H00 |
| Chicago |
218 |
301 |
337 |
424 |
| Los Angeles |
356 |
360 |
376 |
391 |
| New York |
120 |
150 |
129 |
124 |
| Philadelphia |
295 |
328 |
255 |
217 |
| Washington, D.C. |
112 |
135 |
88 |
141 |
| SOURCE: Office of Applied Studies, SAMHSA |
PCP is generally sold in liquid form, and is commonly applied to leafy material such as mint and marijuana and smoked. The rise in PCP abuse and the preference for smoking the drug - especially on mint leaves - is reflected in several CEWG reports.
Chicago: PCP has remained constant and currently is concentrated on the North Side and the far South Side. PCP is typically smoked and is sold in three forms: 'mint leaf,' 'sherm sticks,' and 'happy sticks.' Mint is a moist, loose, tobacco-like substance sprayed with PCP and wrapped in tinfoil. The leafy substance is reported to be marijuana, sold in $10 and $20 quantities.
Los Angeles: There has been a resurgence of PCP trafficking in the Los Angeles area. It is currently sold in jars of the liquid. For a price, the buyer can dip a cigarette into the liquid.
Minneapolis: There was one mixed drug overdose death in 2001 involving PCP and amphetamine.
New York: PCP is available in certain parts of the city, particularly in Harlem. There the drug sells for $10 a bag and is packaged in small plastic bags. In other parts of the city, PCP is sprayed on mint leaves, which are then packaged and sold in small plastic bags. The Street Studies Unit reports that users are smoking PCP and crack together, a combination referred to as 'space basing.'
Philadelphia: At $5 for a small bottle, PCP is easier to obtain than ever before. The more common form is on mint leaves. Spring 2001 focus groups reported that PCP on leaves is smoked in cigarette papers with no other drug added. The number (34) of PCP detections by ME examiners in the second half of 2000 was the highest in any half-year. PCP was mentioned as a primary, secondary, or tertiary drug by 2.3 percent of treatment admissions from July 1999 through December 2000.
Phoenix: Both powdered PCP and liquid PCP are available in Phoenix. The drug is sold in PCP-laced cigarettes ready for smoking. Liquid PCP is more expensive than powder PCP. A PCP cigarette known as a 'dip' is a regular cigarette sprayed with or dipped in a liquid PCP solution and then dried.
St. Louis: PCP is generally used as a 'dip' for marijuana cigarettes.
Texas: In Texas, Poison Control Center calls regarding PCP use increased. PCP is often used in combination with embalming fluid. The rate of mention of PCP in the Dallas emergency rooms has risen to 2.1 per 100,000 in the first half of 2000 (compared with 1.3 nationally). In 1999, there were 50 adults admitted to treatment with a primary, secondary, or tertiary problem with PCP, as compared with 174 in 2000.
Washington, D.C.: PCP use is increasing among youth.
Polydrug Use
At the meeting and in reports, representatives from almost all CEWG areas stressed the fact that indicators of a single drug often reflect abuse of multiple drugs, including alcohol.
Atlanta: Polydrug use is the norm. The choice of drug is based on market availability. There is a 'trail mix-everything you can get your hands on. A sharing back and forth.' For example, 44 percent of heroin treatment admissions use crack and 53 percent use powder cocaine. Ethnographic reports suggest use of methamphetamine with alcohol and marijuana is common among metro Atlanta users; its use with ecstasy, pills (poppers, Ritalin, Xanax), hallucinogens, opiates (Dilaudid, OxyContin), and cocaine (all forms) has been reported also.
Detroit: In the inner city, drugs are a standard unit price commodity. Marijuana, heroin, and crack are all sold in $10 bags/units.
Honolulu: It is also important to note that while marijuana is listed as the primary drug of use at admission, many of these clients also used other substances.
Los Angeles: Among primary cocaine users, alcohol and marijuana were the most commonly used secondary substances.
Miami: Increasingly, treatment admissions are reporting crack and powder cocaine as secondary drugs.
Newark: Cocaine was the most popular secondary drug among alcohol-in-combination and heroin clients (41 and 37 percent, respectively) in the first half of 2000.
New Orleans: A new combination of GHB mixed with amphetamines in an alcoholic drink called 'MAX' became very popular in the French Quarter.
Philadelphia: Multiple drug use is common. Sometimes treatment admissions report use of as many as seven drugs. Forty-six percent use three drugs and 21 percent use four or more drugs. Cocaine in combination with alcohol remains a significant finding in cocaine-positive toxicology reports. Cocaine in combination with another drug(s) was found in 67 percent of all cocaine-positive cases in 1999 and 75 percent of such cases in 2000. Heroin/ morphine was present in 35 percent of cocaine-positive toxicology reports in 1999 and 43 percent in 2000. Crack users continue to report frequent use of 40-ounce bottles of malt liquor or other drugs, including alprazolam, diazepam (Valium), or marijuana along with crack. Less frequently, heroin or phencyclidine (PCP) is used with the crack. Users continue to add PCP, cocaine, or crack to a blunt and commonly use beer, alprazolam (Xanax), cough syrup and/or oxycodone (Percocet) along with a blunt. Spring and autumn 2000 focus groups described ecstasy as highly potent and used in combination with heroin, alcohol, and/or cough syrup. Spring 2001 focus groups reported that ecstasy is used in combination with marijuana and LSD, which better describes use in clubs or raves.
St. Louis: Polydrug use is also evident in the treatment data. The increases in marijuana, heroin, and methamphetamine use suggest this trend will likely continue. 'Stacking' or 'piggybacking', that is, taking three or more tablets at a time or in a row, is common at raves.
Seattle: Of the 99 heroin-related decedents, 81 (81.1 percent) had one or more drugs in addition to heroin in their systems at the time of death, consistent with previous years. The King County ME recorded 13 deaths involving oxycodone in 2000; all but 2 had additional drugs and/or alcohol in their systems at the time of death. Many users tend to experiment or regularly use a variety of club drugs in combination. In 2000, seven deaths were recorded by the King County ME involving MDMA; the majority involved other drugs such as alcohol, cocaine, marijuana, methamphetamine, and PCP. In a study of 43 GHB non-fatal overdoses, 16 (37 percent) consumed only GHB, 15 (35 percent) combined GHB with alcohol, 10 (23 percent) with MDMA, and 4 (9 percent) each with methamphetamine and cocaine. A common drug combination [among local ED patients] involved GHB, alcohol, and MDMA.
Texas: In Austin, benzyl-piperazine (BZP), an amphetamine, and also n-3-trifluormethyl-phen piperazine (TFMPP), a hallucinogenic, are being used together to produce an effect similar to MDMA.
International Reports
East and South Asian Cities
Drug abuse patterns and trends were compared across Asian cities for the period 1994-98. The East Asian cities were Bangkok (Thailand), Kuala Lumpur (Malaysia), and Manila (Philippines). The South Asian cities were Colombo (Sri Lanka), Dhaka (Bangladesh), Islamabad (Pakistan), and Madras (India).
Among treatment admissions, heroin was the drug most likely to be abused in all cities except Manila. The pattern fluctuated in five other cities, decreasing in Bangkok, increasing in Islamabad, Madras, and Dhaka, and returning to 1994 levels in Kuala Lumpur; the 1998 level in these five cities was highest in Islamabad (93 percent) and ranged between 70 and 77 percent in the other four cities. In Colombo, more than 90 percent of the treatment admissions reported use of heroin in each of the 5 years.
Cannabis use among treatment admissions also varied across the years, but was less than 6 percent in five of the cities. Reported use was highest in Manila, peaking at 45 percent in 1997 and returning to the 1994 rate of 39 percent in 1998. In Kuala Lumpur, the proportion of admissions reporting cannabis use peaked in 1996-97 at 32 percent and declined to the 1994 level of 21 percent in 1998.
In three cities where treatment data were gathered on amphetamine use, the proportion of admissions reporting use of this drug in Manila rose sharply from 34 percent in 1996 to 92 percent in 1998. Although at a much lower level, a dramatic increase in use occurred in Bangkok (from less than 1 percent in 1994 to 11 percent in 1998). No amphetamine use was reported by Kuala Lumpur admissions.
Polydrug use among treatment admissions was highest in Manila, although it dropped from 100 percent in 1994-95 to 89 percent in 1998. Polydrug use was lower in other cities. The 1998 figures show 60 percent in Islamabad, 25 percent in Madras, 15 percent in Bangkok, 5 percent in Dhaka, and zero in Kuala Lumpur.
Injection drug use was common among treatment admissions in Bangkok (61-71 percent over the 5 years) and Madras (48-57 percent), while smoking ("chasing the dragon") was common in Islamabad (75 percent in 1998) and Dhaka (rising to 71 percent in 1998).
Arrests for drug trafficking were highest in Manila, while those for selling were highest in Islamabad. Arrests for drug use were highest in Colombo. Arrests for drug possession were highest in Bangkok.
Canada
The Canadian Community Epidemiology Network on Drug Abuse (CCENDU), established in 1995, collects, analyzes, and reports quantitative and qualitative data/information on substance use and abuse from a number of sources. Currently, 11 sites participate in the CCENDU.
The data show that alcohol continues to be the major substance abuse problem across all areas in Canada. However, drug problems differ by city. Crack cocaine is currently a major health and social problem in Canada's three largest cities: Montreal, Toronto, and Vancouver. Along with its upward trend in crack use, an increase in injection as the mode of crack administration had led to higher rates of HIV seroprevalence. In addition, dramatic increases in newly diagnosed cases of hepatitis B and C are associated with the injection of drugs, including crack. In 1999, cocaine-related deaths were reported in Montreal (n = 25), Toronto (22), an Vancouver (20). In a school survey conducted in 1999, 6.4 percent of students in Toronto reported use of cocaine/crack, compared with 2.7 percent in 1997. In Vancouver, the number of cocaine criminal justice offenses increased from 746 in 1995 to 1,044 in 1999.
There have been anecdotal reports that ecstasy and GHB use have been increasing in many Canadian cities. In the 1999 school survey, 7 percent of the students in Toronto reported use of ecstasy. In the past 2 years, 13 ecstasy-related deaths were reported in Toronto.
Indonesia
Drug abuse indicators are once again increasing and changing in Indonesia. Drug use and misuse is considered one of the country's most serious problems.
Crystal methamphetamine ("shabu") is one of the most popular drugs in all parts of the country, second to marijuana and more popular than MDMA among the upper and middle class users. Heroin ("putaw") is becoming increasingly popular as prices drop and marketing strategies improve. Heroin is the first drug of choice in Jakarta, the second drug of choice in Surabaya, and fourth in Manado.
Clinical, court, and police arrest data show sharp increases in drug-related indicators. The patient caseload in the Drug Dependence Hospital increased 365 percent from 1996 to 1999, peaking in 1999 at 9,714. During the first half of 2000, the hospital treated 3,566 patients in inpatient and outpatient services. Drug-related arrests also increased dramatically, with narcotics cases climbing from fewer than 400 in 1996 to 2,058 in 2000. Various sources suggest higher rates of HIV and hepatitis C among injection drug users. Results from interviews with 598 respondents in 8 capital cities covered in the Rapid Assessment and Response initiative show that heroin and methamphetamine are the drugs of choice. The drugs are readily available and prices per gram range (in U.S. dollars) from $35-$55 for heroin and $12-$22 for crystal methamphetamine. Sizable proportions of respondents in each city engaged in behaviors that place them at high risk for HIV/AIDS and other diseases.
Mexico
The Mexican Epidemiologic Surveillance System of Addictions (SISVEA), a network of institutions specializing in addiction research, operates in 25 Mexican cities, half of which are located along the U.S.-Mexico border. The primary sources of data are government and nongovernment treatment centers, medical examiners, and surveys.
Data collected from 12,681 patients at governmental treatment centers (GTCs) during 2000 show that 21.3 percent reported marijuana as their first drug of use, 14 percent reported inhalants, 12.7 percent cocaine, and only 0.2 percent heroin. Almost one-third (32.1 percent) reported alcohol as their first drug of use. However, data on current drug use show that cocaine accounted for the largest proportion of patients (43.1 percent), followed by marijuana (18.6 percent), inhalants (13.6 percent), alcohol (7.2 percent), and heroin (4 percent). A majority of the patients had used two or more substances.
The 10,108 patients treated in nongovernment treatment centers (NGCs) in 2000 tended to be older (81 percent were age 20 or older) than patients treated in GTCs and were more likely to use drugs daily (64 percent vs. 39 percent). A relatively high proportion (31.5 percent) of NGC patients reported marijuana as their first drug of use, 33.1 percent reported alcohol, 8.2 percent inhalants, 6.9 percent cocaine, and 2.2 percent heroin. The most frequently reported drugs currently used were cocaine (25.3 percent) and heroin (24 percent), followed by alcohol (15.3 percent), and marijuana (13.9 percent). The majority had used more than one substance.
A high proportion (88 percent) of the deaths associated with drug intoxication reported by medical examiners involved alcohol. Among 5,056 juveniles arrested in the last half of 2000, approximately one-fifth had used three substances: alcohol, inhalants, and cocaine. Also, 38.1 percent reported use of marijuana and 0.7 percent reported use of heroin.
South Africa
The South African Community Epidemiology Network on Drug Use (SACENDU), initiated in 1996, monitors trends in alcohol and other drug use in Cape Town, Durban, Port Elizabeth (PE), Mpumalanga, and Gauteng (Johannesburg/ Pretoria) and is in the process of expanding its surveillance system to other countries (Mauritius, Lesotho, and the Seychelles).
Findings from SACENDU's Phase 9 effort show that alcohol continues to dominate treatment admissions across the five sites (51-79 percent of total primary admissions), with increases in two (PE and Mpumalanga). In 2000, 56 percent of the mortuary cases had high blood-alcohol concentrations. Among arrestees, between 6 percent (Gauteng) and 23 percent (Cape Town) reported being under the influence of alcohol at the time of arrest. About 1 in 4 students (grades 7, 10, and 11) in a Pretoria school survey reported being drunk occasionally in a "typical month."
Use of cannabis and Mandrax (methaqualone and antihistimine) alone or in combination ("white pipe") continues to be high. However, treatment demand for cannabis abuse remained stable (or decreased in Durban), while demand for Mandrax or the "white pipe" combination decreased. Arrests for dealing in cannabis decreased in Cape Town but increased in three other sites, and cannabis seizures increased in Durban and PE. Arrests for dealing Mandrax increased, except in Cape Town, and Mandrax seizures increased in three sites. Among arrestees, cannabis-positive results ranged from 24 percent (Gauteng) to 50 percent (Cape Town), while those for Mandrax ranged from 5 percent (Gauteng) to 32 percent (Cape Town). In the Pretoria school survey, around a third of the students admitted to smoking cannabis.
Indicators for cocaine powder/crack remained low and either decreased or were stable. Heroin indicators were low also. "Club drugs" remain entrenched in the culture and concern relates mostly to the quality of these drugs, use with other drugs, and a possible "moving on" to other drugs. One-fifth of "ravers" in Gauteng reported weekly use of ecstasy. Abuse of over-the-counter and prescription drugs continues to be a concern; treatment demand for such drugs increased in Durban and Gauteng but decreased in other sites. Solvents continue to be abused by young people, especially street youth. Poly-substance abuse remains common, e.g., use of crack and heroin among sex workers, ecstasy and LSD, cannabis and Mandrax, and alcohol with various substances.
Thailand
An exploratory study was conducted in 31 Karen tribal villages in northern Thailand to address a question that emerged from previous studies: "Why do some villages have drug problems and others do not?" In 1999/2000, data were collected from 32 village leaders and 432 residents, with ratings on village characteristics by field workers. Two village groups were identified: "High Drug" (n = 16) and "Low Drug" (n = 15). A cluster analysis was performed using methamphetamine (any age) and opium (ages 18-35 and 36-60). In addition, interviews were conducted with 19 Karen drug addicts undergoing treatment in an attempt to assess the role of village-level factors on the addicts' drug use.
Overall, few village-level variables were significantly related to the prevalence of drug use in the villages, probably because of the small sample size. Among 38 questions asked, only one was found to differ significantly by village type: "Do you have everything you need in your village?" Only 7 percent of respondents in Low Drug villages answered affirmatively, compared with 38 percent of respondents from High Drug village.
There was some support for the hypothesis that better developed and less traditional villages have higher levels of drug use and, thus, that development is partially responsible for the drug problems.
Preliminary results from the addict survey show that social institutions are strongly against drug use, while peers and coworkers are less so. Drugs are introduced primarily through peers in the village (infrequently in settings outside the village). The reasons for initiating drug use focused on pain relief provided by opium and the "work enhancement" from methamphetamine.
|