This Advance Report is a synthesis of findings presented at the 51st biannual meeting of the Community Epidemiology Work Group (CEWG) held in San Diego, California, on December 11-14, 2001. Sponsored by the National Institutes of Health, National Institute on Drug Abuse (NIDA), the CEWG is a network of epidemiologists and researchers in the United States that meets biannually to review current and emerging substance abuse problems. The members present drug abuse indicator data, survey findings, and other quantitative information compiled from local, city, State, and Federal sources. To assess drug abuse patterns and trends, data from a variety of health and other drug abuse indicator sources are accessed and analyzed. Sources include public health agencies, medical and treatment facilities, medical examiners' and coroners' offices, criminal justice and correctional offices, law enforcement agencies, poison control centers, and sources unique to local areas.
National data are used to enhance what is presented by CEWG members. Large-scale Federal databases used in analyses include the Treatment Episode Data Set (TEDS), and the Drug Abuse Warning Network (DAWN) data on emergency department (ED) drug-related mentions and medical examiner (ME) drug-related deaths maintained by the Substance Abuse and Mental Health Services Administration (SAMHSA); the Arrestee Drug Abuse Monitoring (ADAM) program funded by the National Institute of Justice (NIJ); the Domestic Monitor Program (DMP), the National Forensic Laboratory Information System (NFLIS), and other information on drug seizures, price, and purity from the Drug Enforcement Administration (DEA); and the Uniform Crime Reports maintained by the Federal Bureau of Investigation (FBI). These data are enhanced with qualitative information obtained from ethnographic research, focus groups, and other community-based sources.
Information reported at each CEWG meeting is distributed to drug abuse prevention and treatment agencies, public health officials, researchers, and policymakers. The information is intended to alert authorities at the local, State, regional, and national levels, and the general public, to the current conditions and potential problems so that appropriate and timely action can be taken. Researchers also use this information to develop research hypotheses that might explain social, behavioral, and biological issues related to drug abuse.
In addition to ongoing assessment of drug patterns and trends in the United States, the CEWG provides a forum for the discussion of drug patterns and trends in other areas and regions of the world. This meeting included presentations on drug abuse surveillance and other research in Canada and Mexico. Mexican representatives provided an update on treatment data and findings from an ethnographic study focused on heroin. A representative of the Centre for Addiction and Mental Health in Toronto, Ontario, presented highlights from the 2001 Ontario Student Drug Use Survey. These data on senior students were compared with 2000 data reported by the Monitoring the Future Study, conducted by the Institute for Social Research, University of Michigan.
Michael Ann Haight, San Diego CEWG member, planned and organized a series of presentations and panels focused on issues and interventions in San Diego County, including the following: the Methamphetamine Vista Partners Project; the Drug Endangered Children's Project; Proposition 36 (The Substance Abuse and Crime Prevention Act) plans and programs; Matrix, a Multi-Site Treatment Program for Methamphetamine; a dialogue with methamphetamine abuse clients; and the Border Collaborative Project.
In addition, a DAWN Data Workshop was conducted and an official of DEA described the data sources used by the DEA to track 3,4-methylenedioxymethamphetamine (MDMA) seizures and determine the quality of drugs.
Data from the 51st CEWG meeting portrayed both the similarities and the diversity of drug abuse patterns within and across CEWG areas, as well as changes in trends over time. The findings presented in this report are based primarily on comparisons of 1999 and 2000 data. In some instances, the findings are supplemented by data from earlier periods and data from the first half of 2001. The major findings are highlighted below.
In most CEWG areas, cocaine/crack indicators have been stabilizing and/or trending down for some time. Between 1999 and 2000, cocaine/crack indicators decreased in 10 areas, were stable or mixed in 9, and increased in only 2. Rates of DAWN cocaine ED mentions per 100,000 population tended to be much higher than the rates for other drugs. ADAM data continue to show that high percentages of arrestees test positive for cocaine, with females more likely than males to test positive. In 2001, large proportions of clients entering drug abuse treatment programs were primary crack users.
Crack indicators continue to remain at high levels in most CEWG areas despite the fact that new drugs have emerged in recent years, other drugs have become more available and less expensive, and crack has a bad reputation on the street. As stated in the Washington, D.C., report, Crack is viewed in a negative light and is not considered popular among new drug abusers. Crack is associated with violent and desperate behavior in disadvantaged communities in D.C. In other D.C. communities, crack is also eschewed by middle-class users of illicit substances.
Increases from 1999 to 2000-01 in cocaine/crack indicators were reported in two areas:
The following excerpts are from CEWG areas reporting increased use of powder cocaine:
The rates per 100,000 population for cocaine/crack ED mentions in 2000 are depicted on the map in exhibit 1 for each CEWG area. As shown, rates of cocaine/crack ED mentions exceeded 200 per 100,000 population in 5 CEWG areas: Chicago (246), Miami (225), Atlanta (221), Philadelphia (216), and Baltimore (208).
The DAWN data show that cocaine/crack ED mentions increased significantly in 6 of the 20 CEWG metropolitan areas (Honolulu is not a DAWN site) from 1999 to 2000. Statistically significant increases were found in Los Angeles (35 percent), Seattle (32 percent), Atlanta (19 percent), Boston (15 percent), Chicago (11 percent), and Miami (9 percent).
As shown in exhibit 2, in five eastern CEWG areas, cocaine/crack ED mentions trended downward from 1997 to 2000, although the numbers continued to be high, especially in New York City and Philadelphia. In Boston, Dallas, Denver, Detroit, San Diego, and San Francisco, ED cocaine/crack levels remained relatively stable in 2000.
Exhibit 1. Summary of Rates of DAWN ED Cocaine Mentions by CEWG Area*: 2000
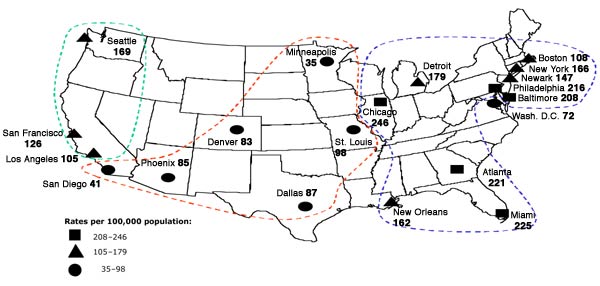 * The geographic areas encircled by dotted lines depict regional differences.
SOURCE: Office of Applied Studies, SAMHSA |
Exhibit 2. Downward Trends in Cocaine/Crack ED Mentions in Five CEWG DAWN Areas: 1997-2000
 * Statistically significant change from 1999 to 2000 at 0.5
SOURCE: Office of Applied Studies, SAMHSA |
In the total coterminous United States DAWN sample, more than one-half of cocaine mentions (53 percent) occurred among patients age 35 and older. In 2000, cocaine mentions increased by 9 percent over 1999 in the 35- and-older age category.
The ADAM 2000 data, based on random sampling procedures (and therefore not comparable to data in prior years), show that high percentages of adult male arrestees (weighted sample) and female arrestees (unweighted sample) tested positive for cocaine. As in the past, higher percentages of females than males tested cocaine-positive in most CEWG areas. The exceptions were Dallas and Laredo, where the numbers of female arrestees were relatively small.
The percentages of female arrestees testing positive for cocaine were especially high in Chicago (59.2 percent), Atlanta (57.6 percent), New York (53.0 percent), Denver (46.9 percent), Ft. Lauderdale (44.8 percent), and Detroit (42.4 percent). Percentages among adult male arrestees were highest in New York (48.8 percent) and Atlanta (48.5 percent).
The percentages of adult female arrestees testing positive for cocaine were relatively low in Honolulu (19.4 percent), Laredo (22.4 percent), Dallas (23.9 percent), and San Diego (26.1 percent). Of note in these four cities is the fact that only small percentages of females tested opiate-positive -- Laredo (6.9 percent), Dallas (4.5 percent), San Diego (7.5 percent), and Honolulu (8.3 percent). Adult female arrestees in Honolulu and San Diego were more likely to test positive for methamphetamine than for cocaine or heroin, 47.2 and 28.7 percent, respectively.
Heroin
From 1999 to 2000, DAWN ED heroin mentions increased significantly in seven CEWG areas: Atlanta, Boston, Chicago, Detroit, Miami, Minneapolis/St. Paul, and New Orleans. The percentages of 1-year increases in mentions were highest in Seattle (75 percent), Boston (50 percent), Miami (38 percent), San Francisco (33 percent), and Minneapolis (28 percent). Rates of heroin/morphine ED mentions per 100,000 were greater than rates for cocaine/crack, marijuana/hashish, and methamphetamine/speed in four CEWG areas: Baltimore, Newark, San Diego, and San Francisco.
Rates of heroin ED mentions per 100,000 population are depicted in exhibit 3 for all CEWG areas.
Exhibit 3. Rates* of Heroin/Morphine ED Mentions by CEWG Area: 2000
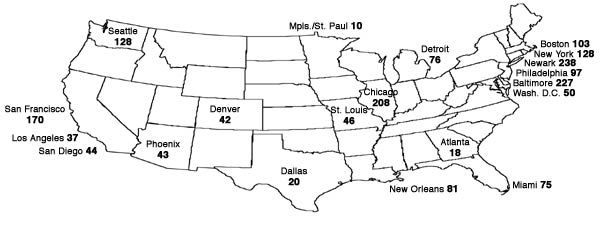 * Per 100,000 population
SOURCE: Office of Applied Studies, SAMHSA |
In 10 CEWG areas, rates of ED heroin/morphine mentions per 100,000 population reached or exceeded their highest levels in more than 10 years in 2000 (exhibit 4).
Exhibit 4. CEWG Areas Where Rates* of DAWN Heroin/Morphine ED Mentions Reached the Highest Levels in More than 10 Years: 1990-2000
| CEWG Area |
1990 |
1991 |
1992 |
1993 |
1994 |
1995 |
1996 |
1997 |
1998 |
1999 |
2000 |
Percentage Change
1990-2000 |
| Atlanta |
3 |
6 |
9 |
10 |
17 |
16 |
15 |
15 |
18 |
16 |
18 |
500 |
| Boston |
27 |
34 |
59 |
66 |
71 |
83 |
76 |
69 |
75 |
77 |
103 |
281 |
| Chicago |
38 |
41 |
53 |
64 |
85 |
83 |
109 |
148 |
159 |
164 |
208 |
447 |
| Denver |
9 |
7 |
8 |
18 |
33 |
31 |
22 |
31 |
32 |
41 |
42 |
367 |
| Detroit |
40 |
46 |
46 |
59 |
52 |
58 |
77 |
72 |
68 |
62 |
77 |
93 |
| Miami |
3 |
8 |
10 |
14 |
15 |
18 |
21 |
32 |
41 |
48 |
75 |
2,400 |
| Mpls./St. Paul |
4 |
3 |
4 |
6 |
3 |
5 |
6 |
7 |
8 |
9 |
10 |
150 |
| New Orleans |
23 |
20 |
13 |
12 |
17 |
24 |
26 |
36 |
44 |
55 |
81 |
252 |
| Philadelphia |
61 |
55 |
53 |
55 |
54 |
85 |
85 |
82 |
76 |
87 |
97 |
59 |
| St. Louis |
5 |
8 |
9 |
10 |
18 |
17 |
22 |
20 |
27 |
37 |
46 |
820 |
*Per 100,000 population
SOURCE: Office of Applied Studies, SAMHSA
The following excerpts are from CEWG reports where heroin indicators increased from 1999 to 2000-01.
Boston Most heroin indicators continue to rise. The impact of widely available, low-cost and high-purity heroin is reported by treatment providers, who continue to see more heroin users seeking services. Heroin may have surpassed cocaine as the drug of choice in Boston and other areas in Massachusetts. Primary heroin admissions now constitute the largest percent of illicit drug admissions in Greater Boston's publicly funded treatment programs (42 percent). Those admissions reporting heroin as their primary drug have risen from 31 percent in fiscal year (FY) 1996 to 42 percent in FY 2001. The proportion of heroin mentions in Boston ED drug-related episodes rose from 20 percent in 1998 to 27 percent in the second half of 2000. In FY 2000, heroin arrests accounted for 27 percent of all drug arrests in Boston, up from 24 percent in 1999 and 13 percent in 1992.
Denver Most heroin indicators are increasing. DAWN data show that rates of heroin ED mentions declined from 1994 (31 per 100,000) through 1996 (22 per 100,000). However, from 1996 to 2000, they nearly doubled (42 per 100,000).
Detroit Most heroin indicators are increasing. Heroin as the primary drug among treatment admissions in FY 2001 accounted for 34 percent of all admissions in Detroit/Wayne County and 13 percent of admissions statewide. The 4,461 heroin primary drug admissions in Detroit/Wayne County accounted for 57 percent of the statewide total of 7,857 heroin primary drug admissions.
Minneapolis/St. Paul Heroin-related indicators increased again in 2001, and opiate-related deaths, most from accidental heroin overdose, surpassed those from cocaine in both cities. High-purity heroin at very low prices and in steady supply fueled this increase in mortality.
Rates of DAWN heroin/morphine mentions per 100,000 population peaked in earlier years in several CEWG areas but were still at relatively high rates in 2000 (exhibit 5). Baltimore was an exception. In this city, the total number of ED mentions for most illicit drug categories decreased dramatically. This may be related to changes in reporting or hospitals in the DAWN system in 2000. Nevertheless, Baltimore had the second highest rate in 2000.
Exhibit 5. Trends and Peak Years in Rates* of DAWN Heroin/Morphine ED Mentions: 1990-2000
| CEWG Area |
1990 |
1991 |
1992 |
1993 |
1994 |
1995 |
1996 |
1997 |
1998 |
1999 |
2000 |
| Baltimore |
78 |
180 |
234 |
259 |
338 |
367 |
358 |
356 |
390 |
299 |
227 |
| Dallas |
14 |
10 |
12 |
13 |
10 |
12 |
15 |
21 |
21 |
18 |
20 |
| Los Angeles |
31 |
21 |
37 |
46 |
36 |
38 |
40 |
30 |
31 |
35 |
37 |
| New York |
49 |
77 |
106 |
142 |
140 |
133 |
136 |
115 |
110 |
110 |
128 |
| Newark |
124 |
140 |
170 |
265 |
262 |
328 |
307 |
246 |
282 |
260 |
238 |
| Phoenix |
19 |
18 |
18 |
25 |
25 |
25 |
32 |
41 |
44 |
43 |
43 |
| San Diego |
34 |
34 |
45 |
37 |
30 |
30 |
42 |
39 |
42 |
46 |
44 |
| San Francisco |
269 |
211 |
208 |
243 |
233 |
204 |
203 |
175 |
150 |
191 |
170 |
| Seattle |
35 |
44 |
61 |
94 |
113 |
109 |
130 |
154 |
127 |
128 |
128 |
| Washington D.C. |
38 |
41 |
42 |
39 |
34 |
35 |
41 |
45 |
55 |
46 |
50 |
*Per 100,000 population
SOURCE: Office of Applied Studies, SAMHSA
Across CEWG areas in the ADAM program in 2000, adult male arrestees (weighted sample) and female arrestees (unweighted sample) were considerably less likely to test positive for opiates than for cocaine. Chicago, by far, had the highest percentage of females testing positive for opiates (40.0 percent) and the highest number of females tested (1,301). More than one-third (33.8 percent) of female arrestees in Chicago reported use of opiates in the past 30 days. Nearly one-quarter (24.2 percent) of female arrestees in Detroit tested positive for opiates, as did 19.1 percent of those in New York and 17.4 percent of those in Seattle. Relatively small percentages of female arrestees tested positive for opiates in most ADAM sites in the West and Southwest, including Houston (3.3 percent), Dallas (4.5 percent), Denver (5.8 percent), Phoenix (6.5 percent), Laredo (6.9 percent), San Diego (7.5 percent), and Los Angeles (7.7 percent).
The CEWG areas with the highest percentages of male arrestees testing positive for opiates in 2000 were New York (20.5 percent), New Orleans (15.5 percent), Philadelphia (11.8 percent), and Detroit (8.0 percent). In the Southwest and West, the percentages of adult males testing opiate-positive were much lower: Dallas (3.0 percent), Denver (3.4 percent), San Diego (6.0 percent), and Phoenix (6.6 percent). Low percentages were also reported in Ft. Lauderdale (2.1 percent), Atlanta (2.8 percent), Minneapolis (3.0 percent), Miami (4.0 percent), and Honolulu (6.8 percent).
Year 2000 DMP data on heroin show a high average purity level (43.9 percent) in areas east of the Mississippi River (exhibit 6), with the prime source of the drug being South America. Purity levels are especially high in the northeastern cities covered by DMP and two mid-Atlantic cities, with purity being highest in Philadelphia (73.0 percent). In cities west of the Mississippi, the prime source of heroin is Mexico and the average purity level is only 28.6 percent. However, in three cities near the Mexican border, purity levels are relatively high -- 49.0 percent in San Diego, 42.3 percent in Phoenix., and 45.3 percent in El Paso.
Exhibit 6. Domestic Monitor Program - Heroin Purity in 18 CEWG Areas: 2000
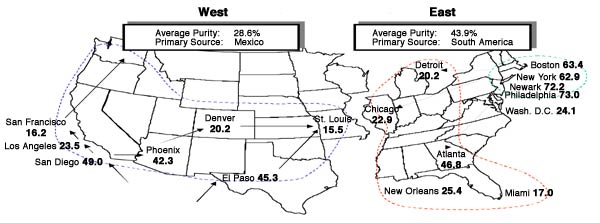 SOURCE: Domestic Monitor Program, DEA |
Marijuana
From 1990 to 1998, marijuana indicators increased sharply across all 21 CEWG areas. In 1999, it appeared that indicators were leveling off. In 2000, marijuana indicators increased in 12 CEWG areas, remained stable or mixed in 8, and decreased in 1 (Atlanta).
The CEWG areas with the highest proportion of primary marijuana abuser treatment admissions in 2000 were Denver (42 percent), Miami (37 percent), New Orleans (29 percent), St. Louis (27 percent), New York (25 percent), Atlanta (21 percent), and Seattle/King County (19 percent). In Texas, 75 percent of adolescent admissions were for marijuana. In most CEWG areas, increasing numbers of primary marijuana abusers have been coming into treatment - many from criminal justice system referrals.
In recent years, increasing numbers of patients treated in hospital emergency departments for drug-induced or drug-related problems have used marijuana. In the coterminous United States, total DAWN marijuana/hashish mentions increased steadily from 1990 (15,706) to 2000 (96,446), an increase of 514 percent. In the 12- to 17-year-old category, marijuana/hashish mentions increased 622 percent from 2,170 to 15,683.
From 1999 to 2000, marijuana/hashish ED mentions increased significantly in seven CEWG metropolitan areas: Boston, Chicago, Denver, Miami, Minneapolis/
St. Paul, San Francisco, and Seattle. Marijuana/hashish ED mentions did not decrease significantly in any CEWG area during this 1-year period.
The metropolitan areas with the highest percentage increases in ED mentions were Seattle (75 percent), Boston (50 percent), Miami (38 percent), San Francisco (33 percent), Minneapolis/St. Paul (28 percent), Denver (20 percent), and Chicago (18 percent). Exhibit 7 ranks the CEWG areas from highest to lowest by rate of marijuana/hashish mentions per 100,000 population.
Exhibit 7. Estimated DAWN Rates* of Marijuana/Hashish ED Mentions by CEWG Area: 2000
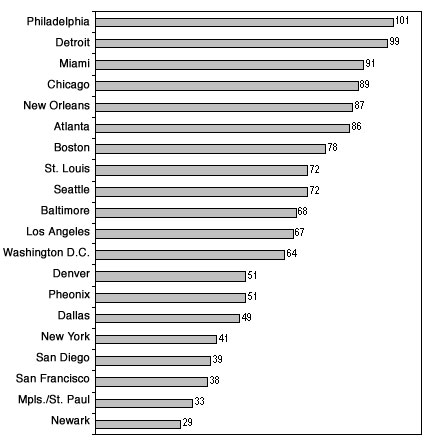 * Per 100,000 population
SOURCE: Office of Applied Studies, SAMHSA |
In 2000, rates per 100,000 population of marijuana/hashish mentions reached the highest levels in more than 10 years in 8 CEWG areas (exhibit 8).
Exhibit 8. CEWG Areas Where Rates* of DAWN Marijuana/Hashish Mentions Peakedin 2000: 1990-2000
| CEWG Area |
1990 |
1991 |
1992 |
1993 |
1994 |
1995 |
1996 |
1997 |
1998 |
1999 |
2000 |
| Chicago |
18 |
15 |
27 |
24 |
39 |
51 |
61 |
76 |
85 |
77 |
89 |
| Denver |
19 |
12 |
12 |
14 |
27 |
33 |
19 |
32 |
37 |
43 |
51 |
| Los Angeles |
14 |
23 |
17 |
22 |
20 |
21 |
26 |
25 |
41 |
64 |
67 |
| Miami |
18 |
25 |
20 |
26 |
39 |
53 |
55 |
55 |
59 |
67 |
91 |
| Mpls./St. Paul |
7 |
6 |
12 |
17 |
21 |
20 |
23 |
26 |
21 |
26 |
33 |
| Phoenix |
6 |
7 |
9 |
12 |
23 |
24 |
31 |
37 |
36 |
50 |
51 |
| St. Louis |
7 |
9 |
10 |
7 |
40 |
37 |
40 |
47 |
56 |
68 |
72 |
| San Francisco |
31 |
21 |
19 |
30 |
31 |
33 |
27 |
25 |
25 |
29 |
38 |
*Per 100,000 population
SOURCE: Office of Applied Studies, SAMHSA
In 2000, high percentages of the Minneapolis ADAM adult male arrestee sample (54.2 percent) and female sample (44.4 percent) tested positive for marijuana. More than one-half (53.4 percent) of males and slightly more than one-third (34.8 percent) of females in Minneapolis admitted to using marijuana in the past 30 days. Other CEWG areas with high percentages of ADAM adult males testing positive for marijuana were Detroit (49.8 percent), Philadelphia (49.4 percent), New Orleans (46.6 percent), Ft. Lauderdale (43.3 percent), Denver (40.9 percent), San Antonio (40.7 percent), and New York (40.6 percent).
In most CEWG areas, smaller percentages of females than males tested positive for marijuana. Percentages were highest in Minneapolis (44.4
percent), as well as in Seattle (47.8 percent) and Denver (33.8 percent). The areas with the lowest percentages of adult females testing marijuana-
positive were in Laredo (17.2 percent), Honolulu (19.4 percent), and Dallas (20.9 percent).
Methamphetamine/Speed
In 2000, methamphetamine/speed was mentioned in only 2 percent of drug-related episodes reported by DAWN across the coterminous United States. Most ED mentions (81 percent) were reported in five western metropolitan areas: Los Angeles (1,375), San Diego (747), Phoenix (600), San Francisco (591), and Seattle (540). From 1999 to 2000, the number of methamphetamine/speed ED mentions increased significantly in four of these five CEWG areas: Los Angeles, San Diego, Phoenix, and Seattle; rates per 100,000 population also increased in these four areas.
After peaking in 1994 in Los Angeles (17), Phoenix (42), and San Francisco (82), rates of methamphetamine/speed ED mentions per 100,000 population decreased to lower levels in succeeding years (exhibit 9). However, in 2000, the Los Angeles rate rebounded to 16 per 100,000 population. In Denver, after increasing sharply in 1997 from 7 to 19, the rate of methamphetamine/speed mentions decreased to 8 in 1998 and remained low in 1999 (6) and 2000 (7). In San Diego, the rate of ED methamphetamine/speed mentions decreased to the lowest level in 8 years (24) in 1999, only to increase again in 2000 to 31. The rate in Seattle reached its highest level in 2000 (27).
Exhibit 9. Rates* of ED Methamphetamine/Speed Mentions in Selected Metropolitan Areas: 1989-2000
 * Per 100,000 population
SOURCE: Office of Applied Studies, SAMHSA |
The ADAM CEWG cities with the highest percentages of adult male arrestees testing positive for methamphetamine included Honolulu (35.9 percent), San Diego (26.3 percent), and Phoenix (19.1 percent). Even higher percentages of the unweighted adult female sample tested methamphetamine-positive in Honolulu (47.2 percent), San Diego (28.7 percent), and Phoenix (24.1 percent). A high percentage of adult females also tested positive in Seattle (21.7 percent), but the sample only included 36 women. Among White females in San Diego, 36.1 percent tested positive for methamphetamine, compared with 23.4 percent of Hispanics and 22.8 percent of African-Americans. Among males in San Diego, 35.0 percent of Whites tested methamphetamine positive, compared with 30.2 percent of Whites and only 8.4 percent of African-Americans.
The percentages of juvenile arrestees testing positive for methamphetamine in San Diego were relatively small -- 3.1 percent for males and 3.4 percent for females. Percentages were higher in Phoenix (12.8 percent males and 10.5 percent females), Denver (11.2 percent males and 11.5 percent females), Los Angeles (8.5 percent males), and San Antonio (4.7 percent females).
Following are excerpts from CEWG reports presented by representatives of the six areas that have had serious problems with methamphetamine and, in 2000, reported increases in the indicators.
Denver Methamphetamine indicators, which increased from 1993 through 1997, mostly declined in 1998 and 1999, but seem to have started climbing again in 2000 and 2001. Methamphetamine treatment admissions have shown a fluctuating pattern over the past 6 years. However, in the first half of 2001, they constituted 14.8 percent of drug admissions, the highest proportion since 1997. The DEA describes widespread methamphetamine availability.
Honolulu Crystal methamphetamine has increased its impact on the State. Treatment admissions, deaths, Honolulu police cases, and neighbor island police cases are all up. Prices of " ice" are down, supply is high, and the societal costs in terms of violence and disruption of families and communities have continued.
Los Angeles Methamphetamine ED mentions remained relatively low and stable, whereas primary treatment admissions increased by approximately 25 percent. Due to environmental hazards such as the toxic contamination of clandestine laboratories, the ease of manufacture, and the violence associated with its distribution, methamphetamine continues to compromise the safety of the community. The Los Angeles High Intensity Drug Trafficking Area group and the DEA Los Angeles Division note a developing but currently limited market for methamphetamine tablets (known as "yaba" ) at raves and nightclubs in the area. In some cases, the tablets are sold as MDMA; in others, the tablets are taken in addition to MDMA.
Pheonix ME data projected a modest increase of 12 percent for methamphetamine-related deaths for 2001. Currently, the drugs of greatest concern in Arizona are methamphetamine, MDMA, and other club drugs.
San Diego Accidental overdose deaths involving methamphetamine increased 65 percent from 1999 to 2000, when 61 decedents were positive for methamphetamine. Methamphetamine accounted for 33 percent of all treatment admissions in 2000.
Seattle/King County Methamphetamine use is continuing to rise, though at a lower rate than in other areas of the State. DAWN ED mentions for amphetamine and methamphetamine in Seattle/King County during 2000 continued the upward trend first noted in 1999. Ease of access to precursors; the availability of equipment, recipes, and locations; and the purity of methamphetamine produced by local clandestine labs contribute to their
proliferation.
Hydrocodone and Oxycodone
Hydrocodone and oxycodone mentions represented only small percentages of total DAWN ED mentions in the coterminous United States reported in 2000 (3 and 2 percent, respectively), but increases in recent years have been significant. From 1999 to 2000, total ED mentions of drugs containing oxycodone increased 68 percent (from 6,429 to 10,825), and mentions of drugs containing hydrocodone increased 31 percent (from 14,639 to 19,221).
As shown in exhibit 10, total hydrocodone ED mentions increased from 10,473 in 1996 to 19,221 (84 percent) in 2000. During the same 4-year period, oxycodone ED mentions increased 239 percent from 3,190 to 10,825.
Exhibit 10. Estimated Number of Hydrocodone and Oxycodone DAWN ED Mentions for Total Coterminous United States: 1996-2000
 SOURCE: Office of Applied Studies, SAMHSA |
While the numbers of hydrocodone and oxycodone ED mentions tended to be small, they have been increasing in most CEWG areas. In 2000, the highest numbers of hydrocodone mentions were reported in Detroit, Dallas, Phoenix, and Atlanta.
3,4-Methylenedioxymethamphetamine (MDMA)
MDMA indicators increased in 16 CEWG areas and remained stable in 5. Use of MDMA continues to spread beyond raves and nightclubs. ED MDMA mentions, though small compared to major drugs, rose in 18 of the 20 CEWG areas included in DAWN.
The spread of MDMA to settings outside the rave and dance club scene is described in several CEWG reports.
Atlanta According to local ethnographic reports, ecstasy use is common among both men and women and among persons younger than 35. Local reports indicate an increase in the use of ecstasy among certain African-American social networks, particularly those connected to a music scene (i.e., clubs). There are a wider variety of settings where MDMA is being used, with people no longer exclusively using in clubs and raves.
Baltimore The Maryland Drug Early Warning System reported that ecstasy was an emerging drug, moving from the club scene to the broader population in Baltimore's suburban counties, but not in Baltimore City. DAWN ED mentions rose from 35 in 1999 to 64 in 2000.
Boston MDMA use was characterized by most contacts as still primarily a White, middle-class phenomenon, partially because of its relatively high cost. However, two sources in Boston reported that its use is increasing among non-White city youth.
Chicago Once limited to the rave scene, ecstasy can be found in most mainstream dance clubs and many house parties, according to ethnographic reports. It continues to be used predominantly by White youth.
Detroit Users are typically college students or young professionals, often in dance settings. Urban areas outside Detroit noted significant ecstasy use, including Kalamazoo, Battle Creek, and Grand Rapids.
Los Angeles According to the Los Angeles Police Department, (LAPD), the use of "club drugs" [such as MDMA] has become increasingly popular in venues other than clubs or raves. More and more people are using in their homes or in other social settings. Law enforcement officials perceive the use of MDMA and GHB (gamma hydroxybutrate) as an increasing threat to the public's health.
Miami Hospital ED visits related to MDMA are increasing and continue to involve predominantly younger White patients. For the first time in 2000, more teens abused ecstasy than cocaine. Hospital data on 49 cases in the first half of 2001 show that most (92 percent) were White non-Hispanics, with 15 percent being in their teens and 71 percent in their twenties.
Minneapolis MDMA abuse by young people in the metropolitan area continued to escalate, no longer limited to rave or nightclub settings. School-based counselors reported emergence of MDMA abuse and rave garb [clothing] among students since the spring of 2000.
New Orleans It was reported that MDMA use has spread to colleges and nearby parishes.
Philadelphia MDMA has become increasingly acceptable among the mainstream population.
St. Louis The rave scene has become popular in St. Louis, where ecstasy is freely available. Most users are teenagers or young adults. Ecstasy use appears to be an even greater problem in Kansas City, according to the DEA. There appear to be two age groups of users: 15-19 and 20-25.
San Diego Expert focus group members reported that they still believed ecstasy would be the next drug epidemic in San Diego. They see use by adolescents and young adults increasing radically.
San Francisco MDMA abuse continues to increase, according to street-based observers.
There is evidence that in some CEWG areas, MDMA users are being admitted to treatment in greater numbers, as indicated in the excerpts below.
Denver Denver area programs are beginning to see a few young clients coming to treatment for MDMA as a primary drug. A survey of 764 clients showed that 35 percent reported lifetime use of ecstasy, with 4.6 percent having used it in the past 30 days. The average age of these users was 17.3 years.
Minneapolis Addiction treatment programs reported a rising number of patients who were heavy MDMA abusers.
Texas Adult admissions for a primary, secondary, or tertiary problem with ecstasy increased from 45 in 1998 to 97 in 1999 to 141 in 2000 to 200 through October 2001. Among adolescents, there were 18 such admissions in 1998, 17 in 1999, 58 in 2000, and 75 through October 2001. Among adults in 2001, 53 percent were referred by the criminal justice or legal system. Among adolescents, 81 percent were referred by the juvenile justice system in 2001.
CEWG representatives from 10 areas also reported on seizures or analyses of samples of MDMA seized. One seizure in San Diego County involved a local clandestine laboratory:
In mid-October 2001, DEA agents raided and seized a major MDMA laboratory in Escondida, a city in north San Diego County, the first and only such lab seized in the United States. [It] was well hidden behind a revolving bookcase. The highly sophisticated laboratory was capable of producing 1.5 million ecstasy tablets a month, with a street value of $20 each.
Gamma Hydroxybutyrate (GHB)
GHB indicators increased in the following 16 CEWG areas:
Boston GHB is significant among club drugs; Massachusetts Poison Control Center continued to report many calls regarding GHB and its precursor, gamma butyrolactone (GBL), involving mostly adolescent and young adult males.
Chicago GHB is used infrequently, mainly by young White males. Recent ED mentions for GHB increased 3 percent, from 135 to 139 in 1999 to 2000. ED mentions per 100,000 population increased 92 percent between 1998 and 1999, from 1.2 to 2.3, but remain unchanged in 2000 (2.3). Compared with other club drugs, overdoses are more frequent with GHB, especially when used in combination with alcohol. GHB use is perceived to be low compared with ecstasy.
Denver GHB is often used in combination with alcohol, making it even more dangerous. During the 1994-98 time period, the Rocky Mountain Poison and Drug Center reported only one to six calls about GHB. However, in 1999, the number jumped to 92. GHB ED mentions also increased from 7 in 1997 to 13 in 1998 to 70 in 1999. However, such mentions dropped to 43 in 2000. DEA reports GHB is increasing in popularity in Colorado and is readily available at raves, nightclubs, strip clubs, and private parties. A northeast treatment program stated that some of their young clients have said they think GHB is dangerous and can 'kill them.'
Los Angeles ED mentions of GHB increased 15 percent from 1999 to 2000. According to the LAPD, the use of club drugs has become increasingly popular in venues other than clubs or raves. The use of the Internet to purchase precursor chemicals has increased. Law enforcement officials perceive the use of MDMA and GHB as an increasing threat to the public's health.
Miami GHB is a commonly abused substance in South Florida. This drug has become popular at raves and other parties, is commonly mixed with alcohol, has been implicated in drug rapes and other crimes, has a short duration of action, and is not easily detectable on routine hospital toxicology screens. During the first 6 months of 2001, Broward General Medical Center ED treated 32 people with GHB or GHB precursor overdose and 2 GHB withdrawal cases. There were 77 cases in all of 2000. In virtually every GHB overdose case during the first half of 2001, the reason for the ED visit was decreased responsiveness or coma usually lasting less than 3 hours. Products containing1,4 butanediol (1,4 BD) are sold in health food stores; artfully worded labels often say that this product does not contain GHB. In addition, these labels may state that this product is a cleaner and that it is harmful if swallowed.
Minneapolis/St. Paul From 1999 to 2000, ED episodes for GHB rose from 33 to 93, accounting for more ED episodes than any other club drug in the metropolitan area. Because becoming unarousable is part of the GHB experience, some people mark the palm of their hand with a large letter 'G' to indicate they are using GHB, so that if they are found unconscious, their friends needn't call 911 because they would soon regain consciousness. Addiction treatment programs reported a growing number of patients presenting with GHB addiction who exhibited physical dependence, tolerance, and withdrawal. A typical scenario after several months of use is a compulsion to dose with GHB every 3 hours at the risk of experiencing severe withdrawal symptoms. Despite recent State and Federal laws targeting GHB, GBL, and 1,4 BD, it is still possible to purchase products that contain these chemicals on the Internet.
Newark GHB and ketamine are believed to be used at rave parties around college campuses. According to DAWN data, there were 7 GHB ED mentions and 14 ketamine ED mentions in 1999. In 2000, the corresponding numbers were only five and nine, respectively. Data from the 2001 Middle School Substance Use Survey show that 2.4 percent of 7th- and 8th-grade students reported lifetime use of club drugs, including ecstasy, GHB, and ketamine.
New York City Another club drug of concern is GHB, and while DAWN ED mentions for GHB in the city are very small, there was a marked increase to 31 mentions in 2000, up from 16 in 1999 and 5 in 1998.
Philadelphia GHB was mentioned in 53 DAWN ED cases in 1999 and 79 in 2000. Prior to 1999 GHB cases were either nonexistent or did not meet DAWN's standard of precision.
Phoenix Reported prices for GHB were $5-$10 for one dose (1 teaspoon), $425 for 25 pounds, $3,200 for a 55-gallon drum wholesale, and $4,300 for a 55-gallon drum retail.
St. Louis GHB use has increased in the St. Louis area. Because it is a depressant, its use with alcohol and its unpredictable purity present users with major health risks. Five deaths were reported in Missouri, and two near-deaths recently in St. Charles County when GHB was used as a "date-rape" drug.
San Diego Other drugs that were frequently in the news in 2000 were ecstasy, GHB, and ketamine. These drugs were regularly spotted in raves, and law enforcement was aware that ecstasy, GHB, and LSD were easily obtained by adolescents and young adults.
San Francisco GHB and ketamine each had the highest-ever ED mentions in 2000, the most recent period of observation. The actual number of club drug mentions remains small, however, compared with cocaine or methamphetamine.
Seattle ED mentions of GHB increased by 67.8 percent between 1999 and 2000. However, MDMA and GHB each constitute less than 1 percent of total ED mentions. No deaths involving GHB were reported during first half of 2001. Mixing club drugs together either all at once or over several hours also seems to be gaining popularity.
Texas Texas Poison Control Centers reported 100 confirmed exposures to GHB, GBL, and 1,4 BD in 1998, compared with 166 in 1999, 154 in 2000, and 108 through the third quarter of 2001. ED mentions for GHB peaked in 2000, when the rate was 3 per 100,000 population. Clients with a primary, secondary, or tertiary problem with GHB, GBL, or 1,4 BD are being seen in treatment. In 1999, 17 adults were admitted; in 2000, 12; and in 2001 to date, 15. The DEA reports GHB is becoming more available because of the ease of converting GBL into GHB. More labs are being seized in 2001 than in prior years.
Two areas (Minneapolis/St. Paul and Texas) reported increases in treatment admissions for GHB.
The CEWG areas with the highest estimated numbers of GHB ED mentions in 2000 included Dallas (169), San Francisco (151), Los Angeles (149), Chicago (139), Atlanta (129), and Minneapolis (93). The highest percentage increase in GHB mentions between 1999 and 2000 was in Minneapolis (182 percent).
Phencyclidine (PCP)
Across the 20 CEWG areas included in DAWN, rates of PCP mentions per 100,000 population increased in 10, decreased in 2, and remained stable in 8. In 10 areas in 2000, rates were less than 3 per 100,000 population. Rates were highest in Chicago where they rose from 10.6 to 16.6 from 1999 to 2000. Rates in 2000 were also relatively high in Philadelphia (12.4), Los Angeles (9.5), and Washington, D.C. (8.1). In most CEWG sites treatment admissions for primary abuse of PCP accounted for less than 1 percent of total admissions, and few arrestees in the ADAM program tested positive for PCP. The exception in ADAM is Washington, D.C., where approximately 14-15 percent of adults and juveniles tested positive for PCP in the second and third quarters of 2001, nearly doubling from the first quarter of 2000.
Lysergic Acid Diethylamide (LSD)
While indicators of LSD are low, abuse of this drug continues to be reported in several CEWG areas and the trends are mixed. According to ethnographic data, the drug's availability ranges from "readily available" in Phoenix to "not easy to find" in Washington, D.C. Additionally, ethnographic and focus group reports indicate that LSD remains popular in Atlanta and Boston, but is becoming less popular in Miami. The number of ED mentions, which declined in eight areas and remained stable in two, may point to decreased use. In two areas, clubgoers reportedly mix LSD with ecstasy, a practice called "candy-flipping" in Washington, D.C., and Baltimore.
Dextromethorphan (DXM)
DXM, a substance found in over-the-counter (OTC) cough and cold medications, was identified as a drug of abuse among adolescents in the following five CEWG areas:
Denver A Denver area program reported that its younger clients say DXM is very popular, but it has not yet shown up as a primary drug of abuse. Program personnel stated that adolescents steal Coricidin HBP, which contains 30 milligrams of DXM, from pharmacies and 'eat 6-12 pills' at a time.
Detroit Intentional abuse of Coricidin HBP (an OTC cold and flu medicine) is increasing in case reports to Children's Hospital of Michigan. These tablets contain DXM. Multiple tablets are taken for a dissociative effect; use of up to 40 pills at 1 time has been reported. During 2000, 44 cases were reported, while in the first 10 months of 2001 there have been at least 52 cases involving this drug.
Minneapolis/St. Paul School-based counselors reported the intermittent abuse of DXM, which is sold as a powder or in clear capsules for $5. Hennepin Regional Poison Center received 62 calls regarding exposures to products containing DXM through October 2001.
Seattle During the first half of 2001, three deaths involved DXM, an increasingly popular club drug with particularly dangerous interactions when used in combination with other drugs, especially alcohol. This new appearance of DXM in medical examiner reports (substantiated by anecdotal reports) may highlight the increasing popularity of DXM (especially in cough syrup form) over the past year.
Texas School personnel in Texas are reporting problems with the abuse of DXM, especially the use of Robitussin-DM, Tussin, and Coricidin Cough and Cold Tablets HBP. These substances can be purchased over the counter, and if taken in large quantities can produce hallucinogenic effects. Poison control centers reported 433 confirmed exposures to Coricidin in 2000, and 188 through three quarters of 2001. Department of Public Safety labs examined 12 substances in 1999 that were DXM, 34 in 2000, and 6 through October 2001.
During the first half of 2001, data were gathered from 5,905 patients in government treatment centers (GTCs) and 5,536 patients in nongovernment treatment centers (NGCs). In both types of facilities, cocaine was the drug most likely to be used currently (42.6 percent of GTC and 30.5 percent of NGC patients). Marijuana was the second most frequently reported current drug of abuse among GTC patients (20.0 percent) and ranked third among NGC patients (14.9 percent). Heroin was reported as a current drug of abuse by 17.5 percent of NGC patients but only 2.2 percent of GTC patients. Inhalants accounted for 11.7 percent of current drug reports among NGC patients. Approximately 90 percent of patients in both types of facilities were male and the majority used more than one drug.
The sources used by DEA to assess the trafficking of MDMA in the United States were reviewed by an official of DEA's Office of Diversion Control. These included the System to Retrieve Information on Drug Evidence (STRIDE); United States Customs Service reports; NFLIS; and the DEA Source Determination Program.
DEA drug testing laboratories are located in seven CEWG areas: Miami, New York City, Washington, D.C., Chicago, Dallas, San Francisco, and San Diego. In addition, a special testing and research lab is located in Chantilly, Virginia. Through the first 11 months of 2001, approximately 2,700 MDMA exhibits have been analyzed by STRIDE.
Based on STRIDE data, Florida, New York, and California are the highest MDMA trafficking areas in the United States. Other States that have significant MDMA trafficking include New Jersey, Illinois, Georgia, Texas, Massachusetts, Virginia, and Washington, D.C. The United States Customs Service has been seizing more MDMA tablets each year: 400,000 in 1997, 750,000 in 1998, 3,500,000 in 1999, and 9,300,000 in 2000. At NFLIS, 5,882 MDMA exhibits were encountered in 2000 and 3,610 through November 2001.
The DEA Source Determination Program analysis of MDMA samples in 2000 showed that 12 percent of the samples contained amphetamine or methamphetamine, but not MDMA; 5 percent contained no controlled substances; and 3 percent were determined to be other substances, but were sold as ecstasy.
In 2000, 3,346,071 MDMA tablets were analyzed in DEA labs. The average dose was 87 milligrams. Tablets believed to be MDMA were often found to contain other substances including caffeine, ephedrine, dextromethorphan, and diphenhydramine (an OTC antihistamine).
In 2000, 63 percent of MDMA tablets were smuggled into the United States by airline, 27 percent by express mail, and 10 percent by shipping. The departure points for MDMA smuggled into the country were the Netherlands (77 percent), France (9 percent), Belgium (8 percent), Germany (3 percent), and Spain (3 percent).