 |
 |
|
|
|
|
Fall 2008 [Number 242]
|
||
Titan Technical Corner – Distributing SAS Reports & Graphs via EmailDisclaimer: The following article regarding SAS is intended solely as educational and informative material from one federal entity to other interested federal users. Discussion of SAS does not constitute a commercial endorsement. Since its inception in 1976, SAS has been at the forefront of providing a software architecture that enables organizations to integrate, manage, and analyze data, allowing them to better deploy information across the enterprise. SAS can be used to analyze data from disparate sources to identify problems, recognize opportunities, and provide predictive insights. This can be done via a variety of reporting and visualization tools including preformatted reports, dashboards, scorecards, charts, and other graphical techniques. Due to the IT industry’s trend toward server consolidation, SAS Institute has retained the option of using mainframes like Titan as a key platform for running its data analysis and reporting software. This is especially true for mission-critical, high-volume environments where data security, integrity, backup, and recovery are cardinal issues. The remainder of this article will focus on explaining how Titan SAS programmers can use email to move their systems forward into 21st century techniques simply by using SAS to generate a chart that can be emailed via SMTP using standard Titan Batch JCL processing. Using email to distribute SAS reports For purposes of illustration, the SAS program presented in this article parses Titan performance data and generates a chart showing the number of jobs processed by users for a generic sample account "ZZZZ." The report is then distributed to interested parties via email in the following format: 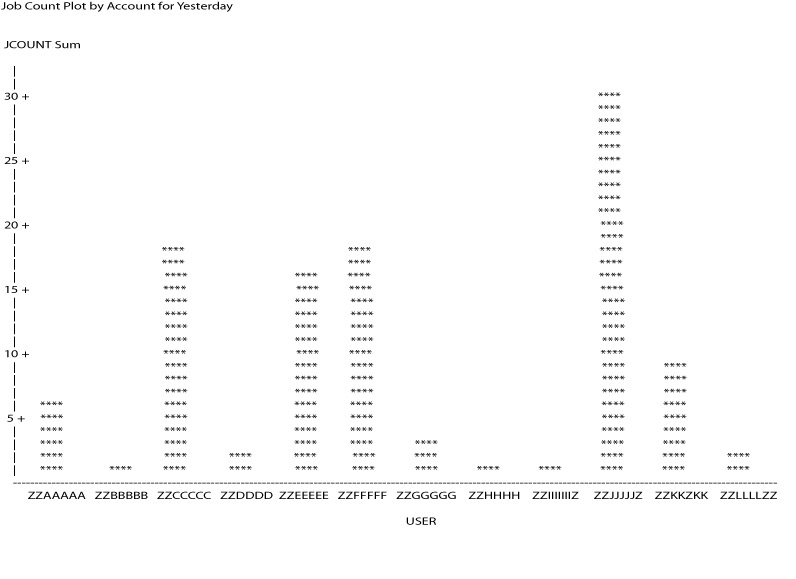
SAS basics and ODS One of the most significant developments in version 7 of SAS was the inclusion of the Output Delivery System, or ODS (originally pronounced ‘odious’ but now pronounced ‘ya gotta love it’). Greatly enhanced in versions 8 and 9, ODS allows SAS users to create customized versions of output in a variety of destinations (including HTML, RTF, XML, and PDF) instead of being limited to traditional line-listing printouts. In our example SAS program, the FILENAME keyword statement defines "OUTBOX" that will be written to as an EMAIL file. Users can specify additional options defining "FROM," "TO," "CC," "REPLYTO," and "SUBJECT" and the file content is defined as TEXT/HTML. FILENAME OUTBOX EMAIL TO = (‘DOE@MAIL.NIH.GOV’) REPLYTO = (‘DOE@MAIL.NIH.GOV’) TYPE = ‘TEXT/HTML’ SUBJECT = ‘ Job Executions for ZZZZ for Yesterday’; SAS programs consist of two basic building blocks – ‘DATA steps’ and ‘PROC steps.’ A typical program starts with a DATA step that reads external Titan data files and creates a SAS table. A SAS program then typically passes the SAS table to a PROC step for processing. In general, DATA steps read and modify data, while PROC steps analyze and summarize data, perform utility functions, or print reports. SAS data sets Before analyzing or reporting data in SAS, SAS needs to read your data from an external source and convert it into a SAS table. Getting your data into a SAS table is usually the first step in creating a SAS program. SAS is quite flexible and can read almost any data including Titan sequential files, DB2 tables, and Excel spreadsheets uploaded to Titan. Once your data has been read into a SAS table, SAS keeps track of what is in the table and where it is located. In SAS terminology, tables consist of observations and variables. Adopting the terminology of DB2 and other relational databases, SAS data sets are also called tables, observations are called rows, and variables are called columns. In our example program, a Titan performance data set containing job accounting data is read to create a SAS table named BATCH. In this example each row in the BATCH table represents a job submitted by account ZZZZ.
	DATA BATCH   (KEEP = JOB ACCOUNT USER DATEX);
	INFILE SMFDATA;     /*SMFDATA is DD Name of Performance Dataset */
	/* The following defines input layout of SMFDATA  */
	INPUT   @2  SMFRTYPE  PIB1.   	    /* SMF Record Type */
                @3  ENDTS    SMFSTAMP8.   /* Date and Time of Job */
	       +4   WID	$CHAR4.      /* Work Indicator (STC/TSO/BAT)
	            SUBTYPE PIB2.	       /* SMF Record Subtype  */
                @; 		/* Keep column pointer ‘@ ‘ after SUBTYP */
	DATEX = DATEPART(ENDTS);  	 /*  Strip off the Date for this report */

 	/*Parse the data to consider only SMF Record type 30 subtype record 5 – there is one record per 				    job */
	IF WID=:’STC’ OR WID=:’TS’ THEN DELETE; /* Don’t include started tasks or tso */
	IF (SMFRTYPE = 30 AND SUBTYPE =5) THEN GOTO KEEPIT;
	ELSE DELETE;
	KEEPIT:
	/*JOBPTR points to job related data in this record */
	INPUT   +8  (JOBPTR  JOBLEN JOBSEG) (PIB4. PIB2. PIB2.) @;
	JOBPTR = JOBPTR-3;     /* Adjust job data pointer for batch jobs */
	INPUT    @JOBPTR   JOB	 $CHAR8.  /* Job name */
		     PROGRAM   $CHAR8.  /* Program Executed */
		+40  INITTM    SMFSTAMP8. /* (Date time job was initiated */
		      RDRTS    SMFSTAMP8. /* Date time reader started job */
		      RDREND   SMFSTAMP8. /* Date time reader finished reading */
		      JOBPRGNM  $CHAR20    /* Programmer Name from job card */
		      ACCOUNT   $CHAR4.    /* Account from RACF */
		 +4   USER      $CHAR8.    /* RACF Userid  */
	IF ACCOUNT = ‘ZZZZ’ THEN OUTPUT BATCH;  /* Analyze jobs from account ‘ZZZZ’ */
	ELSE DELETE;
SAS PROCs We next use the SAS ‘PROC SORT’ to sort the BATCH table by RACF user. We then will use the sorted table to total the number of jobs submitted by each user for account ZZZZ: PROC SORT DATA=BATCH; BY USER; /* Create SAS table SUMMARY – this table will have one row per user in account ZZZZ */ /* representing the number of times each user in the account submitted a job for yesterday */ DATA SUMMARY (KEEP = DATEX ACCOUNT USER JOBCOUNT); SET BATCH; BY USER; IF FIRST.USER THEN DO; /* SET JOBCOUNT TO 0 AT THE START FOR EACH USER */ JOBCOUNT = 0; END; JOBCOUNT+1; /* FOR EACH RECORD FOR EACH USER ADD 1 TO JOBCOUNT */ IF LAST.USER THEN OUTPUT SUMMARY; /* The following SORT proc orders the SUMMARY USER table by descending JOBCOUNTS */ PROC SORT DATA=SUMMARY; BY DESCENDING JOBCOUNT; At this point we are ready to present the results of our analysis as a report. There are many SAS procedures that can be used to present data including PROC PRINT, PROC FREQ, and many others. PROC CHART has been chosen to present the number of jobs by userid for account ZZZZ. In addition we wish to present this report as an HTML email that can be presented to any outlook email recipient: /* Tell OUTPUT DELIVERY SYSTEM to stop generate reports as listings */ ODS LISTING CLOSE; /* The following statements tell PROC CHART to generate HTML output to OUTBOX filename for email */ ODS HTML BODY=OUTBOX RS=NONE; PROC CHART; VBAR USER / SUMVAR=JOBCOUNT DISCRETE; TITLE ‘Job Counts by User for Account ZZZZ for &SYSDATE9’ ; RUN; ODS HTML CLOSE; The SAS program is now ready to be saved as a file on Titan and then executed as a batch job - either as a test job or as a production job scheduled by using WEB submit or CA-7. The following Batch JCL can be submitted to Titan, and once the job is completed, email will be sent via SMTP to the recipient list specified in the program: //SASMAIL1 JOB ,'TITAN SAS JOB',CLASS=X,MSGCLASS=H //SAS1 EXEC SAS //SMFDATA DD DSN=NIH.SMFSTD.DAILY.D080911,DISP=SHR //SYSIN DD DSN=NIH. SAS.DEMO.SOURCE (BATMAIL1),DISP=SHR Conclusions A simple Titan job can be easily used to generate and email reports, charts, and graphs with SAS Output Delivery System. You can easily email the reports to specific individuals immediately upon compilation of the report, eliminating lost and misrouted printed reports, saving print costs, and improving the ease of use for managers and technicians in reviewing large numbers of analytic reports. For more information on using this technology, please visit the NIH Help Desk website (http://ithelpdesk.nih.gov/support) or call 301-496-4357, 301-496-8294 (TTY) or toll free at 866-319-4357. |
||
| Published by Center for Information Technology, National Institutes of Health |
| Interface Comments |
Accessibility |