|
| |
Environmental Quality Incentives Program FY-2004 Payment Information
Updated
07/22/2005
These ten maps display information on payments made by USDA during fiscal
year 2004 for conservation practices implemented through the Environmental
Quality Incentives Program (EQIP). The program addresses both local natural
resource needs and national resource priorities.
The payments help reimburse farmers and ranchers for installing conservation
practices to improve animal waste management, irrigation water management,
grazing land, soil erosion and sediment control, and other environmental
concerns. Click on each map’s Data link for detailed
information.
The data tables are available in Adobe
Acrobat format. Adobe
Acrobat format.
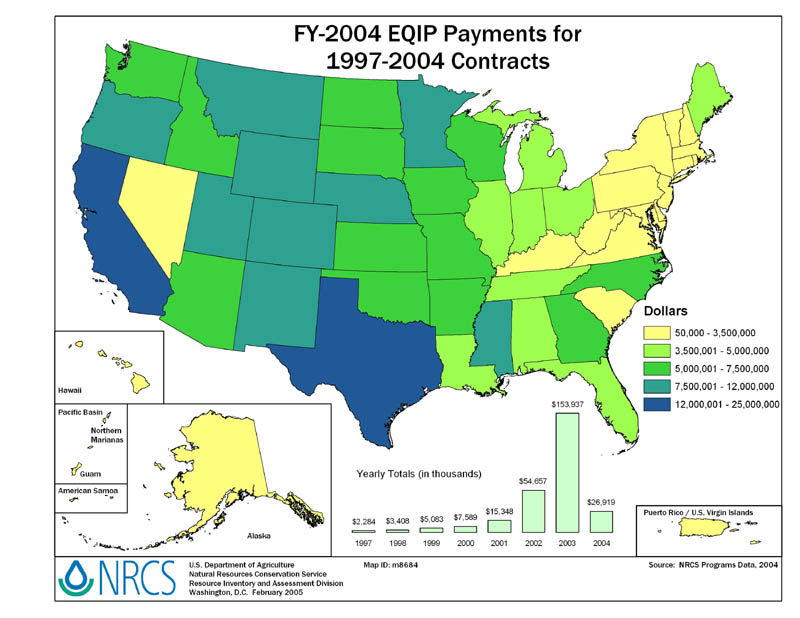
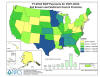
Payments for 1997-2004 Contracts
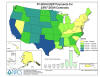
Click on map to enlarge.
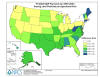
This map shows the amount of EQIP funds paid to
agricultural producers for conservation practices completed in FY-2004
under 1997-2004 EQIP contracts, by state.
The graph in green shows the amount of EQIP funds paid to agricultural
producers for conservation practices completed in FY-2004 under
1997-2004 EQIP contracts, by contract year.
Supporting
data by State available in tabular format
|
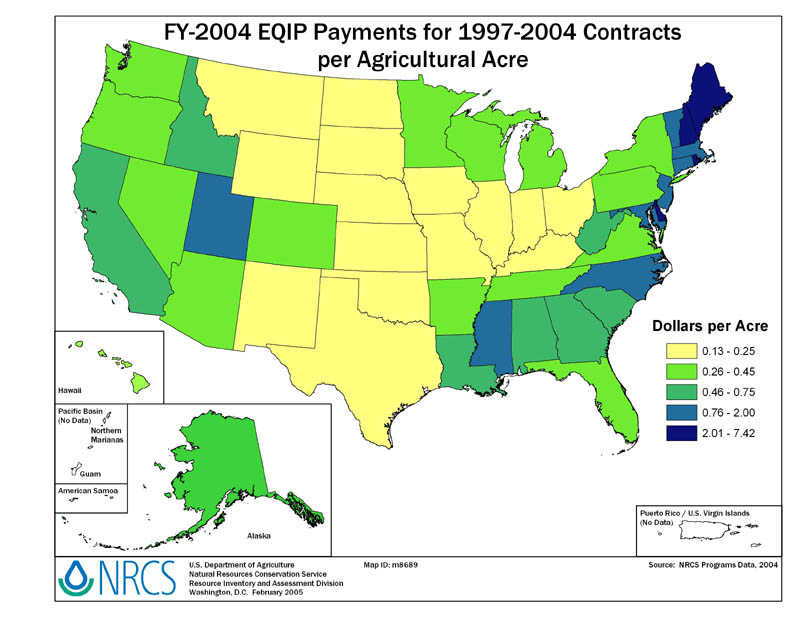
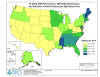
Payments for 1997-2004 Contracts per Agricultural Acre
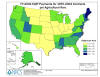
Click on map to enlarge.
This map shows the amount of EQIP funds paid to agricultural producers for conservation practices
completed in FY-2004 under 1997-2004 EQIP contracts per acre of agricultural land, by state.
Supporting data by State available in tabular format
|
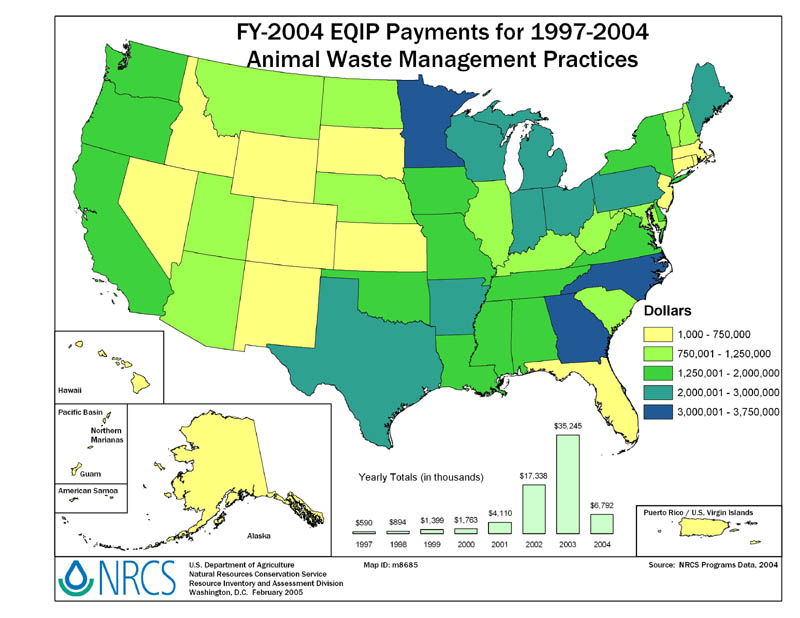
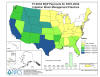
Payments for Animal Waste Management Practices
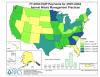
Click on map to enlarge.
This map shows the amount of EQIP funds paid to
agricultural producers for conservation practices that address animal
waste management that were completed in FY-2004 under 1997-2004 EQIP
contracts, by state.
The graph in green shows the
amount of EQIP funds paid to agricultural producers for conservation
practices that address animal waste management that were completed in
FY-2004 under 1997-2004 EQIP contracts, by contract year.
Supporting data by State available in tabular format
|
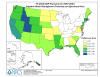
Payments for Animal Waste Management Practices per Agricultural Acre
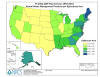
Click on map to enlarge.
This map shows the amount of EQIP funds paid to
agricultural producers for conservation practices that address animal
waste management that were completed in FY-2004 under 1997-2004 EQIP
contracts per acre of agricultural land, by state.
Supporting data by State available in tabular format
|
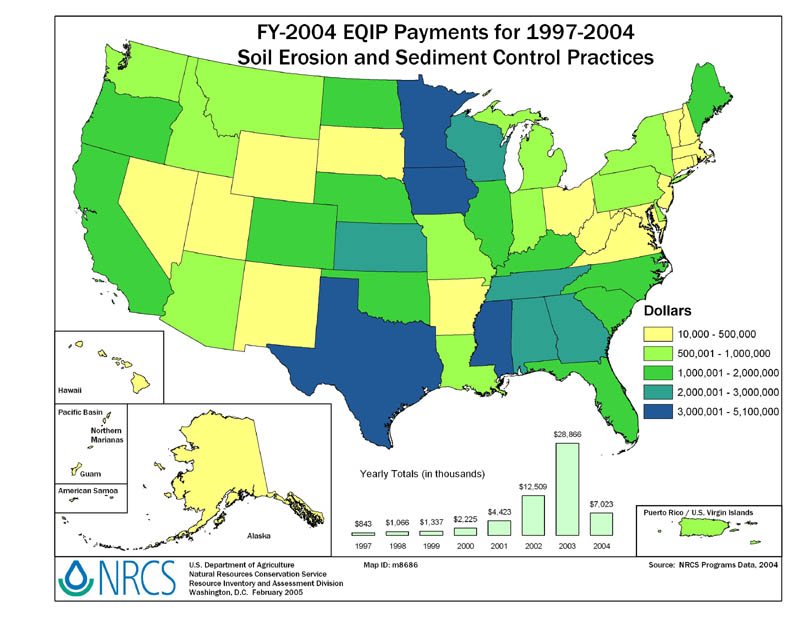
Payments for Soil Erosion and Sediment Control Practices
Click on map to enlarge.
This map shows the amount of EQIP funds paid to agricultural producers for
conservation practices that address soil
erosion and sediment that were completed in FY-2004 under 1997-2004 EQIP
contracts, by state.
The graph in green shows the amount of EQIP funds paid to agricultural
producers for conservation practices that address soil erosion and sediment
that were completed in FY-2004 under 1997-2004 EQIP contracts, by contract year.
Supporting data by State available in tabular format
|
Payments for Soil Erosion and Sediment Control Practices per Agricultural Acre
Click on map to enlarge.
This map shows the amount of EQIP funds paid to agricultural producers for conservation
practices that address soil erosion and sediment that were completed in
FY-2004 under 1997-2004 EQIP contracts per acre of agricultural land, by state.
Supporting data by State available in tabular format
|
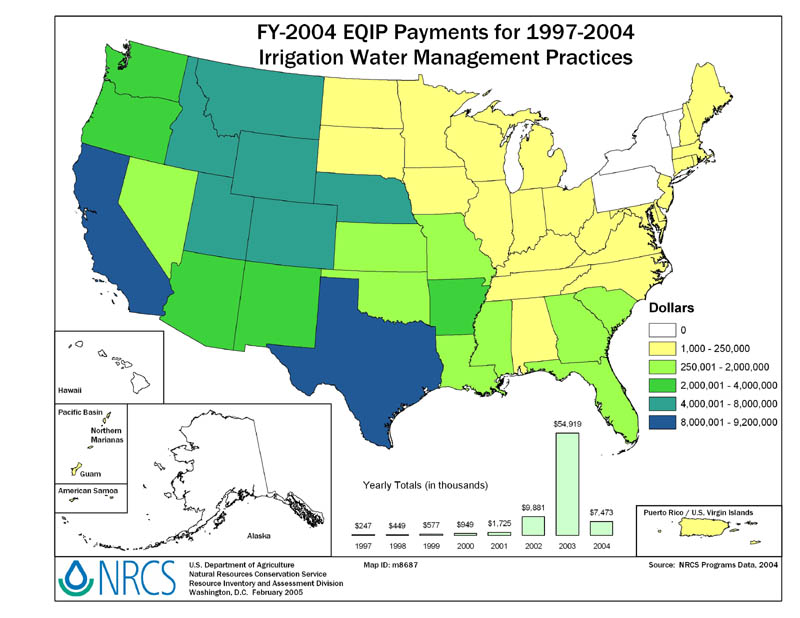
Payments for Irrigation Water Management Practices
Click on map to enlarge.
This map shows the amount of EQIP funds paid to
agricultural producers for conservation practices that address irrigation
water management that were completed in FY-2004 under 1997-2004 EQIP
contracts, by state.
The graph in green shows the
amount of EQIP funds paid to agricultural producers for conservation
practices that address irrigation water management that were completed in
FY-2004 under 1997-2004 EQIP contracts, by contract year.
Supporting data by State available in tabular format
|
Payments for Irrigation Water Management Practices per Agricultural Acre
Click on map to enlarge.
This map shows the amount of EQIP funds paid to
agricultural producers for conservation practices that address irrigation
water management that were completed in FY-2004 under 1997-2004 EQIP
contracts per acre of agricultural land, by state.
Supporting data by State available in tabular format
|
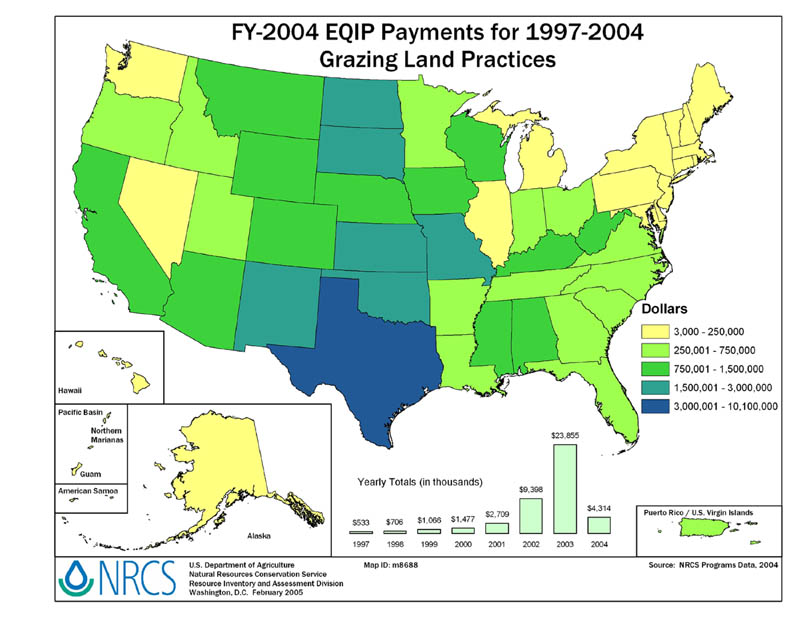
Payments for Grazing Land Practices

Click on map to enlarge.
This map shows the amount of EQIP funds paid to agricultural producers for conservation practices to
improve grazing land that were completed in FY-2004 under 1997-2004 EQIP
contracts, by state.
The graph in green shows the amount of EQIP
funds paid to agricultural producers for conservation practices to improve
grazing land that were completed in FY-2004 under 1997-2004 EQIP
contracts, by contract year.
Supporting data by State available in tabular format
|
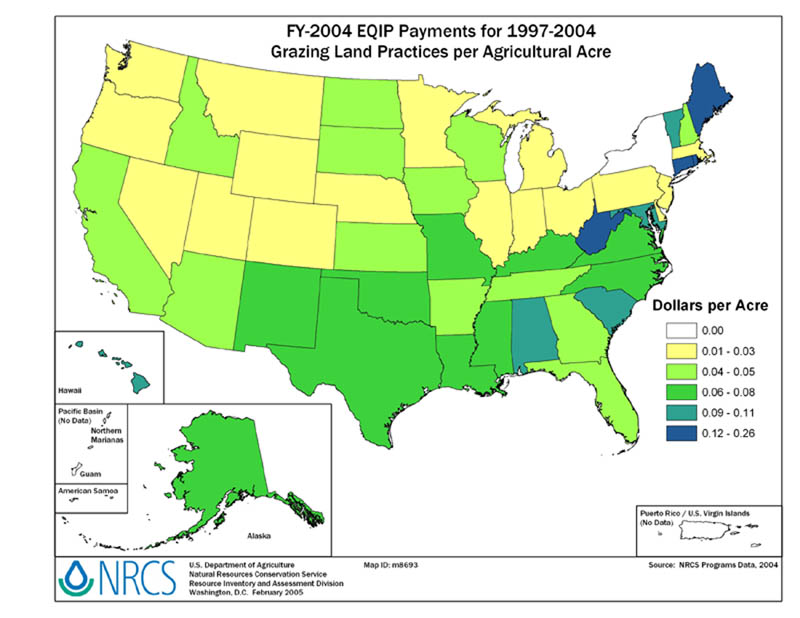
Payments for Grazing Land Practices per Agricultural Acre
Click on map to enlarge.
This map shows the amount of EQIP funds paid to
agricultural producers for conservation practices to improve grazing land
that were completed in FY-2004 under 1997-2004 EQIP contracts per acre of
agricultural land, by state.
Supporting data by State available in tabular format
|
Program Contact
Edward Brzostek, EQIP Program
Specialist, 202-720-1834
< Back to Environmental Quality Incentives Program
| | |