
Electricians
Fatal Injuries
How did the fatal occupational injury rates for electricians compare with those for all construction workers during 1992–2001?
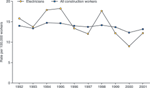 | Figure 4-35 Fatal occupational injury rates for electricians and all construction workers, 1992-2001. Fatal occupational injury rates for electricians during 1992-2001 were comparable with those for all construction workers. Rates for electricians showed an up-and-down decreasing pattern, from 18.3 per 100,000 full-time workers in 1995 to 9.0 in 2000. BLS reported 671 fatal occupational injuries among electricians during this 10-year period-an average of 67 fatalities per year. (Sources: BLS [2002b,c]; Pollack and Chowdhury [2001]; Chowdhury and Dong [2003].) |
Nonfatal Injuries and Illnesses
How did the rates of nonfatal occupational injuries and illnesses for electricians compare with those for all construction workers during 1992–2001?
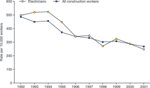 | Figure 4-36 Rates of nonfatal occupational injuries and illnesses involving days away from work for electricians and all construction workers, 1992-2001. During 1992-2001, rates of nonfatal occupational injuries and illnesses involving days away from work for electricians were slightly higher but comparable with those for all construction workers. Rates for electricians showed a downward trend, from 522 per 10,000 full-time workers in 1994 to 246 in 2001. BLS reported 142,811 nonfatal occupational injuries and illnesses among electricians during this 10-year period-an average of 14,281 nonfatal cases per year. (Sources: BLS [2002c; 2003b]; Pollack and Chowdhury [2001]; Dong et al. [2004].) |