|
|
 |
How To... - Interpret Data - Case Studies - Low
Birthweight
Where: Where do the highest or lowest prevalence of low birthweight occur?
Surveillance data are analyzed by place to determine where health
problems are occurring in a population. PNSS Table 8B (county level),
Comparison of Infant Health Indicators, provides a ranked comparison of
low birthweight prevalence by county. Data can be examined to determine
where the prevalence of low birthweight is lowest and highest.
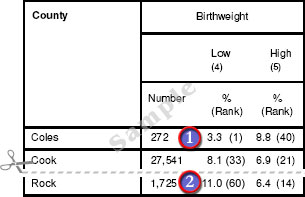
Sample: PNSS Table 8B, Comparison of Infant Health Indicators
 |
Coles county had a prevalence of 3.3% and was ranked
as 1st or a rank of (1) with the lowest prevalence of low birthweight infants in
the state. |
 |
Rock county had a prevalence of low birthweight of
11.0 and was ranked 60th or a rank of (60) with the highest or worst prevalence
in the state. Rock county is more than twice the Healthy People 2010
target of 5 percent for low birthweight. |
Where does the highest prevalence of low birthweight occur?
The worst (highest) prevalence of low birthweight in the state was 11 %
in Rock county. The prevalence of low birthweight in Rock county is more
than twice the Healthy People 2010 target of 5 percent.
back to top
|
|