|
|
 |
How To... - Interpret Data - Case Studies - Low
Birthweight
When: Is low birthweight increasing or decreasing over time?
The PNSS Table 19C, Summary of Trends in Infant Health Indicators,
provides trends of low birthweight and high birthweight for all years that the contributor has
participated in PNSS. This table can be used to look at recent changes in
the prevalence of low birthweight by comparing the prevalence in 2002 with
the previous year and it can be used to look at changes that have occurred
over longer periods.
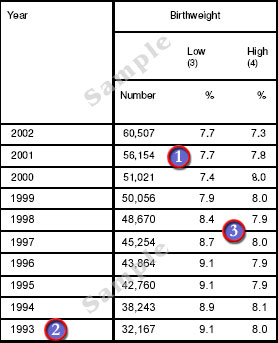
Sample: PNSS Table 19C, Summary of Trends in Infant Health Indicators
 |
The prevalence of low birthweight remained the same at
7.7% from 2001 to 2002. |
 |
The first year of data available was 1993. |
 |
The prevalence of low birthweight infants decreased
slightly from 9.1% in 1993 to 7.7% in 2002. The percentage decrease or
relative decrease during this time period is 18% ((9.1 minus 7.7)/7.7 =
0.18 x 100 = 18 %). |
This line chart, derived from Table 19C, shows a slight decrease in the
prevalence of infants who were low birthweight between 1993 and 2002.
|
Trends in prevalence of low birthweight *
* Low Birthweight includes VLBW < 1500 g and LBW = 1500-<2500 g. |
When? Is low birthweight increasing or decreasing over time?
The prevalence of low birthweight has decreased slightly from 1993 and
2002. The relative decrease during this time period was 18%.
back to top
|
|