SeaWiFS Biosphere Data over the North Atlantic
|
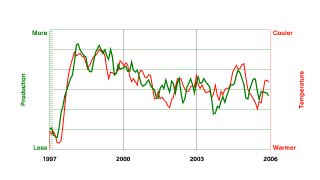
The SeaWiFS instrument aboard the Seastar satellite has been collecting ocean data since 1997. A check up of the Earth's planetary health reveals that the lowest rung in the ocean food chain is shrinking. For the past 20 years (early 1980s to present), phytoplankton concentrations declined as much as 30 percent in northern oceans. Scientists from NASA, the National Oceanic and Atmospheric Administration (NOAA), and Oregon State University say warmer ocean temperatures and low winds may be depriving the tiny ocean plants of necessary nutrients. However, they still do not know if the loss of phytoplankton is a long-term trend or a climate oscillation. Scientists can monitor ocean and planetary health through phytoplankton. Since the whole ocean food chain depends on the health and productivity of phytoplankton, a significant change could indicate a shift in our climate. Phytoplankton consists of many diverse species of microscopic free-floating ocean plants that form the base of the ocean's food chain. These plants thrive on sunlight and nutrients. Limit either one and phytoplankton will not grow. This animation shows the Multivariate ENSO Index (MEI) in red and the net primary production NPP anomaly in units of Tgrams carbon per month in green. The MEI is a multivariate index that incorporates sea level pressure, surface zonal and meridional wind components, sea surface temperature, surface air temperature, and cloudiness (Wolter and Timlin, 1998). The MEI index is calculated for the tropical Pacific (i.e., between 10 degrees North and 10 degrees South, from Asia to the Americas) with units of kg m-3. The Net Primary Production (NPP) data was generated from the Vertically Generalized Production Model (VGPM). The VGPM data set is available at the following URL: http://web.science.oregonstate.eduocean.productivity/ . As the sea surface temperature warms, the production levels decrease.
|
|
|
|
This animation show the MEI in red and then the Ocean Net Primary Production (NPP) levels in green.
Duration: 3.7 seconds
Available formats:
1280x720
TIFF
3 MB
1280x720 (60 fps)
Frames
320x180
PNG
14 KB
160x80
PNG
6 KB
80x40
PNG
3 KB
512x288 (29.97 fps)
MPEG-1
913 KB
512x288 (60 fps)
MPEG-4
33 KB
How to play our movies
|
|

|
|
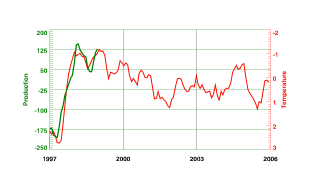
This animation shows the same data with the numeric values labeled.
Duration: 3.7 seconds
Available formats:
1280x720
TIFF
3 MB
1280x720 (60 fps)
Frames
320x180
PNG
15 KB
512x288 (29.97 fps)
MPEG-1
913 KB
512x288 (60 fps)
MPEG-4
34 KB
How to play our movies
|
|

|
|
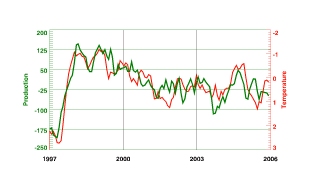
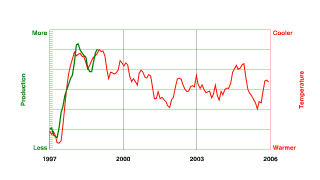
The 1997-1998 El Nino event caused significant temperature and production changes.
Available formats:
1280 x 720
TIFF
3 MB
320 x 180
PNG
11 KB
|
|
|
|
The 1997-1998 El Nino event caused significant temperature and production changes.
Available formats:
1280 x 720
TIFF
3 MB
320 x 180
PNG
12 KB
|
|
|
Back to Top
|

