SeaWiFS Biosphere Global Rotation from 1997 to 2006
|
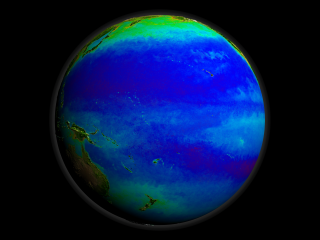
The SeaWiFS instrument aboard the Seastar satellite has been collecting ocean data since 1997. By monitoring the color of reflected light via satellite, scientists can determine how successfully plant life is photosynthesizing. A measurement of photosynthesis is essentially a measurement of successful growth, and growth means successful use of ambient carbon. This animation represents nearly a decade's worth of data taken by the SeaWiFS instrument, showing the abundance of life in the sea. Dark blue represents warmer areas where there is little life due to lack of nutrients, and greens and reds represent cooler nutrient-rich areas. The nutrient-rich areas include coastal regions where cold water rises from the sea floor bringing nutrients along and areas at the mouths of rivers where the rivers have brought nutrients into the ocean from the land.
|
|

|
|
Animation of a rotating globe showing nearly a decade's worth of SeaWiFS data from 1997 to 2006.
Duration: 54.0 seconds
Available formats:
1280x720 (59.94 fps)
Frames
1280x720 (60 fps)
MPEG-4
45 MB
320x180
PNG
110 KB
720x480 (60 fps)
MPEG-2
117 MB
640x480 (60 fps)
MPEG-1
109 MB
320x240 (60 fps)
MPEG-1
24 MB
How to play our movies
|
|
|
|
Print resolution SeaWiFS data of the Pacific Ocean.
Available formats:
2560 x 1920
TIFF
3 MB
320 x 240
PNG
194 KB
|
|
|
|
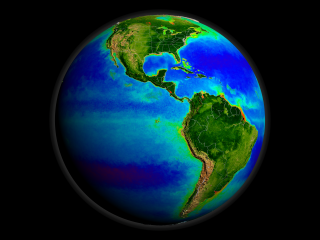
Print resolution SeaWiFS data over North and South America.
Available formats:
2560 x 1920
TIFF
4 MB
320 x 240
PNG
195 KB
|
|
|
|
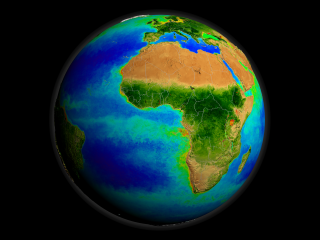
Print resolution SeaWiFS data over Europe and Africa.
Available formats:
2560 x 1920
TIFF
4 MB
320 x 240
PNG
199 KB
|
|
|
|
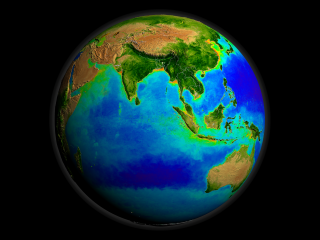
Print resolution SeaWiFS data over Asia and Australia.
Available formats:
2560 x 1920
TIFF
4 MB
320 x 240
PNG
197 KB
160 x 80
PNG
49 KB
80 x 40
PNG
18 KB
|
|
|
Back to Top
|

