RENEWABLE FUELS MODULE
![]()
The renewable fuels module (RFM) consists of five submodules that represent the various types of renewable energy technologies used for grid-connected U.S. electricity supply (Figure 11). Since most renewables (wind, solar, and geothermal) are used to generate electricity, the interaction with the electricity market module (EMM) is important for modeling grid-connected renewable-electric applications. In the current version of the RFM, only central station grid-connected applications are modeled endogenously; data on distributed applications are input exogenously. Off-grid applications are not represented. The penetration of grid-connected generation technologies, with the exception of municipal solid waste, is determined by the EMM. Hydropower is included in the EMM directly.
Each submodule of the RFM is solved independently of the rest. Because variable operation and maintenance costs for renewable technologies are lower than for any other major generating technology and they produce almost no air pollution, all available renewable generating capacity is dispatched first by the EMM.
Costs for renewable energy technologies increase if supply expands rapidly--greater than 25 percent a year nationally. Wind or biomass technology capital costs also increase when the degree of technology use necessitates using higher cost resources; costs increase because of natural resource degradation, costs of upgrading the existing transmission or distribution network, or competition for use of the resources.
The wind-electric submodule projects the availability of wind resources as well as the cost and performance of wind turbine generators. This information is passed to the EMM so that wind turbines can be built and dispatched in competition with other electricity generating technologies. The wind turbine data are expressed in the form of energy supply curves that provide the maximum amount of turbine generating capacity that could be installed, given the available land area, wind speed, and capacity factor.
The geothermal-electric submodule provides the EMM with the amounts of new geothermal capacity that can be built at 51 individual sites, along with related cost and performance data. The information is expressed in the form of a supply curve that represents the aggregate amount of new capacity and associated costs that can be offered in each year. The factors determining the offered amounts of capacity include total reservoir heat, temperature, and the history of previously installed capacities.
Geothermal resource data are based on Sandia National Laboratory's 1991 geothermal resource assessment. Only hydrothermal (hot water and steam) resources are considered. Hot dry rock resources are not included, because they are not expected to be exploited during the NEMS forecast horizon.
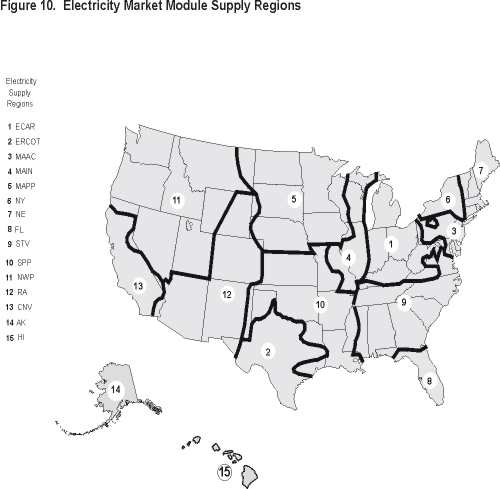
Capital and operating costs are estimated separately, and life-cycle costs are calculated according to standardized NEMS assumptions. The costing methodology includes ways to analyze effects of Federal and State energy tax construction and production incentives (if any). Individual reservoirs and their sizes and locations are mapped and matched to the NEMS electricity supply regions (see Figure 10).
The solar-electric submodule models both solar-photovoltaic and thermal-electric installations. Only central station grid-connected applications constructed by a utility or independent power producer are considered as generators. Grid-connected solar facilities can be utility or nonutility, a distinction that is internal to the EMM. The required input information is identical.
Capacity projections are developed endogenously by competing them against other generating technologies on the basis of capital costs, capacity factors, and fixed and variable operation and maintenance costs. Solar energy is a form of renewable energy that requires a more detailed characterization to represent its regionality and intermittent nature. This is dealt with by the regional load shapes used by the EMM and different seasonal and daily time periods to represent intermittency.
| RFM Outputs | Inputs from NEMS | Exogenous Inputs |
| Energy production capacities Capital costs Operating costs (including wood supply prices for the wood submodule) Capacity factors Available capacityBiomass fuel costs |
Installed energy production capacity Gross domestic product Population Interest rates Avoided cost of electricity Discount rate Capacity additions Biomass consumption |
Site-specific geothermal
resource quality data Site-specific wind resource quality data Plant utilization (capacity factor) Technology cost and performance parameters Landfill gas capacity Municipal solid waste management trends and regionality |
The biomass submodule provides biomass-fired plant technology characterizations (capital costs, operating costs, capacity factors, etc.) and fuel information for the EMM, thereby allowing biomass-fueled power plants to compete with other electricity generating technologies.
Biomass fuel prices are represented by a supply curve constructed according to the accessibility of wood resources to the electricity generation sector. The supply curve employs resource inventory and cost data from the U.S. Forest Service, as well as quantity and cost information for dedicated energy crops starting in 2010. Fuel distribution and preparation cost data are built into these curves. The supply schedule of biomass fuel prices are combined with other variable operating costs associated with burning biomass. The aggregate variable cost is then passed to the EMM.
Municipal Solid Waste Submodule
The municipal solid waste (MSW) submodule provides annual projections of energy produced from the incineration of MSW. It uses the quantity of MSW produced (derived from an econometric equation that uses gross domestic product and population as the forecast drivers), the heating value of a pound of MSW, and shares of MSW combusted for energy recovery. In addition, the submodule supplies the EMM with capital and operating cost information, which is used only for calculations of electricity prices. MSW energy production does not compete with other electricity generating technologies, because MSW is viewed as a byproduct of a community's waste disposal activities rather than a competitive alternative to other fuels.
An exogenous projection of landfill gas-fueled generating capacity is added to the total projection of MSW before it is passed to the EMM. This projection uses the same MSW forecast as combustion units. EIA assumes that a constant share of waste is combusted, but that increasing recycling results in a decline in the share of MSW landfilled. Calculations applying a landfill gas production profile to quantities landfilled yields total annual methane emissions. This total is then combined with an assumed increasing percent of emissions captured for energy conversion, and the resulting energy is converted to equivalent generating capacity.
![]()
TO:Oil and
Gas Supply Module
![]() National Energy
Modeling System: An Overview
National Energy
Modeling System: An Overview
File last modified: April 22, 1999
URL:
http://www.eia.doe.gov/oiaf/aeo98/ov98/rene.htm
Contact Name:Susan H. Holte, susan.holte@eia.doe.gov
Phone: (202) 586-4838
Fax: (202) 586-3045

If you having technical problems with this site, please contact the EIA Webmaster at wmaster@eia.doe.gov