SeaWiFS Biosphere Data over the North Pacific
|
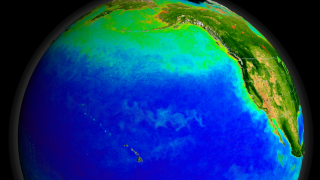
The SeaWiFS instrument aboard the Seastar satellite has been collecting ocean data since 1997. By monitoring the color of reflected light via satellite, scientists can determine how successfully plant life is photosynthesizing. A measurement of photosynthesis is essentially a measurement of successful growth, and growth means successful use of ambient carbon. This animation represents nearly a decade's worth of data taken by the SeaWiFS instrument, showing the abundance of life in the sea. Dark blue represents warmer areas where there is little life due to lack of nutrients, and greens and reds represent cooler nutrient-rich areas. The nutrient-rich areas include coastal regions where cold water rises from the sea floor bringing nutrients along and areas at the mouths of rivers where the rivers have brought nutrients into the ocean from the land.
|
|
|
|
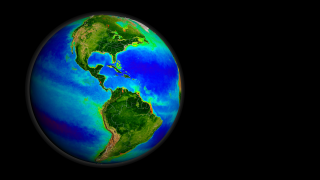
Animation depicting nearly a decades worth of SeaWiFS ocean chlorophyll concentration and land Normalized Difference Vegetation Index (NDVI) data. This animation begins by slowly spinning the earth around until settling over the North Pacific.
Duration: 2.7 minutes
Available formats:
1280x720 (60 fps)
Frames
1280x720 (59.94 fps)
MPEG-4
47 MB
320x180
PNG
231 KB
512x288 (60 fps)
MPEG-1
27 MB
1280x720 (60 fps)
MPEG-2
167 MB
512x288 (30 fps)
MPEG-1
26 MB
1280x720 (30 fps)
MPEG-2
167 MB
1280x720 (30 fps)
Frames
1280x720 (30 fps)
MPEG-4
140 MB
How to play our movies
|
|

|
|
Print resolution picture of global SeaWiFS biosphere data above the North Pacific.
Available formats:
3840 x 2160
TIFF
4 MB
320 x 180
PNG
103 KB
|
|

|
|
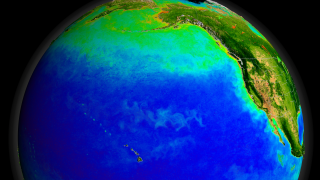
Print resolution picture of SeaWiFS global biosphere over the North Pacific.
Available formats:
3840 x 2160
TIFF
9 MB
320 x 180
PNG
237 KB
160 x 80
PNG
55 KB
80 x 40
PNG
14 KB
|
|
|
Back to Top
|

