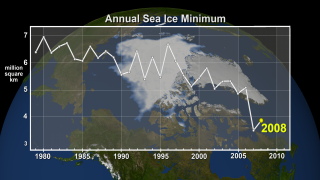
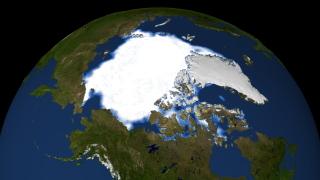
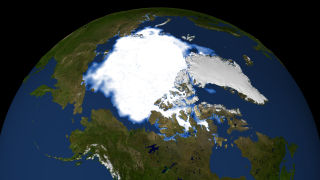
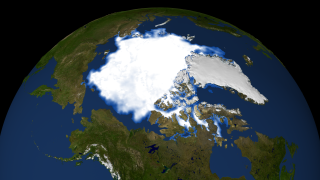
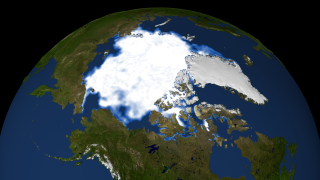
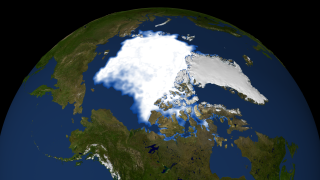
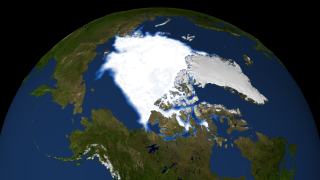
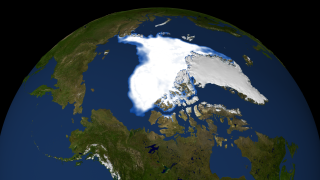
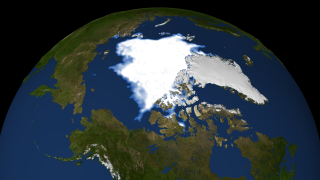
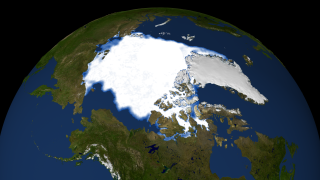
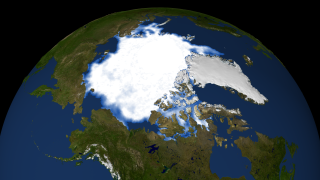
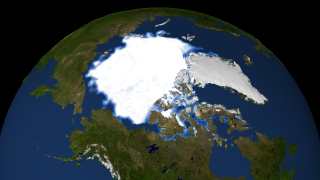
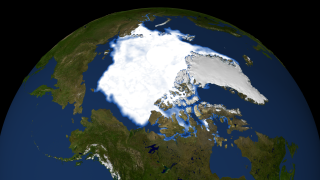
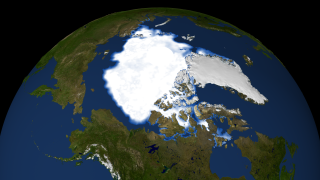
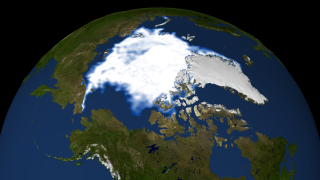
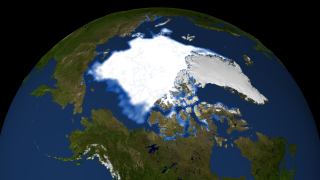
Sea Ice Yearly Minimum with Graph Overlay 1979-2008
|
|
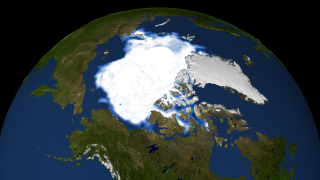
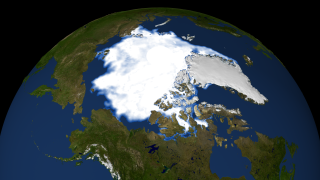
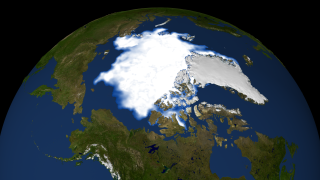
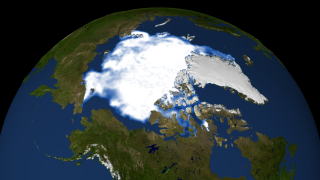
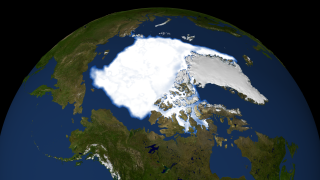
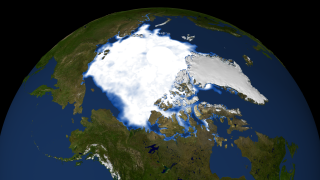
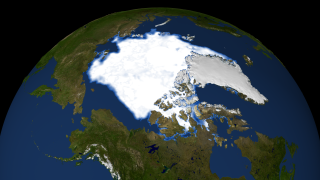
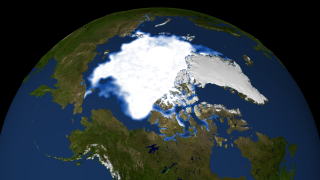
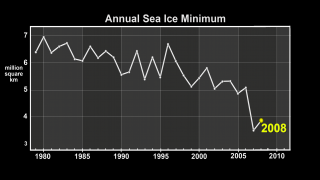
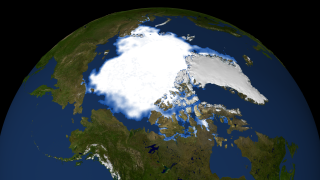
The continued significant reduction in the extent of the summer sea ice cover is a dramatic illustration of the pronounced impact increased global temperatures are having on the Arctic regions. There has also been a significant reduction in the relative amount of older, thicker ice. Satellite-based passive microwave images of the sea ice cover have provided a reliable tool for continuously monitoring changes in the extent of the Arctic ice cover since 1979. During 2008 the summer minimum ice extent, observed in September, reached 4.7 million km2. While slightly above the record minimum of 4.3 million km2, set just a year earlier in September 2007, the 2008 summer minimum further reinforces the strong negative trend in summertime ice extent observed over the past thirty years. At the record minimum in 2007, extent of the sea ice cover was 39% below the long-term average from 1979 to 2000. A longer time series of sea ice extent, derived primarily from operational sea ice charts produced by national ice centers, suggests that the 2007 September ice extent was 50% lower than conditions in the 1950s to the 1970s (Stroeve et al. 2008). The spatial pattern of the 2008 minimum extent was different than in 2007. The annual maximum sea ice extent typically occurs in March. In March 2008, the maximum ice extent was 15.2 million km2. This marked a second year of slight recovery in winter ice extent from the record minimum of 14.4 million km2 for the period 1979–2008, which was observed in 2006. For comparison, the mean monthly ice extent for March and September, for the period 1979–2008, is 15.6 and 6.7 million km2, respectively. The Arctic sea ice cover is composed of perennial ice (the ice that survives year-round) and seasonal ice (the ice that melts during the summer). Consistent with the diminishing trends in the extent and thickness of the cover is a significant loss of the older, thicker perennial ice in the Arctic. Data from the NASA QuikSCAT launched in 1999 (Nghiem et al., 2007) and a buoy-based Drift-Age Model (Rigor and Wallace, 2004) indicate that the amount of perennial ice in the March ice cover has decreased from approximately 5.5 to 3.0 million km2 over the period 1958–2007. While there is considerable interannual variability, an overall downward trend in the amount of perennial ice began in the early 1970s. This trend appears to coincide with a general increase in the Arctic-wide, annually averaged surface air temperature, which also begins around 1970. In recent years, the rate of reduction in the amount of older, thicker perennial ice has been increasing, and now very little ice older than 5 years remains (Maslanik et al. 2007).
|
|
|
|
Annual Arctic Sea Ice Minimum from 1979 to 2008.
Duration: 32.0 seconds
Available formats:
3840x2160
TIFF
7 MB
320x180
PNG
222 KB
160x80
PNG
55 KB
80x40
PNG
15 KB
1280x720 (29.97 fps)
MPEG-4
12 MB
512x288 (30 fps)
MPEG-1
1 MB
1280x720 (30 fps)
Frames
(Combined)
1280x720 (60 fps)
Frames
(Combined)
How to play our movies
|
|

|
|
Overlay sequence: graph showing annual trend from 1979 to 2008.
Duration: 32.0 seconds
Available formats:
3840x2160
TIFF
3 MB
320x180
PNG
128 KB
1280x720 (29.97 fps)
MPEG-4
5 MB
512x288 (30 fps)
MPEG-1
337 KB
1280x720 (30 fps)
Frames
(Graph Overlay)
1280x720 (60 fps)
Frames
(Graph Overlay)
How to play our movies
|
|
|
|
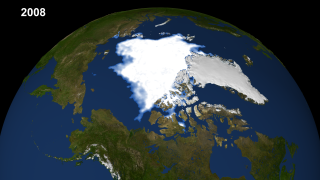
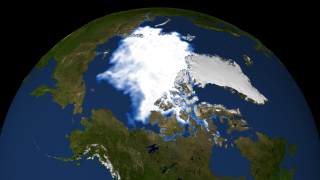
Minimum Sea Ice Sequence with Date Overlay from 1979 to 2008.
Duration: 32.0 seconds
Available formats:
3840x2160
TIFF
7 MB
320x180
PNG
208 KB
1280x720 (60 fps)
Frames
(Dates Sea Ice Minimum)
1280x720 (30 fps)
Frames
(Dates Sea Ice Minimum)
512x288 (30 fps)
MPEG-1
1 MB
1280x720 (29.97 fps)
MPEG-4
15 MB
How to play our movies
|
|

|
|
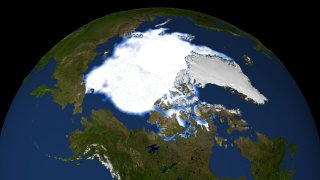
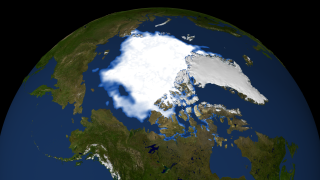
Minimum Sea Ice Sequence from 1979 to 2008. This image is the Arctic sea ice minimum area during the week of September 12, 2008.
Duration: 32.0 seconds
Available formats:
3840x2160
TIFF
7 MB
320x180
PNG
207 KB
512x288 (30 fps)
MPEG-1
1 MB
1280x720 (29.97 fps)
MPEG-4
15 MB
1280x720 (30 fps)
Frames
(Sea Ice Minimum)
1280x720 (60 fps)
Frames
(Sea Ice Minimum)
How to play our movies
|
|
|
|
Date Overlay from 1979 to 2008.
Available formats:
3840x2160
TIFF
91 KB
320x180
PNG
2 KB
1280x720 (60 fps)
Frames
(Dates)
How to play our movies
|
|

|
|
21 September 1979 Arctic sea ice minimum area for 1979
Available formats:
3840 x 2160
TIFF
7 MB
320 x 180
PNG
208 KB
|
|

|
|
05 September 1980 Arctic sea ice minimum area for 1980
Available formats:
3840 x 2160
TIFF
7 MB
320 x 180
PNG
210 KB
|
|

|
|
10 September 1981 Arctic sea ice minimum area for 1981
Available formats:
3840 x 2160
TIFF
7 MB
320 x 180
PNG
208 KB
|
|
|
|
17 September 1982 Arctic sea ice minimum area for 1982
Available formats:
3840 x 2160
TIFF
7 MB
320 x 180
PNG
208 KB
|
|
|
|
18 September 1983 Arctic sea ice minimum area for 1983
Available formats:
3840 x 2160
TIFF
7 MB
320 x 180
PNG
209 KB
|
|

|
|
16 September 1984 Arctic sea ice minimum area for 1984
Available formats:
3840 x 2160
TIFF
7 MB
320 x 180
PNG
208 KB
|
|

|
|
07 September 1985 Arctic sea ice minimum area for 1985
Available formats:
3840 x 2160
TIFF
7 MB
320 x 180
PNG
207 KB
|
|
|
|
06 September 1986 Arctic sea ice minimum area for 1986
Available formats:
3840 x 2160
TIFF
7 MB
320 x 180
PNG
209 KB
|
|
|
|
02 September 1987 Arctic sea ice minimum area for 1987
Available formats:
3840 x 2160
TIFF
7 MB
320 x 180
PNG
209 KB
|
|
|
|
12 September 1988 Arctic sea ice minimum area for 1988
Available formats:
3840 x 2160
TIFF
7 MB
320 x 180
PNG
213 KB
|
|

|
|
23 September 1989 Arctic sea ice minimum area for 1989
Available formats:
3840 x 2160
TIFF
7 MB
320 x 180
PNG
211 KB
|
|

|
|
19 September 1990 Arctic sea ice minimum area for 1990
Available formats:
3840 x 2160
TIFF
7 MB
320 x 180
PNG
210 KB
|
|
|
|
16 September 1991 Arctic sea ice minimum area for 1991
Available formats:
3840 x 2160
TIFF
7 MB
320 x 180
PNG
212 KB
|
|
|
|
04 September 1992 Arctic sea ice minimum area for 1992
Available formats:
3840 x 2160
TIFF
7 MB
320 x 180
PNG
209 KB
|
|
|
|
11 September 1993 Arctic sea ice minimum area for 1993
Available formats:
3840 x 2160
TIFF
7 MB
320 x 180
PNG
210 KB
|
|
|
|
05 September 1994 Arctic sea ice minimum area for 1994
Available formats:
3840 x 2160
TIFF
7 MB
320 x 180
PNG
212 KB
|
|
|
|
01 October 1995 Arctic sea ice minimum area for 1995
Available formats:
3840 x 2160
TIFF
7 MB
320 x 180
PNG
209 KB
|
|
|
|
10 September 1996 Arctic sea ice minimum area for 1996
Available formats:
3840 x 2160
TIFF
7 MB
320 x 180
PNG
211 KB
|
|
|
|
19 September 1997 Arctic sea ice minimum area for 1997
Available formats:
3840 x 2160
TIFF
7 MB
320 x 180
PNG
210 KB
|
|

|
|
12 September 1998 Arctic sea ice minimum area for 1998
Available formats:
3840 x 2160
TIFF
7 MB
320 x 180
PNG
212 KB
|
|

|
|
11 September 1999 Arctic sea ice minimum area for 1999
Available formats:
3840 x 2160
TIFF
7 MB
320 x 180
PNG
211 KB
|
|
|
|
11 September 2000 Arctic sea ice minimum area for 2000
Available formats:
3840 x 2160
TIFF
7 MB
320 x 180
PNG
211 KB
|
|

|
|
19 September 2001 Arctic sea ice minimum area for 2001
Available formats:
3840 x 2160
TIFF
7 MB
320 x 180
PNG
212 KB
|
|
|
|
12 September 2002 Arctic sea ice minimum area for 2002
Available formats:
3840 x 2160
TIFF
7 MB
320 x 180
PNG
210 KB
|
|

|
|
11 September 2003 Arctic sea ice minimum area for 2003
Available formats:
3840 x 2160
TIFF
7 MB
320 x 180
PNG
211 KB
|
|
|
|
11 September 2004 Arctic sea ice minimum area for 2004
Available formats:
3840 x 2160
TIFF
7 MB
320 x 180
PNG
210 KB
|
|

|
|
21 September 2005 Arctic sea ice minimum area for 2005
Available formats:
3840 x 2160
TIFF
7 MB
320 x 180
PNG
205 KB
|
|

|
|
14 September 2006 Arctic sea ice minimum area for 2006
Available formats:
3840 x 2160
TIFF
7 MB
320 x 180
PNG
211 KB
|
|
|
|
14 September 2007 Arctic sea ice minimum
Available formats:
3840 x 2160
TIFF
7 MB
320 x 180
PNG
216 KB
|
|
|
Back to Top
|

