Sea Surface Temperature Anomaly, 2005 (WMS)
|
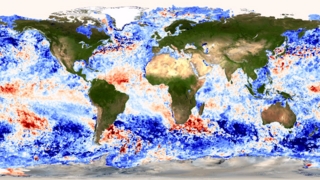
The temperature of the surface of the world's oceans provides a clear indication of the state of the Earth's climate and weather. The sea surface temperature anomaly, or difference from the mean, can show climate indicators such as the El Nino oscillation, which manifests as a warmer-than-normal sea surface temperature in the Pacific Ocean west of Ecuador and Peru. This sequence shows a slight La Nina effect, or cooler-than-normal sea surface temperature in the eastern Pacific.
|
|
|
|
This animation shows the Sea Surface Temperature Anomaly for the first part of 2005.
Duration: 8.0 seconds
Available formats:
1024x512
Frames
2048x1024
Frames
80x40
PNG
9 KB
1280x720 (29.97 fps)
MPEG-2
17 MB
320x240 (30 fps)
MPEG-1
1 MB
720x480 (29.97 fps)
MPEG-2
7 MB
320x180
JPEG
66 KB
160x80
PNG
36 KB
How to play our movies
|
|
This product is available through our Web Map Service.
Click here to learn more.
|
|
|
|
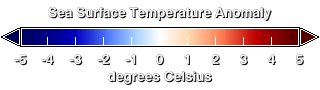
This is the color bar for the sea surface temperature anomaly animation.
Available formats:
320 x 90
PNG
1 KB
|
|
|
Back to Top
|

