| Design for Inclusion: Creating
a New Marketplace--Industry White Paper
National
Council on Disability
1331 F Street, NW, Suite 850
Washington, DC 20004
202-272-2004 Voice
202-272-2074 TTY
202-272-2022 Fax
Lex Frieden, Chairperson
October 28, 2004
This report is also available in alternative formats
and on NCD’s award-winning Web site (http://www.ncd.gov/).
The views contained in the report do not necessarily
represent those of the administration, as this and all NCD reports
are not subject to the A-19 executive branch review process.
National Council on Disability
Members and Staff
Members
Lex Frieden, Chairperson, Texas
Patricia Pound, First Vice Chairperson, Texas
Glenn Anderson, Ph.D., Second Vice Chairperson, Arkansas
Milton Aponte, J.D., Florida
Robert R. Davila, Ph.D., New York
Barbara Gillcrist, New Mexico
Graham Hill, Virginia
Joel I. Kahn, Ph.D., Ohio
Young Woo Kang, Ph.D., Indiana
Kathleen Martinez, California
Carol Novak, Florida
Anne M. Rader, New York
Marco Rodriguez, California
David Wenzel, Pennsylvania
Linda Wetters, Ohio
Staff
Ethel D. Briggs, Executive Director
Jeffrey T. Rosen, General Counsel and Director of Policy
Mark S. Quigley, Director of Communications
Allan W. Holland, Chief Financial Officer
Julie Carroll, Attorney Advisor
Joan M. Durocher, Attorney Advisor
Martin Gould, Ed.D., Senior Research Specialist
Geraldine Drake Hawkins, Ph.D., Program Analyst
Pamela O’Leary, Interpreter
Brenda Bratton, Executive Assistant
Stacey S. Brown, Staff Assistant
Carla Nelson, Office Automation Clerk
Acknowledgments
The National Council on Disability (NCD) wishes to
express its appreciation to W. Bradley Fain of Georgia Tech Research
Institute (GTRI), who was the principal investigator for this project.
Researchers in GTRI’s Electronic Systems Laboratory performed
the work documented in this report. NCD acknowledges the contributions
of Steve Jacobs of the Ideal Group, who performed the market definition
and research for this report. NCD also acknowledges the participation
of the industry partners that supported the industry study portion
of this research. The industry partners provided invaluable insight
into the impact of Section 508 on business and the barriers and
facilitators relating to the adoption of universal design principles.
NCD also acknowledges the donation of equipment and services utilized
during the user study portion of the research. The following companies
provided products and services, at no cost to the project, for user
testing: HP, Nokia, and SENCORE Electronic Test Equipment.
NCD would also like to acknowledge the efforts of
Gerry Field, WGBH Boston, for providing a closed caption test stream
used in user testing.
Contents
National Council on Disability Members
and Staff
Acknowledgments
I. Executive Summary
Important Findings and Recommendations
II. Market Definition and Research
Definition of the Market Environment
Customer Analysis
Analysis of the International Market
Analysis of Market Trends
III. Industry Study
Analysis of Facilitators and Barriers
to Accessible Design
Industry Study Data Collection
Methodology
Analysis of Industry Data: Factors
Influencing Adoption of UD Practices
Analysis of the Industry Study Findings
List of Acronyms and Abbreviations
Bibliography
LIST OF TABLES
Table 1: China's Information Technology
Market
Table 2: China's Telecommunication
Equipment Market
Table 3: China's Packaged Software
Import and Export Market
Table 4: Other Promising Telecommunication
Equipment Sub-Sectors
Table 5: Total Combined Market for
Telecommunications Equipment in India
Table 6: Computers and Peripherals
in India
Table 7: Information Technology in
India
Table 8: Russia's Telecommunications
Equipment Market
Table 9: Computers, Peripherals,
and Software in Russia
Table 10: Electronic Components
Imported from the U.S. in 2002 (US$ millions)
Table 11: Electronic Components
Imported from the U.S. to Mexico in 2002
Table 12: Mexican Internet and E-Commerce
Revenues
Table 13: Mexican Computers
Table 14: Market Size Estimate for
the Turkish Telecommunications Services Sector
Table 15: Market Size Estimate for
the Turkish Telecommunications Equipment Sector
Table 16: Turkey's Information Technology
Market
Executive
Summary
Designing with access in mind can significantly increase
the size of targeted markets for electronic and information technology
(E&IT). Good business practice dictates that designers and engineers
avoid unintentionally excluding large populations of consumers from
accessing and using the E&IT they develop and manufacture. People
with disabilities are at the highest risk of exclusion. Other consumer
groups are also at risk. They are—
• Individuals 65+ years old
• Consumers living in low-bandwidth
information infrastructures
• People who never learned to read
• Users of English as a Second Language
(ESL)
• Tourists and people living in multilingual
societies
• Consumers living in high-density
populations
Designing with access in mind can be accomplished
through universal design (UD). Universal design is a process to
ensure that E&IT is inclusive, accessible, and usable by everyone,
including people with disabilities. Accessible design is a step
forward when developing E&IT products, but it tends to lead
to technologies that will be used separately, or in addition to,
the main E&IT product, which diminishes the effectiveness of
designing for all. Incorporating UD processes when developing E&IT
is one solution to accommodating people with disabilities that also
improves the usability of the products for the rest of the population.
The National Council on Disability (NCD) undertook
this research to understand the market for universally designed
mainstream consumer products and services, document successful UD
development processes, understand consumer needs, understand UD
facilitators and barriers, and identify and address current issues
in universal design. This research comes at a time when understanding
and incorporating UD into the development process are most crucial.
We are in the window of opportunity for implementing section 508.
If progress is not made quickly in improving the skills of government
and industry employees on accessibility issues, the window will
soon shut with little having been accomplished. If industry does
not see that federal agencies are serious about implementing section
508 in a consistent manner, companies will shift the monetary and
human resources needed for improving accessibility to product development
opportunities that offer a higher return on investment. Progress
must be made now, and the purpose of this report is to present the
information and recommendations that will guide this progress.
Through this research, NCD aims to educate designers
and manufacturers about how electronic and information technology
intersects with the needs of individuals with disabilities. In addition
to providing knowledge about disabilities, we see the importance
here and now of educating individuals on universal design. Currently,
many business people have never heard of UD, and many of those who
have do not understand that it is more than just a design for disability.
This research aims to provide businesses with the knowledge of UD
methods they need to clearly see how their complex products can
be made accessible in a cost-effective way.
As part of this research, six product lines were
analyzed from the telecommunications, software, consumer electronics,
and digital services industries for both accessibility and usability.
We estimated how useful these products are to people with disabilities
and whether the products conformed to section 508 standards and
section 255 guidelines. We were able to present recommendations
for improving such products. At a time when the incorporation of
universal design is crucial, NCD hopes that the information provided
in this report will motivate and drive the development of more universally,
accessibly designed E&IT.
Important Findings and
Recommendations
User Study. The purpose
of the user study was to document and understand user experiences
with the six product lines under study. The experiences and thoughts
of the consumer with a disability provided important insight into
the future design of accessible products and can potentially influence
the universal design process. The key findings of the user study
are as follows:
• Users with disabilities are often
asked to pay high prices for phones with feature sets that are
not useful to them.
• Rapid changes in technology often
cause decreases in accessibility.
• Users are reluctant to adopt technologies
that have proven frustrating in the past.
• Users have difficulty finding devices
that match their functional capabilities because of the lack of
familiarity sales associates have with accessibility features.
• Users are reluctant to invest in
technologies that have an unproven accessibility record.
• Accessibility solutions must consider
the needs of the individual with disabilities.
Substantial increases in accessibility will be required
before increased sales to members of the disability community are
realized.
Product Analysis. A detailed
product line analysis was conducted for each of the product lines
selected for study. The purpose of this research was to document
accessibility issues that prevent people with disabilities from
fully accessing the selected products and to document accessibility
features that either are currently offered or could be offered by
manufacturers. The end result of this product analysis was the assignment
of an accessibility grade to each product line for each disability
group. These grades may be useful to designers and manufacturers
to identify the target populations that should be consulted during
the design process so that more accessible design features are incorporated
into new products.
Industry Study. The purpose
of the industry study was to document UD practices within industries
represented by the six product lines selected for study. Five categories
of facilitators and barriers to accessible design were examined:
design, organizational, informational, financial, and legal. A discussion
of these barriers and facilitators as experienced by the six companies
is included in this section.
In addition, 11 business concerns were identified
as having an influence on UD practices within an organization. Each
business concern had a different level of influence, depending on
the strength of the other factors. The factors influencing the adoption
of UD practices included the business case, strategy and policy,
demand and legislation, marketing and sales, research, design, testing,
resource allocation and funding, organization and staff, training,
and the customer and consideration of people with disabilities.
All the companies that participated in the industry
study have made strategic decisions to address the accessibility
of their products and services. A few of the companies had long-standing
accessibility programs that were reinvigorated by the technical
requirements of section 508. Other companies initiated their accessibility
activities while planning for their response to section 508. In
both cases, section 508 clearly has had an impact on the way accessibility
and UD are being addressed by industry. The industry study found
that the most common approaches to addressing accessibility issues
are—
• Increasing awareness of employees
• Integrating accessibility requirements
into the design process
• Performing accessibility verification
testing
• Establishing an accessibility program
office
Discussion. Through this
research, we have come to better understand the market for universally
designed mainstream consumer products and services, documented successful
universal design development processes, achieved a better understanding
of consumer needs, analyzed UD facilitators and barriers, and identified
and addressed current issues in universal design. This research
program has found that—
• A market for universally designed
products and services exists.
• UD principles can be easily incorporated
into current design practices.
• Products designed to be accessible
sometimes do not meet the needs of users.
• Legislation is currently both a facilitator
and a barrier to UD.
• Many barriers to UD remain and must
be addressed before significant progress can be made.
Several important recommendations can be made from
this research for designers, developers, federal agencies, and companies
striving to incorporate universal design into their development
process:
Strategies for Government and Industry to Promote
Universal Design
Recommendation #1. Use standards
(government or industry) to prohibit nonessential features that
pose accessibility problems unless an alternative interface that
solves the problem is provided.
Recommendation #2. Use standards
(government or industry) to eliminate interoperability problems
that create accessibility problems.
Recommendation #3. Use market
forces to regulate features that pose intermediate levels of accessibility
problems. Require labeling and other information to be provided,
and allow recourse through tort (warranty) as well as through general
demand, as reflected in consumer purchases.
Recommendation #4. Develop
training materials and educational articles documenting the market
potential for UD products and services.
Strengthening the Impact of Section 508
Section 508 was developed to govern the purchase
of accessible electronic and information technology purchased by
the Federal government. Despite having been in place for nearly
three years, section 508 has yet to reach its potential. One of
the greatest shortfalls of Section 508 is the lack of understanding
of and attention to the functional performance requirements.
Recommendation #5. Institute
procedures designed to ensure that due diligence is given to section
508 procurement requirements. Perform an internal analysis of the
impact of section 508 on the procurement of actual products. Publish
the results of the analysis as a way of convincing industry that
the Federal Government is committed to section 508.
Recommendation #6. Consider
requesting supporting evidence for claims made on voluntary product
accessibility templates (VPATs) from all vendors responding to bid
proposals.
Recommendation #7. Develop
a quick accessibility checklist for specific product lines likely
to be procured by the Federal Government. The quick accessibility
checklist would assist procurement officials in market research
by providing them with a list of items that they can inspect themselves
when procuring products. The checklist would be tailored to specific
product lines and would not require detailed expertise to evaluate.
Recommendation #8. Develop
guidance for reporting conformance with functional performance criteria
guidelines.
Recommendation #9. Support
the coordination of state and local government adoption of section
508 technical requirements. Provide state and local governments
with documents and training programs designed to ensure unification
of technical requirements.
Recommendation #10. Study
and document the nontechnical aspects of accessibility, including
social, psychological, and organizational accessibility. Promote
UD solutions that consider all aspects of accessibility.
Promoting the Inclusion of Universal Design in Industry
Practices
Companies are not aware of the design process modifications
needed to incorporate universal design principles. The Federal Government
should support the refinement of specific design process interventions
that can easily be incorporated.
Recommendation #11. Develop,
test, and disseminate methodologies for integrating UD into existing
design practices.
Recommendation #12. Support
the development of university-level training materials that could
be incorporated into the curriculums of existing design-oriented
degree programs. The training materials should include awareness-expanding
videos and other teaching resources that illustrate the potential
impact of key design process interventions on the lives of people
with disabilities and other beneficiaries of UD.
Recommendation #13. Develop,
test, and disseminate design reference users to illustrate the range
of functional capabilities and limitations typical among people
with disabilities. Design reference users (popular in specifying
the target population in Department of Defense acquisitions) is
a set of descriptions of prototypical users who, taken together,
express the range of functional capabilities and limitations of
the population that must be accommodated by the design project.
The use of design reference users would greatly simplify the need
for designers to research and integrate information pertaining to
the functional limitations and capabilities of people with disabilities.
Recommendation #14. Develop
a standard methodology for testing accessibility and comparing the
accessibility of similar products.
Recommendation #15. Coordinate
with industry to promote the integration of accessibility concepts,
principles, and guidelines into the development tools used by designers
to develop products.
Creating a New Marketplace
Consumers with disabilities find many E&IT products
to be inaccessible. A sizeable un-tapped market for universal design
products and services exists. However, few companies appreciate
the size of the market or know how to tap its potential.
Recommendation #16. Develop
an information clearinghouse where users can obtain information
about accessibility issues and the features designed to address
the issues for specific product lines. Educate consumers on how
to shop for UD products and services. List vendor resources where
consumers can obtain more information about UD products.
Recommendation #17. Develop
marketing strategies and approaches that will facilitate a connection
with people with disabilities.
Recommendation #18. Train
people with disabilities to become subject-matter experts for the
purpose of participating in design focus groups and accessibility
evaluations.
Recommendation #19. Create
job-related outcomes for bulk purchasers for the successful procurement
of products and services with UD features.
Conclusions
People with disabilities want to use the same products
that everyone else uses. They do not want to be limited to specialized
products that are more costly. Implementation of UD is the best
way to satisfy this desire of people with disabilities, while also
providing more cost-effective products for all users. While it is
impossible to satisfy the needs of all users, products and services
that come closer to accommodating a variety of physical and cognitive
differences will benefit both users and companies.
A full version of this report, including methodology,
can be found online at www.ncd.gov.
II. Market
Definition and Research
Electronic and information technology is driving
the creation of new communities that are forever changing the way
people live, learn, work, and play. Companies are increasingly expanding
their presence in emerging markets. Businesses are serving populations
they have never served before. Every consumer is different. No two
people have the same set of characteristics, learning styles, abilities,
experiences, or educational backgrounds. Developing products that
accommodate the wants, needs, and preferences of as many individual
consumers as is technically possible and economically feasible can
greatly enhance a company’s competitive advantage.
Designing with access in mind can significantly increase
the size of E&IT markets on a global basis. Good business practices
dictate that designers and engineers avoid excluding large groups
of consumers from accessing and using E&IT. Groups at the highest
risk of unintentional exclusion are
• People with disabilities
• Individuals 65+ years old
• Consumers living within low-bandwidth
information infrastructures
• Users of English as a Second Language
(ESL)
• Tourists traveling to nonnative language
destinations
• Consumers living in high-density
populations
This market analysis examined many aspects of manufacturing
“more accessibly designed” E&IT. This analysis was
intended to help answer questions like the following:
• Is there a market for more accessibly
designed products?
• Does the capacity exist to develop
more accessibly designed products in each of the presented product
lines?
• What factors influence the market
for more accessibly designed products for each of the product
lines presented?
All of the product lines reviewed in this report
are manufactured by members of the E&IT industry. Naturally,
in order for these products to be manufactured, the E&IT industry
must exist. In order to exist, it must be profitable. A question
often asked by the disability community is, “How can we ensure
that the E&IT products and services being manufactured are accessible
to people with disabilities?” E&IT manufacturers often
pose this same question using different words. They ask, “How
can we ensure that the E&IT products and services we manufacture
are accessible and usable by as many people as is technically possible
and economically feasible without the need for customization?”
The questions are different. The motivations are different. The
market drivers are different. The solutions can be remarkably similar.
Definition of the Market
Environment
Historically, the primary forces driving the manufacture
of more accessible E&IT products and services have been legal,
moral, social, and ethical. The assumption was that if legal, moral,
social, and ethical issues no longer existed, then the motivation
to manufacture more accessible E&IT would all but disappear.
The next two sections discuss the reasons why nothing could be further
from the truth.
In contrast to the historical notion of the primary
forces driving the manufacture of accessible E&IT, in actuality,
a majority of the forces driving demand for more accessibly designed
E&IT fall into the following five categories:
Market Forces
Market forces consistently drive the demand for more
accessibly designed E&IT. Market forces include the need to
respond to consumer behavior, the work of federal agencies, legislation
mandating developments in the accessibility of E&IT, changing
marketing philosophies (from mass marketing to a one-on-one marketing
philosophy), competition within the market, emerging technology
trends, and economic expansion. These market forces are discussed
below in terms of how they drive the markets for more accessibly
designed E&IT products.
Consumer Behavior
E&IT is prevalent in schools, libraries, individuals’
homes, work environments, places of recreation, banks, and even
supermarkets. It is because of this widespread presence that consumers
are more technically literate than they were five years ago. Devices
such as cell phones, PDAs, voice recognition systems, and the wireless
Web enable us to carry our offices with us when we travel. We are
more mobile now than ever before. Consumers have become accustomed
to getting the information they need when they need it and where
they want it. This has created an expectation of immediacy. When
consumers don’t get what they want quickly, they become impatient.
E&IT designers need to respond to consumer behavior by providing
products and services that not only meet, but exceed the high expectations
of a technically literate, mobile, consumer base. Increasing the
accessibility of information services and mobile technologies increases
access to the information demanded by consumers with high expectations.
Federal Government
The Federal Government serves as a catalyst for more
accessibly designed E&IT products through its buying power,
the development of legislation, and the support of assistive technology
(AT) accommodation labs. Section 508 of the Rehabilitation Act amendments
of 1998 mandates the purchase of accessibly designed E&IT. As
a result, all federal agencies appointed Section 508 coordinators
(Section 508, 2003). Those coordinators are responsible for organizing
and supporting the implementation of Section 508 within their respective
departments and agencies, and they serve as the central point of
contact for information concerning accessibility issues and solutions.
In addition to Section 508, other legislation provides guidelines
for designing more accessible E&IT. The Access Board developed
the ADA Accessibility Guidelines for Buildings and Facilities (ADAAG),
and the Telecommunications Act Accessibility Guidelines (Section
255) mandate the design of more accessible E&IT products and
services. Presidential initiatives also drive the design of more
accessible E&IT. These initiatives include the President’s
New Freedom Initiative (White House, 2001), the No Child Left Behind
Initiative (U.S. House of Representatives, 2002), and the disabilityinfo.gov
Web site (DisabilityInfo.gov, 2003).
In addition to these acts and initiatives, many federal
agencies have created AT accommodation labs. These labs serve as
focal points for information regarding accommodations, disabilities,
and AT.
Clearly, the Federal Government is an important market
force for driving accessibility requirements.
Marketing Philosophies
Marketing philosophies have changed radically over
the past 35 years. The marketing philosophy of the 1960s was mass
marketing (Mass Marketing Definition, 2003), in which the seller
views the market as a homogeneous whole and, therefore, has only
one marketing program (the same product, the same price, the same
promotion, and the same distribution system) for everyone in the
population. This type of marketing is also referred to as unsegmented
or undifferentiated marketing.
Marketing philosophies of the 1970s included product
line extension (Product Line Stretching Definition, 2003) and market
segmentation (Market Segmentation Definition, 2003). Product line
extension adds depth to an existing product line by introducing
new products in the same product category. Market segmentation is
the division of a totally heterogeneous market into groups or sectors
with relatively homogeneous needs and wants.
In the 1980s, the marketing philosophy shifted to
one of niche marketing (Niche Marketing Definition, 2003). Niche
marketing or concentrated marketing is a marketing segmentation
strategy in which the firm concentrates all of its efforts and resources
on serving one segment of the market.
In the 1990s, value-added marketing became popular.
Value-added marketing is a strategy in which a company buys products,
customizes them for a particular application, and then resells them.
There was also a shift toward marketing to individual customers
rather than the larger mass. Don Peppers and Martha Rogers invented
the phrase “one-to-one” marketing (Peppers and Rogers,
1997) to illustrate the revolutionary concept of treating different
customers differently. One-to-one marketing supports the establishment
of permanent relationships with your customers. One-to-one subscribes
to providing products and services to customers according to their
individual wants, needs, and preferences. “Share of customer”
replaces market share. The marketing focus shifts from institutions
to individual consumers.
Once a company acquires the knowledge and experience
required to manufacture more accessibly designed E&IT, it can
take an asset marketing approach (Asset-Based Marketing Definition,
2003) to providing their E&IT products globally. Asset marketing
uses the knowledge and skills a company has already developed as
the basis for growth. For example, a company that is skilled in
developing kiosks that are accessible to people who are blind can
market kiosks designed in a similar manner to countries that have
high populations of people who never learned to read. This global
marketing (Global Marketing Definition, 2003) philosophy enables
companies to sell the same, or very similar, products to world markets
with essentially the same promotion. This marketing approach is
also commonly referred to as international marketing.
Competition
Competition in the E&IT industry is fierce. The
industry is constantly looking for ways to increase efficiency,
competitive advantage, sales, market shares, and profitability.
It is also looking to cut costs. Businesses are constantly developing
new and innovative products and services with the hope of achieving
these objectives, and adding functionality that enhances the accessibility
and usability of a product can be very beneficial. In extremely
competitive markets, several companies have correctly identified
UD as a potential market discriminator. When highly similar product
lines are all competing for the same customer, a product designed
with access in mind may have the needed advantage required to outbid
the competitors.
Technology Trends
A variety of rising mainstream technology trends
fuels the need for more accessibly designed E&IT. The functionalites
of multiple individual devices are now being integrated into a single
device, including pagers, cell phones, PDAs, palmtop computers,
smart phones, and MP3 players. This is creating a dependence on
one device to accomplish multiple functions. Thus, if not more accessibly
designed, this multiple functionality precludes the use of such
devices by certain segments of the population, e.g., people 65+
years of age. Developing and manufacturing an accessible interface
for a device that provides multiple functions is less expensive
than developing and manufacturing an accessible interface for multiple,
single-function devices.
Decreasing costs are making E&IT devices more
affordable. Emerging markets have the greatest concentration of
low-income individuals, as well as a greater concentration of people
who are unable to read and write.
Increasing processing power, disk storage, memory
capacity, and battery life are enabling developers to integrate
advanced access technologies (speech recognition, text-to-speech
synthesis, projected displays, etc.) into devices where it has not
previously been technically possible to do so. In addition, the
Internet and the World Wide Web are now being utilized as a primary
infrastructure for education, government services, news, and business.
Customers’ technical knowledge and expectations are constantly
increasing, along with the use of wireless Internet appliances and
an increasing use of wireless infrastructures. Legal mandates to
manufacture more accessibly designed E&IT in support of people
with disabilities are also a major technological trend. In addition,
E&IT needs to be marketed to emerging markets in order for E&IT
manufacturers to increase sales and gain competitive price advantage
through economies of scale.
Economic Expansion
The strength of our global economy is, to a great
extent, the result of the investment in and application of new technologies
by governments, businesses, and individuals. Technology is the foundation
upon which developing countries can build thriving, financially
independent, self-sufficient economies. The technologies that build
this foundation include computers, networks, ATMs, wired and wireless
information infrastructures, wireless handheld Internet appliances,
and cellular telephones, to name a few. Applications include online
banking, distance learning, e-government, and e-commerce (World
Information Technology and Services Alliance, 2003).
Local Environment
Another force that drives the market for accessibly
designed E&IT is the local environment. Below is a discussion
of two environmental factors, variances in bandwidth and tourism.
Bandwidth
As of May 2004, more than half (51.39 percent) of
home Internet users in the United States relied on dial-up modems
of 56Kbps or less. Of all U.S. home Internet users, 42.53 percent
used 56Kbps modems, 6.52 percent used 28/33.3Kbps modems, and 2.34
percent used 14.4Kbps modems (Nielsen/NetRatings, 2004).
Computers using dial-up connections cannot handle
graphics as quickly and efficiently as computers connected via broadband.
It is for this reason that users surf the Internet with graphics
turned off. They do this to speed up downloads. In addition, low-bandwidth
connections do not lend themselves to a lot of graphic images, video-based
information, or streaming audio. Multimedia content can be problematic
for users with slower connections. Wireless devices communicating
with the Internet at slow connect speeds can also be a source of
accessibility and usability problems.
There are solutions to dealing with these problems.
Some companies have the ability to control the settings on the browsers
used on their employees’ personal computers (PCs). When available
corporate Intranet bandwidth is at a premium, these companies can
simply issue a central command to turn off graphics on all client
PC browsers. This can immediately free up as much as 80 percent
of available bandwidth. Designing Web sites for low-bandwidth access
tends to increase accessibility for users with disabilities. For
example, a graphics- or animation-intensive site often requires
high bandwidth and is inaccessible to those who are blind. In contrast,
a text-based site loads quickly and is accessible to screen readers.
Dial-up environments will continue to drive the development of more
accessible E&IT in the foreseeable future.
Tourism
During the first quarter of 2004, the United States
welcomed 8 million international visitors. This was an increase
of 12 percent compared with the first quarter of 2003.
Visiting tourists often make use of ATMs, self-service
kiosks, ticketing kiosks, and other tourism-related information
technologies. Many tourists only use English as a second language.
Developing content written in simplified English makes it more understandable
to users of ESL. In addition, using simplified English content has
other significant benefits, including the following:
• It reduces the cost of language translation.
• It reduces ambiguity.
• It speeds reading.
• It reduces liability associated with
misunderstandings.
The use of simplified content was originally included
in various accessibility design guidelines in support of people
with cognitive reading disabilities. Using simplified language has
now evolved into a market force driving the design of more accessible
E&IT.
Human Condition
Aside from forces stemming from the market and the
environment, many of the forces driving the accessible design of
E&IT fall under aspects of the human condition. E&IT products
must be designed with people of different disabilities, various
age groups, various levels of literacy, various languages, different
learning styles, and different experience levels with activities
such as using the Internet in mind. These aspects of the human condition
bring with them the demand for accessible E&IT products that
cater to not just one category, but to many different types of users.
Below is a summary of the forces that drive the demand for E&IT
that is accessible to a wide range of users.
Disability
Census 2000 counted 54 million people in the United
States with some type of long-lasting condition or disability (NCD,
2004). These individuals represented 19.3 percent of the 257.2 million
people who were age five and older in the civilian, noninstitutionalized
population. This is nearly one in five people. This includes a wide
range of disabilities, not all of which preclude the use of E&IT.
Within this population, Census 2000 found
• 9.3 million (3.6 percent) with a
sensory disability involving sight or hearing
• 21.2 million (8.2 percent) with a
condition limiting basic physical activities, such as walking,
climbing stairs, reaching, lifting, or carrying
• 12.4 million (4.8 percent) with a
physical, mental, or emotional condition causing difficulty in
learning, remembering, or concentrating
• 6.8 million (2.6 percent) with a
physical, mental, or emotional condition causing difficulty in
dressing, bathing, or getting around inside the home
• 18.2 million of those age 16 and
older with a condition that made it difficult to go outside the
home to shop or visit a doctor (8.6 percent of the 212.0 million
people this age)
• 21.3 million of those age 16 to 64
with a condition that affected their ability to work at a job
or business (11.9 percent of the 178.7 million people this age)
The design of E&IT products and services that
are accessible to people with disabilities appeals to the wider
population as well. Accessible design can significantly enhance
the sales of a product. For example, all of the following commonly
used products were first developed in support of people with disabilities
and are now used by the wider population:
• Auto-dialers
• Flatbed scanners
• Microphones
• Speech recognition
• Speech synthesis
• Talking ATMs
• Talking caller-ID
• Vibrating pagers
Age
Thirty-six million consumers 65 years of age and
older are living in the United States (Population, 2003). People
65+ years of age are often unable to see, hear, think, or move about
as easily as they did when they were younger. In order to enable
people 65+ years of age to access and use E&IT, these differences
must be accommodated. In addition, 52 percent of people 65+ years
of age have some type of disability. Thirty-three percent of persons
65+ years of age have a severe disability. By 2030, there will be
about 70 million older persons. People 65+ are expected to grow
to 20 percent of the population by 2030 (Administration on Aging,
2002). Furthermore, individuals who are accustomed to operating
IT will demand accessible IT as their functional capabilities diminish.
Language
Language is a driving force in today’s market
for more accessible E&IT. According to Global Reach, 262 million
English-speaking people are online. Non-English-speaking populations
online are 474 million. By the end of 2005, the ratio of English/non-English
speaking users will decrease significantly (Global Reach, 2003).
Sixty-four percent of people who visit the Internet
seek sites in languages other than English (Global Reach, 2003).
In a world where International Data Corporation (IDC) predicted
that Internet spending outside the United States would exceed $914
billion in 2003 (IDC, 2000), effective Web-site globalization is
the next imperative of Internet enterprises. Despite the vast international
opportunities projected, few U.S. companies appear poised to take
advantage of them. More than half (55 percent) of U.S. companies
do nothing to customize their Web sites for foreign visitors; less
than one-quarter even allow a choice of language, according to recent
IDC Internet Executive ePanel research. With such minor globalization
efforts, it is not surprising that 72 percent of U.S. companies
that are online currently draw 10 percent or less of their e-commerce
revenue from outside the United States. To increase their e-commerce
revenue, companies must strive to design Web sites that are accessible
to the non-English-speaking population.
Literacy
The Workforce Investment Act of 1998 defines literacy
as “an individual’s ability to read, write, speak in
English, compute, and solve problems at levels of proficiency necessary
to function on the job, in the family of the individual, and in
society.”
The International Adult Literacy Survey (Adult Literacy
Survey, 2003) was a 22-country initiative conducted between 1994
and 1998. In every country, nationally representative samples of
adults between the ages of 16 and 65 were interviewed and tested
at home using the same literacy test. The main purpose of the survey
was to find out how well adults use information to function in society.
Another aim was to investigate the factors that influence literacy
proficiency and to compare these factors among countries.
According to the National Institute for Literacy
(n.d.), “Very few adults in the U.S. are truly illiterate.
Rather, there are many adults with low literacy skills who lack
the foundation they need to find and keep decent jobs, support their
children’s education, and participate actively in civic life.”
According to the National Adult Literacy Survey (NALS), between
21 and 23 percent of the adult population, or approximately 44 million
people, scored at literacy proficiencies between 0 and 20 percent.
Another 25–28 percent of the adult population, or between
45 and 50 million people, scored at literacy proficiencies between
20 and 40 percent. Literacy experts believe that adults with skills
at these levels lack a sufficient foundation of basic skills to
function successfully in our society.
Many factors help to explain the relatively large
number of adults in the 0–20 percent category. Twenty-five
percent of adults in this category were immigrants who may have
just been learning to speak English. In addition, more than 60 percent
didn’t complete high school; more than 30 percent were over
the age of 65; more than 25 percent had physical or mental conditions
that kept them from fully participating in work, school, housework,
or other activities; and almost 20 percent had vision problems that
affected their ability to read print. A large percentage of the
population in the United States are at literacy proficiency less
than 40 percent. Design for individuals with limited literacy skills
also accommodates individuals who have learning disabilities or
cognitive disabilities that impact reading comprehension.
Learning Style
There are three major types of learning styles (Live
Text, 2000). They are visual, auditory, and kinesthetic (tactile).
Visual learners need to see a person’s body language and facial
expression to fully understand the content of what is being said.
They tend to prefer sitting at the front of a classroom, play, or
lecture hall to avoid visual obstructions (e.g., people’s
heads). They may think in pictures and learn best from visual displays,
including diagrams, illustrated textbooks, overhead transparencies,
videos, flipcharts, and handouts. During a lecture or classroom
discussion, visual learners often prefer to take detailed notes
to absorb the information.
Auditory learners learn best through verbal lectures,
discussions, talking things through, and listening to what others
have to say. Auditory learners interpret the underlying meanings
of speech through listening to tone of voice, pitch, speed, and
other nuances. Written information may have little meaning until
it is heard. These learners often benefit from reading text aloud
and using a tape recorder.
Tactile/kinesthetic learners learn best through a
hands-on approach, actively exploring the physical world around
them. They may find it hard to sit still for long periods and may
become distracted by their need for activity and exploration.
Enabling people to acquire information in the manner
most appropriate to their learning style(s) enhances the effectiveness
of E&IT and accommodates users with sensory disabilities.
Experience Level
Many people who are learning to use an application
on the Web for the first time want all the help they can get. There
will come a time, however, when the extra help is no longer needed
or desired. One of the benefits of accessible design practices is
having the ability to customize user interfaces based upon the wants,
needs, and preferences of individual users.
Legal Framework
Below is a summary of key laws, statutes, and standards
that have improved accessibility for individuals with disabilities
in this country. Each law is summarized, followed by a discussion
of who is primarily affected by the law and the approach toward
addressing accessibility issues that has been undertaken through
issuance of each law. These laws and standards are a driving force
in the market for accessibly designed products, as they set the
standards and guidelines for what must be done by the government
and industry to accommodate the needs of individuals with disabilities.
Section 508 of the Rehabilitation Act
Section 508 of the Rehabilitation Act of 1973 requires
that when federal agencies develop, procure, maintain, or use E&IT,
they must ensure that federal employees with disabilities have access
to and use of information that is comparable to the access and use
by federal employees who do not have disabilities unless an undue
burden (significant expenses or difficulties) is imposed on the
agency. The law also requires that individuals with disabilities
in the general public seeking information or services from a federal
agency have access to information and services comparable to that
provided to individuals without disabilities unless undue burden
is imposed on the agency. When compliance does impose an undue burden,
agencies must still provide disabled individuals with the information
and data by allowing them to use it by an alternative means of access
(e.g., captioning, audio description).
Section 508 covers E&IT such as computer hardware,
software, networks, ancillary equipment, firmware, technology services,
telecommunications products, information kiosks and transaction
machines, World Wide Web sites, multimedia, and office equipment
such as copiers and fax machines. Equipment that contains embedded
information technology used as an integral part of the product—but
the principal function of which is not the acquisition, storage,
manipulation, management, movement, control, display, switching,
interchange, transmission, or reception of data or information—is
not included under Section 508 (e.g., HVAC equipment and medical
equipment). As a guideline, E&IT systems can be considered to
be accessible to individuals with disabilities if they can be used
in a variety of ways that do not depend on a single sense or ability.
Section 508 has the potential to greatly improve
accessibility to E&IT for individuals with disabilities. The
Federal Government will likely become a better employer to the many
people with disabilities who work for it, as well as a model employer
for industry. In addition, members of the public with disabilities
will have greater accessibility to government information and services
related to technology.
Those affected directly by Section 508 include federal
departments and agencies and vendors who serve the Federal Government.
The initial impact is at the procurement stage. Section 508 must
be integrated into the procurement process by determining which
technical provisions from Section 508 apply in a given situation,
performing market research to determine the availability of products
and services that meet the applicable technical provisions, deciding
which technical provisions (if any) do not apply due to an exception,
and submitting technical specifications and minimum requirements
to a contracting officer.
Private companies and software developers are also
affected by Section 508. Although Section 508 does not require private
companies to alter their products, full implementation of the law
may provide an incentive for companies that want to do business
with the government to build better accessibility features into
their products. Currently, however, there is a perception by some
in industry that Section 508 conformance is being “rubber
stamped” by procurement officials and that the content of
documents describing Section 508 conformance, such as voluntary
product accessibility templates (VPATs), is not important as long
as it is merely offered. If Section 508 is fully addressed by procurement
officials, accessibility will become a key discriminator for federal
sales. Increased competition will raise the bar for hardware and
software vendors who want to create new and innovative solutions
to addressing accessibility issues. Software developers are impacted
by Section 508 in that they are now trying to integrate the applicable
Section 508 provisions into their entire software development life
cycle. Developers are faced with the challenge of either making
their software compatible with assistive technology or making software
products accessible without the aid of other AT.
In contrast to federal laws that take a push approach
toward improving the accessibility of E&IT by mandating that
new, better technologies are manufactured and adopted, Section 508
does not explicitly require the manufacturers to make their products
more accessible. Rather, Section 508 follows a pull approach, in
which the federal agencies are responsible for seeking better products
to address accessibility problems by procuring products that comply
with the provisions when such products are available in the commercial
marketplace or when such products are developed in response to government
solicitation.
Section 255 of the Telecommunications Act
Section 255 of the Telecommunications Act of 1996
requires telecommunications products and services to be accessible
to people with disabilities. This is required to the extent that
access is readily achievable. If manufacturers cannot make their
products more accessible, then they must design products to be compatible
with adaptive equipment used by people with disabilities when it
is readily achievable to do so.
Telecommunications products covered under this Act
include wired and wireless telecommunication devices, such as telephones,
pagers, and fax machines; products that have a telecommunication
service capability, such as computers with modems; and equipment
that carriers use to provide telecommunications services, which
includes the software integral to that equipment. Also included
are basic and special telecommunication services, including regular
telephone calls, call waiting, speed dialing, call forwarding, computer-provided
directory assistance, call monitoring, caller identification, call
tracing, repeat dialing, interactive voice response systems, and
voice mail.
The implementation of Section 255 of the Telecommunications
Act stands to improve access and the number and range of accessible
products in the telecommunications industry. Companies that manufacture
telecommunications products or provide telecommunications services
are expected to shift toward a more universal, inclusive design
process in the development of new products and services. Those affected
by Section 255 include manufacturers of telecommunications equipment
and customer premises equipment, as well as the providers of telecommunications
services. Companies must research ways to make their products more
accessible and provide training for their staff on accessibility.
Manufacturers must modify their design processes to ensure that
accessibility and usability are considered in the earliest design
phases of a product. The law has been beneficial to manufacturers
and service providers in that they have found that in making products
easier to use for people with disabilities, they often make them
easier to use for everyone.
The implementation of Section 255 takes more of a
push approach toward improving accessibility. The Act lays out a
set of guidelines that manufacturers must follow in designing new
products and services in this industry. Companies are advised to
use these guidelines and implement training procedures as specified
by the law. Section 255 is related to Section 508 of the Rehabilitation
Act in that the U.S. Access Board has incorporated the language
of the guidelines specified in Section 255 into the 508 standard.
Using consistent language has enabled companies to develop products
that meet both the design requirements for manufacturers and the
procurement requirements for federal agencies.
Hearing Aid Compatibility Act
The Hearing Aid Compatibility (HAC) Act of 1988 requires
that the Federal Communications Commission (FCC) ensure that all
telephones manufactured or imported for use in the United States
after August 1989, as well as all “essential” telephones,
are hearing aid compatible. “Essential” telephones have
been defined as coin-operated telephones, telephones provided for
emergency use, and other telephones frequently needed for use by
persons with hearing aids. This includes telephones in the workplace,
in confined settings like hospitals or nursing homes, and in hotel
or motel rooms.
Telephone manufacturers are directly affected in
that they must ensure that they design phones with volume control
and other features for those users with hearing aids. Owners of
hospitals, hotels, and other places with “essential”
telephones must ensure that they purchase telephones for their buildings
that are hearing aid compatible. Employers must ensure that all
telephones in both common and noncommon areas in their workplace
are hearing aid compatible and that any new telephones they purchase
are hearing aid compatible.
Unlike Section 255 of the Telecommunications Act,
under which companies must ensure that their products are accessible
to hearing aid users only if it is readily achievable for them to
do so, this requirement is absolute under the HAC Act. This law,
like Section 255 of the Telecommunications Act, takes a push approach
in mandating that corporations and business owners purchase telephones
that are hearing aid compatible and that the FCC ensures that all
essential telephones and telephones manufactured or imported for
use in the United States are hearing aid compatible.
Americans with Disabilities Act
The Americans with Disabilities Act (ADA) of 1990
recognizes and protects the civil rights of people with disabilities.
It provides protection from discrimination of individuals on the
basis of disability. Covered under ADA are a wide range of disabilities,
and a person with a disability is defined as anyone with a physical
or mental impairment that substantially limits one or more major
life activities. These include physical conditions that affect mobility,
stamina, sight, hearing, and speech, as well as emotional illnesses
and learning disorders. ADA addresses access of individuals with
disabilities to the workplace (Title 1), state and local government
services (Title 2), and places of public accommodation and commercial
facilities (Title 3). In addition, phone companies are required
under ADA to provide telecommunications services for people who
have hearing or speech impairments (Title 4).
Title 1, which deals with employment of individuals
with disabilities, requires that employers do not discriminate against
qualified individuals with disabilities and that employers reasonably
accommodate the disabilities of qualified applicants and employees
by modifying work stations and equipment unless undue burden should
result in doing so. Title 2, which deals with public services, requires
that state and local governments do not discriminate based on disability
and that they ensure that their buildings are accessible, that new
and altered streets and pedestrian walkways contain curb cuts at
intersections, and that each service or program is operated so that
it is readily accessible to and usable by individuals with disabilities.
In addition, this title requires that transit facilities, buses
and rail vehicles, key stations in rail systems, Amtrak stations,
and vehicles for demand response systems be made accessible unless
certain exceptions are met. Title 3, which deals with public accommodations,
requires that restaurants, hotels, theaters, shopping malls, retail
stores, museums, libraries, parks, private schools, and day care
centers, among other places of public accommodation, do not discriminate
based on disability. Any alterations to existing places of public
accommodation are required to be done in an accessible manner. In
addition, new busses for specified public transportation must be
accessible, and elevators must meet certain conditions. Title 4,
which covers telecommunications, states that telephone companies
must provide telecommunications relay services for hearing-impaired
and speech-impaired individuals 24 hours per day.
ADA has had a significant impact on American society,
allowing individuals with disabilities to pursue opportunities that
were not available to them in the past. One of the largest groups
affected by ADA are the employers of individuals with disabilities.
If an employer fails to comply with ADA, the employee can sue, forcing
the company to comply or pay damages. Thus, employers face the pressure
of ensuring that their workplaces are accessible and that they do
not discriminate against any qualified applicants on the basis of
disabilities. In addition, state and local government bodies, educational
institutions, and virtually all places of public accommodation or
employment are directly affected by ADA and must comply with the
regulations. The Annenberg Washington Program, a nonprofit institution
in communication studies, met in 1994 and expanded upon a previously
published White Paper in which it stated in its initial findings
that the average cost of most ADA accommodations is approximately
$36, a much lower amount than many anticipated. It found that the
impact of ADA on American businesses did not create onerous legal
burdens, as many believed would be the case, but rather has provided
a framework for employers and employees for dispute avoidance and
resolution. Overall, ADA has had a positive impact on society.
ADA has also taken a push approach toward addressing
issues of accessibility. The push is for the businesses and organizations
themselves to devise solutions based on the requirements set forth
in ADA.
Electronic Industries Alliance (EIA) Standards:
EIA-608 and EIA-708
The EIA-608 standard specifies the use of closed
captions in analog TV signals. EIA-608 arose to address the lack
of standards for Line 21 closed captioning, to ensure that new decoders
would all work the same way and that captioners could create captions
that would appear in a consistent and predictable manner on every
TV set. The Television Data Systems Committee of the EIA enhanced
the Line 21 system by adding new characters and assigning codes
that would allow the center of the screen to be used for captioning.
It also allowed roll-up captions, for the first time enabling real-time
captions to be placed somewhere other than the bottom of the screen.
This work became known as the EIA-608 standard, with which all captioning
software and all TV receivers built from July 1993 forward were
required to meet and comply.
When digital television (DTV) was developed, a new
need arose for the ability to change the size of the caption display—to
make the captions either larger and more readable or smaller and
less obtrusive. The conversion of closed captions for service with
digital was necessary. This need could not be accommodated in the
EIA-608 standard, and thus the EIA-708 standard was introduced.
The current version, EIA-708B, covers two areas. It defines how
captioned data is to be encoded and transmitted, known as the transmission
protocol or transmission layer. It also defines where in a DTV signal
the caption data are to be placed, the bandwidth allocated, and
the format of the data. The second area addressed is the display
protocol, which determines how captions are displayed on the screen
of a DTV. The 708 captioning format was designed to allow for the
use of the entire unicode set, which includes every character in
the alphabet in any language plus the complete range of symbols.
Almost any program can thus be captioned.
Many groups are affected by the introduction of the
EIA-708 standard. The Decoder Circuitry Act of 1990 stated that
“[d]igital television receivers and tuners must be capable
of decoding closed captioning information that is delivered pursuant
to the industry standard EIA-708-B.” This Act required the
FCC to update its rules for decoders as new technologies like DTV
developed. Television broadcasters are also largely affected by
the new 708 captioning format because the pressure is building to
produce new programming with digital closed captions based on this
standard. Broadcasters and producers must begin devising plans to
make this move and invest in the equipment they will need to do
so. Also very largely affected are the viewers with auditory impairments
who will benefit from much greater flexibility and a higher quality
of captioning with the EIA-708 standard.
A push approach toward the development of a new standard
was taken in the movement from EIA-608 to EIA-708 captioning. After
developing the new standard, the EIA has put the responsibility
on the broadcasters and producers to comply with these standards
in their captioning. This push to move from EIA-608 (analog) to
EIA-708 (digital) has brought many improvements to closed captioning.
Television viewers can now control the size of the caption text.
In addition, EIA-708 offers more letters and symbols, support for
multiple fonts and text and background colors, and allows for the
viewer to replace the traditional black box background with a colored
box or do away with it entirely. Also, EIA-708 increases the data
rate by 16 times over that allowed by EIA-608, permitting DTV captions
to contain much more information. However, most DTV content currently
still relies on the EIA-608 standard captions that have been converted
to the EIA-708 format because the consumer base of DTV receivers
is not high enough to justify the added expense of native EIA-708
encoding.
Individuals with Disabilities Education Act
The Individuals with Disabilities Education Act (IDEA)
was first enacted in 1975. The Act was passed to ensure that students
with disabilities receive free, appropriate public education and
the related services and support they need to achieve in the least-restricted
environment appropriate for their individual needs. IDEA was created
to help states and school districts meet requirements for educating
children with disabilities and to pay part of the expenses of doing
so. IDEA consists of three parts: Part B provides grants to states
for services for preschool and school-age children, Part C funds
early intervention services for infants and toddlers, and Part D
supports national activities to improve the education of children
with disabilities, including research and professional development
programs.
IDEA covers children with disabilities until they
graduate from high school or until they are 22 years of age if graduation
is delayed. Students who may fall under the Act are evaluated once
the possibility of a disability is raised. If it is determined that
the student does have a disability covered by IDEA, the school is
required to annually develop an individualized education program
(IEP) for the student, followed by placement in a regular classroom
setting when possible. Since its initiation, a set of amendments
made in 1997 has shifted the focus of IDEA from merely providing
children with disabilities access to an education to improving results
for all children in the education system.
The primary group affected and benefiting from IDEA
is children with disabilities. As a result of IDEA, students with
disabilities now learn among their peers. U.S. Senator Jim Jeffords
reports that since the initiation of IDEA, dropout rates for students
with disabilities have significantly gone down and graduation rates
have gone up. The percentage of college freshmen with disabilities
has tripled as a result of the improved education children with
disabilities have available to prepare them for college. Teachers
and parents of children with disabilities are also largely affected
by IDEA. These two groups play a large role in the development of
a child’s IEP. Teachers have also had to adjust to having
children with and without disabilities in the same classroom, learning
together. Others involved in the public education system, including
both state and local educators, are certainly affected as well.
The enactment of IDEA has followed a push approach
in requiring that public schools make a free education available
to students with disabilities that adheres to the provisions set
forth in the Act. The legislation places the responsibility upon
the schools and provides them with the requirements they must meet,
while providing some of the monetary means to do so.
Instructional Material Accessibility Act
The purpose of the Instructional Material Accessibility
Act (IMMA) of 2003 is to improve access to printed instructional
materials used by persons who are blind and other persons with print
disabilities in elementary and secondary schools. The Act accomplishes
this through the creation of an efficient system for the acquisition
and distribution of instructional materials in the form of electronic
files suitable for conversion into a variety of specialized formats.
The IMAA requires one national file format and a single national
repository for files, which simplifies the process of obtaining
materials for students with disabilities. Having a national file
format will make the conversion process for producing specialized
formats more efficient by reducing the amount of human intervention
necessary. Having one national file format will make it easier for
states, publishers, Braille software developers, and Braille transcribers
to work with files. Braille transcribers will have more time to
use their expertise in formatting and proofing files, leading to
high-quality Braille. Students will directly benefit because the
national file format will eliminate needless steps in scanning and
reformatting files. Teachers will benefit as well by having materials
available in specialized formats for their students who have disabilities
at the same time they are available to their other students. State
and local education agencies that receive federal funding under
the IDEA play a large role under the IMAA. They are responsible
for developing a statewide plan within two years of the enactment
of the IMAA to ensure that printed materials required for instructional
use in the classroom at elementary and secondary schools are available
in specialized formats to individuals with disabilities at the same
time they are made available to students without disabilities.
This Act is a push approach toward improving access
to printed instructional materials for visually impaired students.
The IMAA requires all the states to adopt the national file format.
Video Description Restoration Act
The Video Description Restoration Act (VDRA), currently
pending in Congress, would restore the FCC’s video description
rules, which were overturned in federal court on November 8, 2002.
The Act would guarantee TV access for individuals who are blind
or visually impaired through video description. The FCC would be
expressly granted authority to restore its minimum requirements,
with increased access over time. Those minimum requirements were
that the major networks and cable channels in the top 25 television
markets present at least four hours of described programming per
week, and that video-described programs be made available where
TV stations not in the top 25 markets have the equipment to do so.
The VDRA has been rigorously supported by the American Council for
the Blind, as well as other blind and deaf organizations because
they feel that in many ways video description is for people who
are blind what closed captioning is for individuals who are deaf.
The community of people who are blind or visually
impaired will benefit from the VDRA by once again having video description
available to them, which affords them the same access to information
on television as sighted viewers. Also affected would be the television
program providers and owners, who would be required to offer video
description for a portion of their programming. VDRA permits an
exemption if the provision of video description would be unduly
burdensome to the provider or owner, or if video description is
not necessary to achieve video programming accessibility by persons
who are blind or otherwise visually impaired.
The VDRA would restore the FCC’s rule for the
minimum requirements major networks and cable channels must meet
in terms of the amount of video description they provide. This push
approach taken by the FCC would ensure that at least a portion of
programs would be made available for the visually impaired through
video description. The number of hours of video description mandated
by the FCC may grow larger, leading to increased access to television
programming for the visually impaired over time.
Standards and Guidelines
In addition to the laws and statutes mentioned in
the previous section, additional standards and guidelines are driving
more accessibly designed E&IT. They are discussed below.
ADA Accessibility Guidelines
The Access Board’s guidelines issued under
ADA are to be completely updated and revised. The ADA Accessibility
Guidelines (ADAAG) cover the construction and alteration of facilities
in the private sector (places of public accommodation and commercial
facilities) and the public sector (state and local government facilities).
The accessibility guidelines issued under the Architectural Barriers
Act (ABA) primarily address facilities in the federal sector and
other facilities designed, built, altered, or leased with federal
funds. The guidelines under both laws are being updated together
in one rule that contains three parts: a scoping document for ADA
facilities, a scoping document for ABA facilities, and a common
set of technical criteria that the scoping documents will reference.
As a result, the requirements for both ADA and ABA facilities will
be made more consistent. The rule also includes new scoping and
technical provisions for accessible housing that derive from requirements
for “Type A” dwelling units contained in the 1998 edition
of the ICC/ANSI A117.1 standard, “Accessible and Usable Buildings
and Facilities.” Of specific interest is 4.34.5, Equipment
for Persons with Vision Impairments. Instructions and all information
for use must be made accessible to and independently usable by people
with vision impairments.
Telecommunications Act Accessibility Guidelines
On February 3, 1998, the Architectural and Transportation
Barriers Compliance Board (Access Board) issued its final guidelines
for the accessibility, usability, and compatibility of telecommunications
equipment and customer premises equipment covered by Section 255
of the Telecommunications Act of 1996 (Telecommunications Act Accessibility
Guidelines, 1998). The Act requires manufacturers of telecommunications
equipment and customer premises equipment to ensure that the equipment
is designed, developed, and fabricated to be accessible to and usable
by individuals with disabilities, if readily achievable. When it
is not readily achievable to make the equipment accessible, the
Act requires manufacturers to ensure that the equipment is compatible
with existing peripheral devices or specialized customer premises
equipment commonly used by individuals with disabilities to achieve
access, if readily achievable.
Web Content Accessibility Guidelines 1.0
The Web Content Accessibility Guidelines 1.0, 1999,
explain how to make Web content accessible to people with disabilities.
The guidelines are intended for all Web content developers (page
authors and site designers) and for developers of authoring tools.
The primary goal of these guidelines is to promote accessibility.
However, following them will also make Web content more available
to all users, no matter what user agent they are using (e.g., desktop
browser, voice browser, mobile phone, automobile-based personal
computer, etc.) or constraints they may be operating under (e.g.,
noisy surroundings, under- or over-illuminated rooms, in a hands-free
environment, etc.). Following these guidelines will also help people
find information on the Web more quickly. These guidelines do not
discourage content developers from using images, video, etc., but
rather explain how to make multimedia content more accessible to
a wide audience.
Authoring Tool Accessibility Guidelines 1.0
The Authoring Tool Accessibility Guidelines 1.0,
2000, provides specifications for Web authoring tool developers.
Its purpose is two-fold: to assist developers in designing authoring
tools that produce accessible Web content and to assist developers
in creating an accessible authoring interface. Authoring tools can
enable, encourage, and assist users (i.e., authors) in the creation
of accessible Web content through prompts, alerts, checking and
repair functions, help files, and automated tools. It is just as
important that all people be able to author content as it is for
all people to have access to it. The tools used to create this information
must therefore be accessible. Adoption of these guidelines will
contribute to the proliferation of Web content that can be read
by a broader range of readers and authoring tools that can be used
by a broader range of authors.
User Agent Accessibility Guidelines 1.0
User Agent Accessibility Guidelines 1.0, 2002, is
for designing user agents and is intended to lower barriers to Web
accessibility for people with disabilities (visual, hearing, physical,
cognitive, and neurological). User agents include hypertext markup
language (HTML) browsers and other types of software that retrieve
and render Web content. A user agent that conforms to these guidelines
will promote accessibility through its own user interface and through
other internal facilities, including its ability to communicate
with other technologies (especially assistive technologies). Furthermore,
all users, not just users with disabilities, should find conforming
user agents to be more usable. In addition to helping developers
of HTML browsers and media players, this document will benefit developers
of assistive technologies because it explains what types of information
and control an AT may expect from a conforming user agent. Technologies
not addressed directly by this document (e.g., technologies for
Braille rendering) will be essential to ensuring Web access for
some users with disabilities.
XML Accessibility Guidelines
The XML Accessibility Guidelines, 2002, from the
World Wide Web Consortium (W3C) provides guidelines for designing
extensible markup language (XML) applications that lower barriers
to Web accessibility for people with disabilities (visual, hearing,
physical, cognitive, and neurological). XML, used to design applications
such as XHTML, SMIL, and SVG, provides no intrinsic guarantee of
the accessibility of those applications. This document explains
how to include features in XML applications that promote accessibility.
Customer Analysis
The purpose of this section is to highlight the consumer
markets targeted by the industries being studied. A more detailed
customer analysis can be found in the appendix to the online version
of this report.
People with Disabilities
Estimates vary greatly on the number of persons with
disabilities living within the United States and worldwide. The
latest Census Bureau’s disability statistics report, Characteristics
of the Civilian Noninstitutionalized Population by Age, Disability
Status, and Type of Disability: 2000, estimates that 49.7 million
people with disabilities live in the United States (Age Structure,
2003). Applying the disability percentages presented in this report
to the age structures categorized by the World Factbook (including
populations less than 5 years of age) results in a figure of 54
million. This is often cited as the actual number of people with
disabilities living in the United States, and it is the figure reported
by NCD (2004). Comparing the U.S. disability statistics with those
of other countries indicates that China, India, Russia, Mexico,
and Turkey have greater instances of disabilities for any age category
because they have poorer health care than the United States. The
market for universally designed products and services seems clear
when global disability statistics (498 million people) are analyzed
for these countries, which currently have the top five emerging
markets. A detailed look at these emerging markets can be found
in the appendix to this report online.
The specific customer populations of interest for
the purpose of this study are people with the following disabilities
or conditions:
• Low vision
• Blind
• Hard of hearing
• Deaf
• Upper-mobility impaired
• Lower-mobility impaired
• Cognitive
Each of the above conditions is defined in terms
of a loss of functional capability that may be temporary, be permanent,
or develop as a natural part of the aging process. The functional
limitations may be caused by genetics, disease, traumatic injury,
aging, environmental or situational factors or by some combination
of multiple factors. In other words, the analysis is not restricted
to functional limitations resulting from what is traditionally termed
a disability. This approach, espoused by the functional model of
disabilities (Kaplan, n.d.), allows us to consider a wide segment
of the population who could truly benefit from UD.
It is important to understand the functional capabilities
and limitations of the target population in order to properly access
the impact of various accessibility features on mainstream products.
Each of the target populations have different functional capabilities
and limitations and thus experience different issues with the product
lines under study.
Visual Impairments
Approximately 10 million people are blind or visually
impaired in the United States, and about 6 million in the European
Union (EU). Visual impairments include blindness, partially sighted,
low vision, and color blindness. In addition to medical conditions
that impact vision, visual perception may be affected by distraction
from a busy, cluttered visual environment; visual fatigue; colored
or high- or low-lighting conditions; and adverse weather conditions.
Users with visual impairments may encounter great difficulty or
find it impossible to complete the following types of tasks:
• Locating equipment
• Locating commands/devices
• Identifying commands/devices
• Using touchscreens
• Reading text on a screen
• Selecting objects on a screen
• Receiving graphics and video information
• Receiving visual alerts and signals
• Inserting cards/coins/media
• Reading printed material, including
instruction manuals
In general, people with impaired vision may have
difficulty perceiving visual detail, focusing on objects either
close up or at a distance, separating objects that do not have sufficient
contrast, perceiving objects in both central and peripheral vision,
perceiving color and contrast brightness, adapting to different
light levels, tracking moving objects, and judging distances (Story,
Mueller, and Mace, 1998).
Hearing Impairments
More than 24 million people in the United States
and about 22 million people in the EU have a significant loss of
hearing. Hearing impairments include deafness, hard of hearing,
conductive hearing loss, sensorineural hearing loss, and mixed hearing
loss (both conductive and sensorineural). In addition to medical
conditions that impact hearing, auditory perception may be affected
by attending to multiple sound sources, functioning in loud environments,
and using headphones. Users who are deaf or hard of hearing may
encounter great difficulty or find it impossible to complete the
following tasks:
• Receiving audio information
• Understanding speech information
• Receiving acoustic alerts and signals
• Using speech input
In general, people who are deaf or hard of hearing
may have difficulty localizing the source or direction of sound,
filtering out background sound, perceiving both high- and low-pitched
sounds, and carrying on a conversation (Story, Mueller, and Mace,
1998).
Mobility Impairments
More than 40 million people in the United States
and about 32 million people in the EU have a significant loss of
mobility. Mobility impairments can include the following symptoms:
tremors and spasticity, paralysis and partial paralysis, amputation,
and loss of coordination and strength. In addition to medical conditions
that impact mobility, mobility may be affected by pain, fatigue,
availability of only one hand or arm while the other is occupied
with another task, wearing thick clothing or gloves, small hands,
wet or oily hands, and adverse environmental conditions (e.g., bad
weather or uneven terrain). Users with mobility impairments may
encounter great difficulty or find it impossible to complete the
following tasks:
• Using switches
• Lifting/holding devices and handsets
• Using dials
• Using numeric keypads
• Writing with a keyboard
• Handling a pointing device
• Using a touchscreen
• Inserting cards/coins/media
• Handling printed manuals and books
• Accessing equipment
In general, people with impaired mobility may have
difficulty with tasks requiring range of motion, coordination, strength,
and balance. More specifically, difficulties may be apparent in
the following areas: reaching, pushing, pulling, lifting, lowering,
carrying, grasping, squeezing, rotating, twisting, and pinching
(Story, Mueller, and Mace, 1998).
People with Cognitive Disabilities
More than 12 million people in the United States
and 9 million in the EU have a significant cognitive disability.
Cognitive disabilities can include dyslexia, cerebral palsy, retardation,
and severe learning disabilities. In addition to medical conditions
that impact cognition, cognitive processing may be affected by a
limited vocabulary or grammar, limited literacy, cultural or language
differences, and fatigue or distraction. Users with cognitive disabilities
may encounter great difficulty or find it impossible to complete
the following tasks:
• Writing on a keyboard
• Reading text on a screen
• Reading printed material
• Understanding speech information
• Handling a pointing device, such
as a mouse
• Navigating complex menu structures
• Responding quickly
In general, people with impaired cognition may have
difficulty “…receiving, comprehending, interpreting,
remembering, or acting on information.” More specifically,
difficulties may be apparent in the following areas: beginning a
task without a prompt or reminder, responding within an appropriate
time frame, concentrating, comprehending visual or auditory information,
understanding or expressing language, following procedures or doing
things in order, organizing information, remembering things, making
decisions and solving problems, and learning new things or doing
things a new or different way (Story, Mueller, and Mace, 1998).
Individuals 65+ Years of Age
Approximately 36 million people 65+ years of age
are living in the United States (Population, 2003). In the top five
international emerging markets, this number increases to 174 million
consumers. Aging populations cannot see, hear, think, or move about
as easily as younger generations. Fifty-two percent of people 65+
years of age experience one or more of the following (U.S. Census
Bureau, 1997 and Telecommunications Industry Association, 1996):
• Decreased visual acuity
• Reduced powers of accommodation
• Decreased contrast sensitivity
• Increased sensitivity to glare
• Longer dark-adaptation times
• Decreased color vision and discrimination
• Hearing impairments
Consumers Living in Low-Bandwidth Information Infrastructures
It is not uncommon for people living in the United
States to take the Internet, and the bandwidth that comes with it,
for granted. The United States and Canada have the technical capacity
to provide bandwidth of 1,182 Mbps per capita (Haub, 2003). Developers
of Web-based content targeted for use by U.S. and Canadian consumers
do not necessarily need to concern themselves with limited bandwidth.
In comparison, Asia only has 21 Mbps of bandwidth available per
capita (Light Reading, 2002). Five billion consumers live within
low-bandwidth infrastructures. This provides a significant business
incentive to design Web-based content that is accessible, usable,
and useful from within low-bandwidth infrastructures.
People Who Never Learned To Read
Seven million people who never learned to read live
in the United States. Compare this to the 439 million consumers
who never learned to read living in the five countries with the
highest potential emerging markets. People who are not able to read
cannot use automated teller machines (ATMs), personal digital assistants
(PDAs), or the Web unless they are designed with access in mind.
People who never learned to read can benefit significantly from
voice dialing and talking ATMs (Literacy Demographic Data, 2003).
Users of English as a Second Language
The number of people believed to speak English as
a second language is around 300 million. Users of ESL are individuals
whose mother tongue is not English, but who live in countries where
English has official or joint official status. In these instances,
English is often used to conduct official business. English is the
official or joint official language of more than 70 countries.
Approximately 375 million people speak English as
a first language, and approximately 750 million speakers learned
English as a foreign language (ESL Online Education and Training,
2000). In 2000, 28.4 million foreign-born people resided in the
United States, representing 10.4 percent of the total U.S. population.
ESL programs are the fastest growing component of the state-administered
adult education programs. In 1997–98, 48 percent of enrollments
were in ESL programs, compared with 33 percent in 1993–94.
Of the 1997–98 ESL students in adult education, 32 percent
were in beginning ESL classes, 12 percent in intermediate, and 4
percent in advanced classes (National Institute for Literacy, 2003).
As evidenced by these statistics, the needs of users who are not
native-born English speakers must be considered when designing accessible
products.
Consumers Living in High-Density Populations
Population densities were calculated by dividing
the area of land of a given country (Area, 2003) by that country’s
population (Population, 2003). People per square kilometer is one
of the factors considered when calculating the average number of
people that will have to wait in line to use any given ATM, self-service
kiosk, or self-checkout point-of-sale device in a country. Canada
has three people per square kilometer of available land space. The
number of people per square kilometer living in the United States
is 31. This is 10 times that of Canada. On average, the transaction
time required when using an ATM or other self-service device needs
to be faster in the United States than in Canada if the ratio of
the number of self-service devices to size of geographical area
is the same. Designing for access can reduce transaction times and
increase customer satisfaction. Designing ATMs for faster use can
be a competitive advantage in emerging markets, where population
densities skyrocket. For example, in China there are 138 people
per square kilometer. In India, this number rises to 352.
High-Language-Density Populations
Large numbers of people live in areas where a large
number of languages are spoken, increasing the complexity of delivering
more accessibly designed interfaces. Twenty-five languages are spoken
by a minimum number of 750,000 people living in China. In India,
there are 54 languages (SIL, 2003). This poses a challenge to accessible
design. Companies must devise solutions to designing accessible
products for high-density-language populations that meet the needs
of all speakers.
Consumers in Situations That Reduce Sensory or Visual
Capabilities
Designing for access does more than just benefit
users with disabilities who desire accessibility features: UD practices
also benefit all consumers when they find themselves in various
situations that reduce their sensory or visual capabilities. For
example, one accessibility feature for cellular phones that is rated
as very important by users who are blind is voiced menu options.
In addition to making cell phones more accessible to individuals
who are blind, this feature benefits users driving in their cars
who would rather focus their visual attention and capabilities on
driving than on navigating through their cellular phone menus to
find a phone number or make a call. This feature also is important
in increasing the user’s safety in such situations.
Adjustable volume control is another important accessibility
feature for cellular phones that was designed with hard-of-hearing
users in mind and benefits all consumers. When a consumer is navigating
through a noisy environment such as a mall, construction site, or
airport, it is often hard to hear a phone ring or to hear the person
you’re talking to on the other end of the line. The volume-control
feature, initially marketed to a specific disability group, also
benefits all consumers, with or without a disability, who find themselves
in such a situation.
As another example, consider the design of buttons
for ATMs, cellular phones, and PDAs. Larger keypad buttons are an
important accessibility feature for individuals with low vision
or upper-mobility impairments. However, this feature has also appealed
to consumers whose dexterity is limited when they are wearing winter
gloves, for example. Larger keypad buttons make it easier for them
to withdraw money from an outdoor ATM or to make a phone call while
wearing gloves. In addition to larger buttons, larger displays on
cellular phones and PDAs, an accessibility feature marketed to users
with low vision, is another feature that benefits all consumers
who are, for example, operating a device at night or in a foggy
environment.
Accessibility features of televisions, such as closed
captioning, can be beneficial to any consumer who is at a noisy
party or watching a sports match in a restaurant, where their auditory
capabilities are limited.
These are just a few examples of situations in which
features that are designed with users with disabilities in mind
actually increase the accessibility and appeal of products for the
wider population. Companies should consider that when they design
for accessibility, they benefit from offering products that will
appeal to the general population as well as users with disabilities.
Analysis of the International
Market
The scope of this analysis includes countries in
addition to the United States. While it is natural for one to think
locally (the United States), industry is global. International (including
U.S.) business drivers for accessible design have far more impact.
The business justification for this approach lies in the fact that,
according to the Department of Commerce’s (DOC’s) Economic
and Statistics Administration, more than 95 percent of the world’s
economic activity takes place outside of the United States, and
the majority of the world’s market is untouched by most U.S.-based
businesses. Only 12 percent of U.S. businesses export their products,
although a much greater percentage of them are able to do so (Czinkota,
2001).
Information provided in this section of the report
was taken directly from 2004 country commercial guides (CCGs) prepared
by U.S. embassy staff. This section specifically focuses on the
section of each county’s guide that identifies the leading
sectors for U.S. exports and investments. CCGs are published once
a year and contain information on the business, economic situation,
and political climate of foreign countries as it affects U.S. business.
Each CCG contains the same chapters and an appendix that includes
topics such as marketing, trade regulations, investment climate,
and business travel.
Economic activity is not the same as gross domestic
product (GDP). The term economic activity, as used by the DOC, represents
the value of total imports and exports for a given country for a
given year. Total U.S. imports plus total U.S. exports for 2002,
expressed as a percentage of GDP, was less than 5 percent. U.S.
imports for 2002 totaled $1.165 trillion. Total exports were $682
billion. The combined total was $1.847 trillion. Divide this by
$49 trillion, the world’s GDP, and that is how DOC expresses
this particular metric. If you compare apples to apples, world economic
activity for 2002 was $12.6 trillion. Divide this into $1.84 trillion,
and U.S. economic activity was 14.7 percent of world economic activity
in 2002.
The countries targeted for this study were not selected
based upon market potential alone. They were also selected based
upon the level of U.S. corporate investment in each of the five
emerging market countries covered in this report; that is, investments
that support the establishment of long-term business relationships.
Between 1990 and 2002, foreign direct investment (FDI) in the five
emerging market countries exceeded US$614 billion (Kearney, 2002).
Four-fifths of the world’s population lives in developing
countries. The top 15 highest potential emerging markets account
for 28.6 percent (US$14 trillion) of the world’s gross domestic
product (US$49 trillion). The door to emerging trade opportunities
is being opened by the increasing need for high-technology products
and other capital equipment. Supporting the growth, prosperity,
and independence of developing countries implies the use of information
technology. These technologies include telecommunication, education,
and banking infrastructures. According to Subhash Bhatnagar (n.d.)
of the World Bank, technology is a critical success factor in enabling
developing governments to reach out to their citizens for the following
purposes:
• Improving delivery of services to
citizens
• Improving communications between government
and industry
• Empowering citizens by providing access
to knowledge and information
• Making the workings of government
more efficient, cost-effective, successful, and self-sustaining
If the people living in developing countries are
not able to access and use the technologies fundamental to that
country’s growth and prosperity, that country will not succeed
in achieving acceptable qualities of life, independence, or employability
for its citizens.
The emerging markets selected to be part of this
analysis are made up of the top five developing countries, with
the highest populations, determined by GlobalEDGE (2003) as having
the highest overall market potential. These countries are China,
India, Russia, Mexico, and Turkey.
China (China, 2003)
China: Information Technology (IT)
China is home to one of the largest and fastest growing
IT markets in the world. According to statistics released by the
Ministry of Information Industry (MII), the 2002 total sales value
for E&IT products was US$169.5 billion, an increase of 17.8
percent over the previous year. This statistic refers to Chinese
imports. China imported approximately US$74 billion worth of IT
products in 2002. The total market size is estimated to be US$215
billion.
According to both government and private sector sources,
the demand for IT products is expected to maintain a high growth
level due to rapid economic development in China and high demand
driven by favorable national policy and growing consumer power.
The Chinese government is now pursuing a national
development strategy of “using informatization to drive industrialization
and using industrialization to promote informatization.” Current
national development policies give top priority to development of
the IT industry and encourage wide application of IT in all economic
and social fields. According to MII, in 2002, the domestic E&
IT industry output was US$206.98 billion, up 20.9 percent over the
previous year, which is almost three times the growth rate of China’s
GDP in the same period. This statistic refers to industry output.
As China continues to develop as a center for manufacturing,
and as foreign investment, the strength of local companies, and
the affluence of local consumers all continue to increase, information
products and services—ranging from business applications to
digital consumer products—will drastically increase in the
next 5 to 10 years. Major drivers of growth include China’s
e-government initiative, e-commerce development, and “two
pillars of the economy” initiative (i.e., the development
of national software and integrated circuit [IC] industries), as
well as China’s need to enhance its competitiveness across
all industrial sectors due to the rapid pace of globalization as
a result of its access to the World Trade Organization (WTO). The
2008 Olympic Games will also provide a strong impetus for growth
in demand of IT products and services in the next five years. It
is estimated that Beijing will spend close to US$3.6 billion on
IT infrastructure and systems to meet the needs of the Olympic Games.
As a concrete measure to implement its strategy of
using informatization to drive industrialization, the Chinese government
initiated an ambitious e-government program in 2001. According to
the China Center of Information Industry Development (CCID), a local
consulting firm, the Chinese government has thus far spent a total
of US$4.2 billion on e-government projects. In the next two to three
years, the compound growth rate of government spending on IT will
be 25.7 percent. More than US$12.1 billion will be spent on e-government
over the next five years.
Since the bursting of investment bubbles in dot-com
ventures, China’s Internet business market seems to have recovered
its vigor for growth. The three major portals, Sina.com, Sohu.com,
and Netease.com, all claimed to have made profits since the second
half of 2002. With short messaging service (SMS), online advertisement,
online gaming, and online trade, these major portals are finding
their way to sustainable and profitable business models. The progress
made by these portals is encouraging to e-commerce development,
which will create a huge demand for IT products, from hardware to
software and from system software to innovative applications and
services.
Driven by huge demand and facilitated by favorable
investment policies, China’s IC industry returned to a fast
track of growth in 2002. The growth in China’s IC market seems
to have caught the world’s attention. According to CCID, China’s
2002 IC market size reached US$21.54 billion, accounting for 15.3
percent of the world market. That said, currently, 85 percent of
China’s domestic IC demand is met by imports.
Although China is now playing a significant role
in electronics and information products manufacturing (total production
volume is believed to have surpassed that of Japan to become the
world’s second largest producer), it still lacks core technologies
for almost all the products it produces. For instance, China is
the top producer of mobile handsets, but core chips needed to produce
the phones must be imported. The same is true for other products,
including DVDs, high-end color TVs, computers, and monitors. Although
the government has promulgated policies to encourage the development
of IC and software, China’s heavy reliance on imports for
high-end chips, parts, and components for most of the electronics
and information products is not expected to significantly change
for as long as a decade. With leading technologies in almost all
fields of information technology, U.S. companies have a great advantage
in meeting the increasing market demand for high-valued-added chips,
devices, and components.
Other best prospects include production lines and
equipment for the manufacture of E&IT products, including semiconductors.
More and more world manufacturing capacity is moving to the country
where demand for highly sophisticated modern manufacturing lines
almost solely relies on imports from developed countries. For instance,
China is currently not capable of producing critical semiconductor
equipment for processing 0.18-micron chips. In this area, China
is two generations behind the latest world technological levels.
Demand for equipment and instruments for processing, packaging,
and testing chips will be met only by imports. Moreover, software
tools and intellectual property cores for designing chips appear
to provide good sales opportunities for U.S. companies.
Consumer electronics is another area of high growth.
According to CCID, China’s 2002 sales of digital cameras,
mobile storage devices (flash memory), MP3 players, and digital
video cameras increased more than 100 percent from 2001. PDAs are
also an area with deep potential for growth. U.S. companies have
a big role to play in supplying the operating system, core chips,
and production expertise for these products.
However, the key to succeeding in any of the above
“best prospects” markets is to localize your products.
Although there is great demand, U.S. suppliers are not the only
source. European and Asian competitors (e.g., Japan, Taiwan, and
Korea) are also trying to meet the demand. It is imperative that
U.S. companies understand the market and the specific needs/demands
of Chinese customers in order to take full advantage of the market.
Although U.S. companies still dominate much of the
high-end hardware market in China’s fast-growing computer
market—such as high-end servers, printers, routers, and network
equipment—their dominance is severely challenged by fledgling
local players such as Lenovo (the new brand name for Legend Corp.).
CCID’s 2002 statistics show signs of a maturing market, with
emphasis of demand shifting toward software and IT services. U.S.
companies such as IBM and HP and software giants Microsoft, Oracle,
Sybase, and BEA keep dominance on China’s system software,
platform software, applications, and IT consulting services market.
Table 1: China's Information
Technology Market
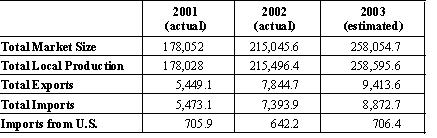
Notes: The above figures are calculated
in millions of U.S. dollars and represent unofficial estimates.
Trade numbers are based on Chinese customs figures for the HTS codes
8470–8473, 8517–8534, and 8540–8542. Local production
figures are from MII. The MII figures for export in 2002 were US$92.1
billion and US$65.2 for 2001; domestic sales figures were US$162.79
billion for 2002 and US$143.88 for 2001.
China: Telecommunications Equipment
China’s telecommunications industry continued
the momentum of rapid growth in 2002, despite the downturn in the
industry worldwide. At the end of May 2003, the total absolute number
of telephone users in China reached 462 million, among which 232
million were landlines subscribers and 230 million were cell phone
users. However, the penetration rates of fixed lines at 17.5 percent
and mobiles at 16.2 percent clearly indicate room for further growth.
In the five years since 1997, China’s telecommunications industry
registered an average annual growth rate of 20 percent.
In 2002, Chinese telecommunications carriers invested
US$25.4 billion in telecom infrastructure, compared with US$29 billion
in 2001. As a result, carriers were able to recruit 95.45 million
new telephone subscribers that year. Their aggregated revenue reached
US$55.36 billion, with China Telecom having a 32.5 percent share,
China Netcom 16.6 percent, China Mobile 37.4 percent, China Unicom
12.1 percent, and others (China Railcom and ChinaSat) 1.4 percent.
China’s MII, the most important government
regulator in the telecommunications industry, projected that Chinese
telecommunications carriers would invest US$25.5 billion in 2003
to recruit 33 million fixed line telephone subscribers and 52 million
cellular phone users. MII expects the fixed line penetration rate
to reach 19.4 percent by the end of 2003 and cellular penetration
rate to reach 20.1 percent.
The Chinese government is expected to grant third
generation (3G) licenses to four Chinese telecom operators in the
first half of 2004. Besides China Mobile and China Unicom, which
are the two incumbent mobile communication service providers, fixed
line operators China Telecom and China Netcom are also likely to
obtain such licenses.
A competitive market environment is taking shape
in China’s telecommunications sector. In 2004, China’s
six licensed basic telecom operators—China Telecom, China
Netcom, China Mobile, China Unicom, China Railcom, and ChinaSat—are
expected to expand and optimize their networks in order to meet
the growing need for telecommunications services. Moreover, they
are expected to compete against each other as well as potential
competitors from multinational companies that are planning to explore
business opportunities in this lucrative market.
It is important to recognize that, while the Chinese
government appears committed to fostering a more competitive telecommunications
service environment, this commitment does not necessarily mean that
equipment vendors with the best technology and/or lowest prices
will succeed in the Chinese marketplace. China’s telecommunications
equipment market is characterized by intense competition and a multitude
of complex, multilayered political and economic factors that must
be carefully and appropriately evaluated in order to achieve success.
MII is subject to oversight by the State Council.
MII was created in March 1998 by merging the Ministry of Posts and
Telecommunications with the Ministry of Electronics Industry (MEI).
Other influential government agencies in China’s telecommunications
industry include the State Council Informatization Office (SCITO)
and the National Planning and Reform Commission (NPRC). SCITO was
set up in August 2001 as an interagency coordinating body to oversee
China’s regulatory and commercial developments in the IT and
telecommunications sectors and implement the central government’s
policies and measures that drive information technologies. NDRC
is the approver of important and large projects.
In March 2003, former Party Secretary of Hebei Province,
Wang Xudong, replaced Wu Jichuan as the minister of MII. In May,
Minister Wang was also appointed the director of SCITO, replacing
Zeng Peiyan, who was promoted to serve as a State Councilor. Having
Wang as head of both MII and SCITO is a sign that the Chinese government
is moving to integrate its policies and strategies on telecommunications
and information industries.
China does not yet have a telecommunications law
in place. However, MII has promulgated telecommunications regulations
and regulations on foreign investment in the telecommunications
industry based on its WTO commitments. MII requires that most telecom
equipment, including terminal devices such as cellular phones, fixed
line phones, and fax machines and network products like switches
and base station equipment, be tested and certified. There are two
kinds of certificates: (1) type of approval (TA) for radio products,
and (2) telecom equipment network access license (NAL) for all other
products. MII’s Radio Regulatory Department tests radio products
and issues TA certificates, while MII’s Telecom Administration
Bureau issues telecom equipment NALs.
In addition, certain telecom products may also need
to obtain a CCC (China Product Compulsory Certification) mark from
China’s State General Administration of Quality Supervision
and Inspection and Quarantine (AQSIQ). For more information, please
visit AQSIQ’s Web site, www.aqsiq.gov.cn or www.cnca.gov.cn,
or go to the following Web page for frequently asked questions on
the CCC mark: http://www.mac.doc.gov/China/Docs/BusinessGuides/
CCCFAQ.htm.
Testing of products by the carriers is a must, even
if these products will be sold to local operators. Larger vendors
are advised to work directly with the carriers to sell their products,
while smaller firms may want to start with agents and distributors
that have the necessary resources, connections, and technical support.
China: Telecommunications Sub-Sectors
Mobile communications include the following 3G and
value-added service platforms:
1. Value-added capabilities for email and Web browsers
and the ability to download ringing tones, logos/images, music,
videos, games, and stock market quotations
2. Broadband access network equipment, including
wireless LAN, LMDS, and ADSL
3. Operational management systems like BOSS and multiple-service
platforms
Table 2: China’s Telecommunication
Equipment Market
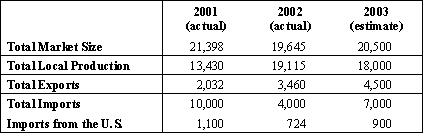
Note: The above figures are calculated
in millions of U.S. dollars. They are taken in part from MII’s
reported top 15 Chinese telecom vendors sales estimates and represent
unofficial estimates.
China: Software Market
China’s general computer market revenues increased
16 percent in 2002, totaling US$28.5 billion in sales. Of the overall
computer market revenues, hardware accounted for 67.2 percent, software
accounted for 14.6 percent, and information services accounted for
18.2 percent. According to February 2003 reports in the CCID Consulting
News, the software market will continue to post strong growth as
a result of a favorable domestic economy and the trend of industries
and enterprises toward China’s informatization.
Within the software market, applications software
accounted for 64.5 percent of the total market; middleware accounted
for 6.6 percent, representing a 2.9 percent increase compared with
same period last year; and platform software accounted for 28.9
percent. In line with China’s overall rapid development in
the IT sector, market competition has become more intense.
China: Best Prospects in Software
For the applications software market, China’s
domestic products are the fastest-growing segment.
• For the middleware market, the domestic
products and foreign products have an equal share.
• Foreign products monopolized the
system software market. In 2002, foreign products accounted for
a 95.3 percent market share. Foreign products should continue
to monopolize the high-end operating system, high-end server system,
database management system, and system networking management software
markets. These products will continue to be the leading sector
in the coming year.
China’s tenth five-year plan indicates that
the following software projects are the priorities:
• To develop security operation systems,
security authentication systems, and advance China’s e-commerce
solutions
• To develop information security software
packages that are based on LINUX operation systems
• To develop production platforms that
are based on the software structure and middleware structure
China’s successful bid for the 2008 Olympic
Games as well as its membership in the WTO will be the main drivers
for growth in the software market and industry over the next several
years. In 2003, the software tariffs were eliminated (reduced to
zero). Furthermore, China issued a number of policies ranging from
export incentives to value-added tax rebates and financial assistance
to small businesses, as well as laws addressing intellectual property
rights protection. If U.S. companies can gain good access to the
China market, the software market should have positive opportunities.
Table 3: China’s Packaged
Software Import and Export Market
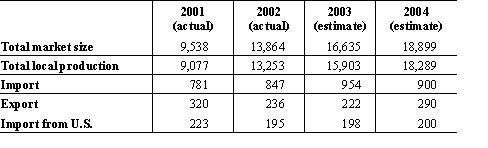
Notes: The above figures are calculated
in millions of U.S. dollars and are representatives of estimates
from the China Customs Import and Export data.
The above table is calculated based on HS codes 8524.31,
8524.39, 8524.40, 8524.91, and 8524.99; software downloaded from
the Internet is not included in the above table.
India (India, 2004)
India: Telecommunications Equipment
India’s 48 million-line telephone network is
among the top 10 networks in the world and the second largest among
the emerging economies, after China. India has one of the fastest-growing
telecommunications systems in the world, with system size (total
connections) growing at an average of more than 20 percent per annum
over the last four years. The network consists of more than 26,300
telephone exchanges, equipped with a capacity of nearly 48 million
lines and nearly 36 million working telephones. According to the
government of India telecom plan (1997–2007) prepared by Bharat
Sanchar Nigam Limited (BSNL), the demand for new telephone lines
during the period up to 2007 is estimated at 81.8 million. This
projected demand will necessitate approximately 64 million telephones
during the next eight years. BSNL and Mahanagar Telephone Nigam
Limited (MTNL) will provide about 43 million telephones, and private
operators will provide 21 million telephones. The industry is considered
as having the highest potential for investment in India. The growth
in demand for telecom services in India will be highest in basic
services, followed by national long distance, international long
distance, and the cellular services sectors.
India has a relatively low density of telephones,
4 per 100 persons, with plans to increase to 7 by 2005 and 15 by
2010. Tele-density in India rural areas is 0.5 per 100 people, and
the government plans to increase this to 4 per 100 by 2010. A total
of 500,105 out of 607,491 villages have been provided with a village
public telephone (VPT), i.e., one telephone per village. Considering
India’s population of 1 billion, it is estimated that to achieve
these objectives, approximately 78 million telephone connections
will be required by the year 2005, and 175 million telephone connections
by the year 2010. At current prices, this translates to an additional
investment of approximately $37 billion by 2005 and $68 billion
by 2010.
The total subscriber base of cellular phones is currently
at 13 million, up by 80 percent from the previous year. According
to Cellular Operators Association of India, it is estimated that
the subscriber base will reach 40 million by 2006 and 300 million
by 2010, thus resulting in huge opportunities for U.S. telecom equipment
vendors.
The installation base of direct exchange lines (DELs)
was at 37 million DELs in 2002 and is expected to grow to 82 million
DELs by 2007. DoT/MTNL will provide about 80 percent of DELs of
the additional DELs. It is estimated that each DEL will cost about
$900.
India has created a strong manufacturing base for
producing telecom products. Indian firms typically manufacture telecom
switches with technical and financial collaboration from foreign
firms. Around 19 Indian firms manufacture small- and medium-sized
switches, and 7 joint ventures produce large capacity switches.
Bharat Sanchar Nigam LTD (BSNL) and government-owned MTNL are the
largest end-users of telecom switches.
The annual growth rate of net-switching capacity
of the recently privatized BSNL for the period 1992–97 was
around 16–18 percent. However, the growth rate speeded up
after 1997, registering 22–24 percent annually.
Value-added service providers are growing by the
day and are demanding good infrastructure. Email, Internet services,
frame relay services, video conferencing, electronic data interchange,
and voice mail have been accorded value-added services status. These
value-added services interface with basic telecom services and increase
telecom traffic several fold. With the increased investment in the
value-added services, the demand for other switching products—such
as cellular switches, ISDN switches, gateway switches, and ATM switches—is
bound to grow sharply.
Digital switching system technologies of multinational
companies—Alcatel, Siemens, Fujitsu, Lucent, Ericsson, and
NEC—have been introduced in India. In addition, switching
systems based on the indigenous technology developed by the state-owned
Center for Development of Telematics (C-DoT) are also used.
The other promising sub-sectors, are shown in Table
4:
Table 4: Other Promising
Telecommunication Equipment Sub-Sectors

Table 5: Total Combined Market
for Telecommunications Equipment in India
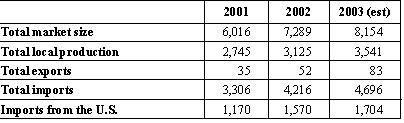
Notes: The data are in millions of
U.S. dollars, based on an exchange rate of $1 = INR 47.5. The data
are unofficial estimates.
India: Computers and Peripherals
The Indian computers and peripherals market is expected
to continue to expand to meet local demands. Private sector firms,
government offices, small- and medium-sized enterprises (SME’s),
and small office–home office (SOHO) users continue to computerize
their operations, contributing to the growth of the computer hardware
market.
The Indian software industry is enjoying a global
leadership position in software development and exports. Indian
software exports reached sales revenues of $10 billion, reflecting
30 percent growth over the previous year. Domestic IT sales revenues
also expanded during 2002–03, reaching $6.67 billion. The
growing Indian software and services sector continues to support
growth in the computer hardware sector.
IT-enabled services is another sector that witnessed
impressive growth. Existing projects are expanding and new ventures
are being established in India to capitalize on the highly skilled,
cost effective manpower. This sector witnessed impressive sales
revenue growth from $1.49 billion in 2001–02 to approximately
$2.46 billion in 2002–03. These developments continue to support
hardware sales in the country.
India: Information Technology
The Indian IT industry is moving toward embedded
technology requiring software and hardware codesign. Multimedia,
workflow automation, virtual reality, and machine learning are some
of the latest developments requiring embedded hardware. Personal
computers and servers continue to dominate for office automation
purposes.
A study conducted by Manufacturers Association of
Information Technology (MAIT) and Ernst & Young found that the
Indian hardware sector has the potential to grow to 12 times its
present size, reaching a sales turnover of $62 billion by 2010 with
the domestic market accounting for $37 billion and the balance for
exports (source: The Hindu Survey of Indian Industry).
More than 135 small, medium, and large firms manufacture
computers in India. Many multinational companies (MNCs), such as
HP, IBM, Siemens, Dell, and ACER, have a strong presence and manufacturing
facilities in India. Lesser-known branded/unbranded locally assembled
PCs and Indian-branded PCs compete with MNC products. The market
shares of each element in this segment vary from year to year. During
the first six months of 2002–03, the locally assembled PCs
had a share of 48 percent; Indian brands had 22 percent, and MNC
products had a market share of 30 percent.
India imports most of the high-performance computers
and peripherals from the U.S. and Asian countries. Major Indian
and U.S. software and services companies such as CISCO, Cognizant
Technologies, IBM, Microsoft, Oracle, and Texas Instruments import
and use high-performance computer systems for their development
projects. In addition, major Indian and international banks, insurance
companies, Indian stock markets, Indian railways, and airlines also
use high-performance computers, including mainframes and mid-sized
computers.
The national government of India and Indian state
governments encourage new investments in computer hardware projects.
The market size in 2003 of the various segments is given below:
The above estimates are based on the literature from
the following sources:
• Manufacturers Association of Information
Technology (MAIT), www.mait.com
• National Association of Software
and Service Companies (NASSCOM), www.nasscom.org
• The Hindu Survey of Indian Industry,
2003
• India Infoline, www.Indiainfoline.com
Table 6: Computers and Peripherals
in India

Notes: The data are in millions of
U.S. dollars, based on an exchange rate of $1 = INR 47.5. The data
are unofficial estimates.
India: Computer Engineering Software and Services
The Indian software and services industry continues
to show impressive growth rates. The software industry grew at a
compounded annual growth rate (CAGR) of more than 50 percent during
the last five years. Even though the global economy slowed down,
Indian computer software exports jumped to $9.7 billion during 2002–03,
from $7.68 billion in 2001–02, reflecting growth of more than
26 percent. Domestic software and services also grew from $2.08
billion in 2000–01 to $2.45 billion in 2001–02.
The government of India aggressively supports this
industry, which is projected to reach exports of $50 billion by
2008. The Indian government has undertaken initiatives such as simplification
of policy procedures, manpower development, venture capital support,
and infrastructure development to help promote the software industry.
International Data Corporation, India (IDC- India), a premier research
firm monitoring the IT industry worldwide, estimated the Indian
IT engineering services market at $442 million in 2001, $566 million
in 2002, and $633 million in 2003. IDC-India, in its report Directions
2003 for India, has estimated that the computer software engineering
sector grew by 18 percent in 2002–03 (April–March) and
is projected to grow at a CAGR of 11 percent during the years 2003–06.
Present and projected increased uses of IT applications
in state and central governments, e-governance applications, e-banking,
elimination of import duty on software, enhanced enforcement of
antipiracy laws, and the increased maturity of end-user organizations
in using legal software have all contributed to the rapid growth
of the Indian software industry. According to India’s Department
of Information Technology, Indian IT spending as a percentage of
GDP should reach 7 percent by 2008, from the present 3 percent.
U.S. software and IT services companies have found
opportunities by providing products and expertise that help to accelerate
the market’s growth. Notably, companies that provide tools
and systems for IT-enabled services, such as call centers and business
process outsourcing, have found good prospects in India. Likewise,
companies that provide Web based e-governance and e-commerce solutions
will find interest from the Indians. The growing Internet service
provider (ISP) market will also demand leading-edge ISP operations
and user interface software. Appropriate software for vertical markets
such as banking, health care, textiles, and telecommunications will
also see an increase in demand.
The most promising IT sub-sectors had the following
market sizes in 2003, based on estimates in U.S. dollars:
Systems and Packaging: $252 million
Professional Services: $170 million
Processing Services: $75 million
Maintenance Services: $151 million
Table 7: Information Technology
in India
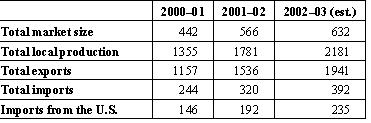
Note: The data are in millions of
U.S. dollars, based on an exchange rate of $1 = INR 47.5.
The above estimates are based on the literature from
the following sources:
• Electronics and Computer Software Export
Promotion Council, http://www/escIndia.org/export_statistics.html
• National Association of Software and
Service Companies (NASSCOM), http://nasscom.org
• Dataquest India, http://www.dqIndia.com
• Industry source and newspapers, http://economictimes.Indiatimes.com/cms.dll/xml/uncomp/articleshow?msid-20231
Russia (Russia, 2004)
Russia: Telecommunications Equipment
The Russian telecommunications market has demonstrated
strong growth over the last year, driven by Russia’s continuing
strong economic performance and the pressing need to upgrade the
generally inadequate telecommunications infrastructure throughout
the country. In 2002, the Russian market for telecommunications
services grew 30 percent to $8.6 billion, and it is expected to
top $10 billion in 2003. Meanwhile, the number of cellular phones
increased by 130 percent in 2002 to 17.7 million and reached 24
million in June 2003. Internet subscribers doubled in 2001 and 2002
and reached a 10 percent penetration rate in 2003.
Telecommunications equipment sales are running at
around $2 billion per year. At the beginning of 2003, Russia had
more than 32 million telephone lines, up from 29.7 million on January
1, 2002, and the waiting list has 5 million names. However, more
than 50,000 small rural communities are without a single phone line.
An objective of the Russian government is to place a telephone in
every community or within an hour’s walk. Given Russia’s
vast size, this is ambitious, indeed.
Svyazinvest, the state-owned major fixed-line carrier,
has been tasked by the government to increase the number of fixed
lines to 45 million by 2010. As tariffs are regulated at a low level,
and increases are likely to be quite gradual, much of the capital
expenditure budget is expected to come from outside investment.
In part to increase its attractiveness to investors, Svyazinvest
has completed a reorganization under which it has consolidated 70
regional phone companies into 7 super-regional telecom providers.
In the process, its market capitalization rose from $1 billion at
the initial phase of the reform in January 2001 to $1.8 billion
by early 2003. There has been some discussion over a potential sale
by the government of its 75-percent share in Svyazinvest.
Over the next three years, the highest growth rate
is expected in the broadband segment (xDSL, cable TV, and BWA).
Dial-up Internet access should grow by 20 percent per annum, and
the Internet segment should average 25-percent growth. Sales of
packet switching gear will grow by 55 percent per year, and the
virtual private network (VPN) market may triple. The cellular market,
which represents about 35 percent of the Russian telecom market
by value, is expected to maintain its market share, growing at the
average rate of the industry in general.
Continued growth in the Russian telecommunications
services market will yield business opportunities for competitive
U.S. telecommunications equipment suppliers. The best sales prospects
are digital switching equipment; high-speed, broadband Internet
access technologies; multiservice and multimedia solutions, including
SDH, xDSL, ISDN, DWDM, and BWA; and call-center equipment. Companies
entering the market should be prepared to compete with major foreign
equipment manufacturers and deal with a complex regulatory environment.
Table 8: Russia’s
Telecommunications Equipment Market
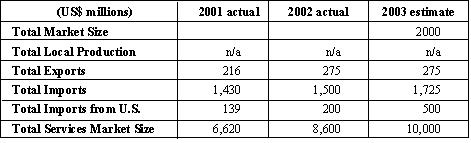
Note: The above figures are based on Russian Customs
statistics and may be an underestimate of U.S. imports. Due to their
corporate structures, some U.S. equipment manufacturers ship product
from their European warehouses. Russian Customs may attribute such
shipments to Europe rather than the United States, despite the U.S.
origin of the product.
Russia: Computers, Peripherals, and Computer Software
The Russian computer market represents one of the
promising emerging markets for U.S. firms and has solid potential
to grow. Industry sources estimate the IT market at $4.7 billion
in 2002. Many major U.S. companies are already present in the market,
and their products are available either directly or through representatives
or distributors. However, Russian consumers are, of necessity, extremely
price-sensitive and generally prefer a low-cost computer to a globally
recognized brand name.
The main trends in 2002 were a sizable increase in
government purchases, expansion to Russia’s regions, and strong
growth in laptop and server sales. Imports account for 15 percent
of Russia’s personal computer market, while peripherals, networking,
and larger system hardware are dominated by imports.
The total number of computers in Russia exceeded
12 million by January 2003, with a penetration rate of 9 percent.
It is estimated that by 2004 the number of Internet users will reach
15 million, and in the following seven years will grow to more than
35–40 million. The software market was estimated at $450 million
in 2002 and growing at an annual rate of 25 percent; it was predicted
to grow up to $600 million in 2003. The true demand for software,
though, is difficult to determine, due to the high level of pirated
software. Some industry sources estimate that piracy is up to 85
percent, but legislation (on patents and trademarks) and enforcement
(e.g., a new arbitration code) should improve that situation. In
2002, the market for outsourcing software services was estimated
up to $300 million. Total annual turnover of the systems integration
market grew to $840 million in 2002 and is projected to continue
its growth. This market sector is maturing, and new entrants will
likely face serious competition from long-established companies.
Continuing growth in the number and purchasing power
of SMEs is driving demand for legally imported operating systems,
software application packages, and enterprise management software.
The best opportunities for sales of U.S.-manufactured hardware computer
products in Russia appear to be peripherals, networking equipment,
and Internet technology.
Table 9: Computers, Peripherals,
and Software in Russia

Note: The above figures are based
on Russian Customs and U.S. Department of Commerce data and unofficial
estimates.
Mexico (Mexico, 2004)
Mexico: Electronic Components
The electronics industry in Mexico is evolving. Fueled
by the North American Free Trade Agreement (NAFTA), the industry
has moved into new product lines, including automotive electronics,
network equipment, game consoles, printers, high-capacity servers,
storage media, and even semiconductor design. As the second most
important export industry in Mexico, the electronics industry imports
92 percent of the electronic components it requires, 85 percent
of which come from U.S suppliers. However, more and more components
are being imported from other areas of the world, mainly Asia and
Eastern Europe.
Mexican electronic firms enjoy competitive advantages
for importing components from U.S. suppliers under NAFTA, including
short lead times in transportation, virtually 100 percent duty-free
electronic components, and streamlined customs procedures. In addition,
NAFTA has led to increased foreign direct investment, and many of
the original equipment manufacturers are U.S. investment operations
that utilize U.S. components in their designs. U.S. market share
has declined, however, due to the Mexican government’s program
of sectoral promotion (PROSEC) program, which established most-favored
nation (MFN) tariffs of zero or 5 percent for many categories of
industrial inputs, thereby eroding the value of NAFTA duty-free
entry for U.S. suppliers.
As a result of the slowdown of the U.S. consumer
electronics market, Mexican imports of U.S. components for assembly
and reexport decreased significantly in 2002. This trend is expected
to continue in the near future until the U.S. economy recovers.
The two main centers for the electronics industry
in Mexico are Baja California (Tijuana) and Guadalajara.
Baja California
Electronics is one of Baja California’s most
important industries, with 180 plants (approximately 26 percent
of Mexico’s total electronics maquiladoras). The great majority
of these plants are of Asian origin, and they employed more than
60,000 workers and produced nearly 19 million television sets and
computer monitors in 2002. Among the most important purchasers of
electronic components in the border region are Sony, Panasonic,
Thompson, Hitachi, JVC, Matsushita, Sia (Sanyo), Samsung, and Sharp.
This industry has been severely affected by the global economic
slowdown and other factors that have caused the closure and relocation
of more than 50 companies in the electronics sector. Nevertheless,
there have been recent signs of recovery, such as an important Japanese
firm inaugurating a new plant to manufacture plasma television sets.
The electronic products that continue to have the best prospects
are monolithic integrated circuits, hybrid integrated circuits,
circuit selectors, tuners, diodes, transistors, and electronic micro
assemblies. More than 35 percent of these components are imported
from Asian countries, a characteristic purchasing pattern from Asian
investors, who favor sourcing from their countries of origin.
As is happening in other parts of the country, the
electronics industry in the region is evolving, shifting production
lines to new products such as cellular phones, game consoles, and
automotive electronics, among others.
Guadalajara
Located in western Mexico, Guadalajara has experienced
important growth in the electronics sector and is considered Mexico’s
Silicon Valley. Original equipment manufacturers (OEMs) that formed
the initial base of the city’s electronics industry, including
Hewlett Packard, IBM, Siemens, and Kodak, are now contracting out
more of their production to local contract manufacturers (CMs),
such as Flextronics, Solectron, and Jabil Circuit, to manufacture
parts for final products manufactured in Guadalajara—computers
(mainly laptops), computer peripherals (mainly printers), game consoles,
and telecommunication equipment. Texas Instruments and Siemens represent
the growing specialty sector within automotive electronics. New
practices being adopted by local industry include the ability to
respond to requests from customers (located mainly in the United
States) with very short lead times (usually 48 hours), and the custom
manufacture of complex devices such as servers or routers.
Guadalajara’s electronics sector is closely
tied to that of the United States: 80 percent of electronic components
are imported from the United States under NAFTA, and 91 percent
of local production is exported to the United States. Therefore,
the downturn in the U.S. economy and decrease in demand for electronic
products has impacted Mexico’s economy. Mexico’s highest-value
import category, the semiconductor sector, is increasingly shifting
in origin from the United States to Japan, Taiwan, Malaysia, Korea,
and Singapore. In just the last year, U.S. semiconductor imports
fell from US$4.3 billion to US$3.3 billion.
Manufacturers have become even more cost conscious
and are looking for additional ways to reduce costs. Some have moved
parts of their operations to lower-cost countries. As more and more
OEMs look to their contract manufacturers for low costs, CMs have
more freedom to choose suppliers and negotiate price, therefore
transferring electronic component supplier control to CMs.
Table 10: Electronic Components
Imported from the U.S. in 2002 (US$ millions)
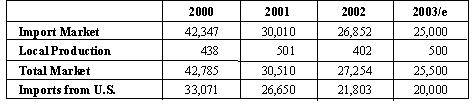
Table 11: Electronic Components
Imported from the U.S. to Mexico in 2002

Source: Banco de Mexico, Secretary
of Economy, and National Chamber of Electronics and Telecommunications.
Figures are considered from April 2002 to March 2003, due to a lack
of information from the Secretariat of Economy.
Mexico: Internet and E-Commerce
The Internet market is the fastest growing segment
within Mexico’s telecommunications sector. According to the
consulting firm Select, the number of Internet users reached approximately
10 million in 2002 and was expected to reach 12.25 million by the
end of 2003.
Internet penetration is limited by a low PC-penetration
rate and a lack of fixed-line capacity, which prevents potential
customers from gaining access. The installed base of PCs in 2002
was estimated at 8.1 million, of which 54 percent had Internet access.
The drivers for the Internet growth include the interest in fixed
broadband access, Internet/PC bundle packages offered by most service
providers, the popularity of Internet cafes, and the initiatives
of the government and carriers for increasing Internet adoption
by residential, business, educational, and government users.
The potential number of Mexican Internet users is
primarily limited by income distribution patterns, limited investment
in IT by SMEs, limited Internet content in Spanish, and the high
prices of fixed broadband connectivity. However, Wi-Fi solutions
are being looked at to overcome these limitations. Wi-Fi commercial
systems are currently in place in some restaurants, coffee shops,
hotels, and other commercial establishments, primarily in metropolitan
and tourist areas. Techtel International and Intel have been very
active in this regard. In addition, Telmex has installed 100 “hot
spots” in Sanborns, a chain of retail/pharmacy stores with
coffee shops, as well as in convention centers and airports.
According to Pyramid Research, the revenues generated
by Internet services grew from US$138 million in 1998 to US$535
million in 2001 and will continue to grow at an annual rate of 20
percent over the next five years. Currently, revenues from fixed
narrowband access account for 72 percent of the market, due to the
large number of dial-up connections. However, it is estimated that
broadband services will gradually gain market share and will generate
approximately 52 percent of Internet services revenues in 2007.
Over the long term, Internet use is expected to increase
as the process of technology diffusion continues, with computer/Internet
access moving from larger companies to their suppliers, from institutions
of higher education down to secondary and primary schools, and from
the Mexican federal government to local governments. Wireless Internet
use may become more widespread in the future as a result of the
serious infrastructure problems with the fixed-line Internet.
The relatively fast expansion of the Internet in
Mexico, growing interest in e-commerce, and the increasing use of
business applications are creating a need for hosting services with
large storage capabilities. Companies that are capable of offering
bundled packages for connectivity, hosting, and storage will eventually
displace companies currently offering simple colocation and basic
storage solutions for Web sites.
According to Pyramid Research, e-commerce in Mexico
is expected to reach approximately US$47 billion by 2005, up from
US$1.1 billion in 2001, making Mexico a leader in Latin America
in terms of potential for future growth in this area.
International trade in 2002 accounted for US$873
million of e-commerce transactions and forms the largest component
of the US$1.5 billion in e-commerce revenues. Business-to-business
(B2B) is more prevalent than business-to-consumer (B2C) e-commerce.
In 2002, B2B reached US$523 million, and B2C accounted for US$131
million. The main issues affecting B2C e-commerce include low Internet
penetration, a low level of consumer purchasing power, a low penetration
of credit cards, an underdeveloped market for consumer credit, and
IT education and awareness.
Most signs indicate that B2B will continue to thrive
as increasing resources are invested in the development of online
supply chains by both the private sector and the government of Mexico.
B2B is projected to reach US$1.9 billion by 2005. This growth will
also result from declines in B2C transactions that are likely to
occur in both the short- and medium-term. However, as the Internet
penetration rate continues to grow, so will B2C in the long term.
Large companies and financial institutions are working
to change their procurement processes to electronic means. An A.T.
Kearney survey indicates that for this year, 27 percent of the IT
investment in Mexico will be for e-business solutions, compared
with 18 percent in 2002.
According to Mexico’s banking association and
Select, the number of registered e-banking clients rose from 700,000
in 2001 to 2.4 million in 2002. This number should reach 4.5 million
by 2005. Banking operations increased from US$96 million to US$280
million over the same time period.
One the most promising developments related to Mexico’s
e-commerce future is the government of Mexico’s commitment
to making Mexico a digital economy. The development of the e-Mexico
program is the most obvious manifestation of this commitment. E-Mexico’s
main goals are to develop Mexico’s IT industry, foster an
internal market for IT products, promote an adequate regulatory
framework for the use of electronic media and e-commerce, and digitalize
government services in order to create a model for the private sector.
The e-Mexico initiative promotes the use of information technologies
in education, health, commerce, and government.
In July 2002, the Mexican government created a trust
fund to begin providing points of Internet access to more than 2,000
rural communities. Leaders of e-Mexico claim that by 2025, 98 percent
of Mexican citizens will be online. As of June 2003, the e-Mexico
project was clearly a reality. The majority of the 3,200 digital
community centers have been constructed, and a national satellite
network to provide connectivity is already launched and in operation.
These digital community centers have been installed in 2,429 municipalities
and 16 delegations within the Federal District (Mexico City).
Another positive development in this area is the
work that is being done on the e-commerce legal and regulatory framework.
Both the government and the private sector have been committed to
revamping laws that pertain to or affect e-commerce. In 2000, the
government of Mexico began this undertaking with the passage of
the e-Commerce Law. As a consequence, electronic contracts are recognized
legally, information transmitted online is accepted in judicial
proceedings, and consumer protection laws apply to the online world.
Last year, the Mexican government created a standard
(Norma Oficial Mexicana—NOM-151-scfi-2002) on conservation
of messages of data. Also, the Federal Law of Transparency and Access
to Government Public Information came into effect in June 2003.
This year, the Digital Signature Law was also approved.
While e-commerce legislation is gradually evolving,
a number of additional laws and regulations have been proposed to
make Mexico’s laws related to e-commerce “interoperable”
with other digital economies. Perhaps the most important is the
e-invoice legislation, which will eliminate the requirement that
businesses provide hard copies of invoices in electronic transactions.
Additional legislation related to consumer protection
and data privacy are pending in the Mexican Congress. Many companies
and financial institutions are concerned that the government’s
interest in passing laws related to data privacy could hinder the
transformation of Mexico into a digital society. It is widely felt
that B2B and B2C e-commerce in Mexico will be advanced only to the
extent to which proponents of the free flow of information and a
self-regulatory approach prevail on these issues. On June 6, 2003,
the Mexican Congress passed the flawed data privacy legislation,
which would negatively impact Mexican, U.S., and other foreign business
interests. This legislation is being monitored closely by the U.S.
Government.
Table 12: Mexican Internet
and E-Commerce Revenues
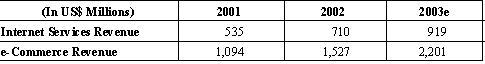
Source: Pyramid Research
In U.S. $Millions
Table 13: Mexican Computers
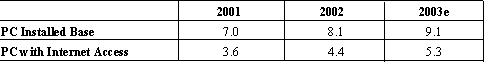
Source: Select Mexico
Turkey (Turkey, 2004)
Turkey: Telecommunications Services
In 2004, full liberalization of the market will increase
the size of the market. The private sector has obtained and will
obtain licenses for the introduction of new telecommunications services
in competition with Turk Telekom. The competition will create more
business, both for the private sector and Turk Telekom.
Turk Telekom is the main fixed-line telecommunications
operator with a subscriber number exceeding 19 million. The government
of Turkey, in privatizing Turk Telekom, is considering the sale
of some of Turk Telekom’s shares as bonds, convertible to
potential shares of Turk Telekom. The Turkish government will convert
these bonds into shares of company stock when the market conditions
are right.
Turkey has four cellular service operators, Turkcell,
Telsim, Aria, and Aycell. Turkcell has approximately 15 million
subscribers. Telsim’s subscriber estimate was 8 million by
the end of 2002. Aria has approximately 1 million subscribers. Aycell’s
subscriber estimate was 400,000 by the end of 2002. Turkcell and
Telsim operate on 900 MHz Global System for Mobile Communications
(GSM) systems. Aria and Aycell operate at 1800 MHz GSM frequency.
The government of Turkey may consider issuing third-generation GSM
licenses in 2004.
Best prospects for U.S. export and investment will
be voice and data transmission services through fiber optic networks
and voice over internet protocol (VoIP). High-speed data and leased-line
services have a promising future in Turkey. More than 40 private
sector companies have already obtained licenses. Additional opportunities
exist for the Turkish market in international traffic, either originating
or terminating in the country. Due to the widely dispersed Turkish
population around the world, a large number of international calls
are placed, primarily from Western Europe and the United States
to Turkey.
Turkey will play an important role in providing telecommunications
traffic access to Iraq. Satellites covering Turkey and Iraq can
play an important role in the reconstruction of Iraq in the telecommunications
services sector. Networks in Turkey can tie Iraq to the Internet
world and participate in establishment of Internet backbones. Following
is the market size estimates for the Turkish Telecommunications
Services sector:
Table 14: Market Size Estimate
for the Turkish Telecommunications Services Sector

Note: The above statistics are unofficial
estimates. Exchange Rate used: 1$ = TL 1,600,000
Turkey: Telecommunications Equipment
The telecommunications industry will be liberalized
in 2004. The new investors will be the major equipment buyers alongside
Turk Telekom, Turkcell, Telsim, Aria, and Aycell. The existing telecommunications
laws specify that the telecommunications services sector will have
full liberalization starting from January 1, 2004.
The private sector may make major investments on
establishment of new fiber-optic networks, VoIP equipment, and wireless
local loop networks. Depending on the timing of license tenders,
the other best prospect can be the third-generation GSM networks.
Due to the proximity of Turkey to a liberated Iraq, Turkey can be
a hub-market for the telecommunications equipment needed in the
Iraqi reconstruction and improvement of the existing telecom network
in Iraq.
Turk Telekom, being the incumbent fixed-line operator
with more than 19 million subscribers, may invest in new technologies
in 2004. Turk Telekom may consider procurement of an intelligent
network management center. Turk Telekom, together with Koc Holding,
can be a good client if their consortium wins the Bulgarian Telekom
privatization. Most probably Bulgarian Telecom networks will require
further digitalization. The four GSM cellular operators, Turkcell,
Telsim, Aria, and Aycell, may also further invest to improve their
networks and services in 2004.
Table 15: Market Size Estimate
for the Turkish Telecommunications Equipment Sector

Note: The above statistics are unofficial
estimates based on an exchange rate of $1 = TL 1,600,000.
Turkey: Information Technology
The IT market in Turkey had been growing at an annual
rate of 25–30 percent since 1997. However, due to the economic
crises in 2001, this rate fell to 22 percent, with the total IT
market valued at US$2.8 billion (excluding telecommunications equipment
and services). The overall industry size, inclusive of telecommunications
equipment and services, reached US$9.6 billion in 2002. Presently,
Turkey has nearly 4 million Internet users. IT hardware is the leader
in IT market sales, mainly driven by PC sales. Analysts estimated
inflation in Turkey to be 48.9 percent in 2002 and that Turkey can
realize a 5.3 percent actual growth rate between 2003 and 2006.
Market analysts anticipate a 30.9 percent market increase as the
Turkish economy continues its postcrises economic rebound.
The government of Turkey is in the final stages of
the passing the E-Commerce Regulatory Law, which will enable official
legal acceptance of electronic signatures as well as regulate e-commerce
and tax issues. The proposed e-commerce law is based on the European
model with influence from U.S. regulations.
The best prospect sub-sectors remain as follows:
PC sales, data storage, digital photography, and generic printer
cartridges.
Table 16 shows the market size estimate for the IT
sector, excluding telecommunications equipment and services.
Table 16: Turkey’s
Information Technology Market

Note: The above statistics are unofficial
estimates based on an exchange rate of $1 = TL 1,600,000.
Analysis of Market Trends
The market for E&IT products is constantly changing
and evolving as new product trends arise. New trends in cellular
phones, ATMs, PDAs, televisions, speech-recognition technology,
and distance learning are changing the way we learn, do business,
store data, bank, communicate with others, and entertain ourselves.
Many market forces result from the desires on the part of the E&IT
industry, such as gaining a competitive advantage and complying
with U.S. laws, and on the part of the consumer, such as a preference
for more easy-to-use, efficient, and safe products; these forces
create the demand for more accessibly designed products. New products
are consistently emerging with the aim of serving a wider population
of users, including users with various disabilities, and increasing
the overall ease of use for everyone. Current trends in the industries
for the six product lines presented in this report are discussed
below, along with the market forces that create the demand for those
products. Information in this section of the report comes from many
different sources, all of which are cited in the text.
Cell Phones
Scarborough Research, the nation’s leader in
local, regional, and national consumer information, estimates that
“almost two-thirds (62 percent) of American adults own a cell
phone” (McFarland, 2002). The majority of cell phones are
used to make telephone calls, surf the Web, and receive messages.
Cell phones are invaluable when it comes to dealing with an emergency.
They have helped save people’s lives, whether locating people
involved in an airplane crash or calling for help when faced with
a medical emergency. Many people use them for long-distance calling
instead of signing up for a long-distance plan through their home
telephone service provider. Cell phones give people the ability
to surf the Web without a computer, take a photo and immediately
send it to someone else, and receive messages, stock quotes, news,
and other information anywhere, anytime.
Market Forces Creating Demand for More Accessibly
Designed Cell Phones
1. The desire on the part of the E&IT industry
to achieve competitive advantage and increase profits. Desire on
the part of consumers to purchase the most convenient and easy-to-use
cell phone. Examples of these market forces include the following
innovations:
• Easier data entry: The desire to enter
text into a cell phone easily was a major market driver in making
cell phones more accessible. Until recently, entering a single character
(i.e., A-Z) into a cell phone required up to six key presses. For
example, you would have to press the #2 key six times and then the
#key to select and enter a capital C. Here is, in order, what each
key press would do. First press = a, second press = A, third press
= b, fourth press = B, fifth press = c, sixth press = C, and # enters
the character. This consumer demand led to the development of new
cell phone keypads. For example, the Fastap™ keypad is an
example of a simple, intuitive, and powerful computer interface
that fits in a small mobile phone. Modern phones offer a lot more
than just voice communication. Mobile phones are data devices with
the ability to write messages, collect and store information, and
buy things. They are essentially networked computer terminals. Alphanumeric
keypads make a cell phone easier to use for people with low vision
(Fastap, n.d.).
• Voice dialing: Voice dialing is a common
feature on most digital cell phones. The technology has gone even
farther. iVoice, Inc., recently released a new hands-free feature
to its Speech Enabled Auto Attendant that allows an outbound caller
to speak the number they wish to dial (iVoice, Inc., 2003).
• Talking caller-ID: Most people would
like to know who is calling them before answering their cellular
phone, especially if they are occupied in an eyes-busy, hands-busy
environment. Lucent Technologies offers this service in support
of helping wireless network operators rapidly deploy new features
and generate new revenues (Cambridge Telecom Report, 2000).
• Automatic ring mode adjustment: A cell
phone that is aware of where it is and adjusts its ring mode accordingly
is being patented by IBM’s research lab in Winchester, MA.
The new system uses the global positioning system (GPS) technology
to switch the phone’s ringing modes. In “region definition”
mode, the phone stores its current GPS coordinates while the owner
tells it whether to ring loudly, quietly, vibrate, or divert to
an answering service. This can be done separately in several locations—home,
work, church, and your favorite bar, for example—so the phone
knows exactly how to behave at that location. (Note: The cell phone
industry is already building GPS receivers into handsets so that
emergency services can locate where the caller is.)
• Large fonts: Samsung’s SCH-T300
can display numbers in a large font (Samsung, n.d.).
• Bluetooth communications: Bluetooth
is chip technology that comes built into products consumers use
every day, like cell phones, headsets, PDAs, laptops, and cars,
and it allows devices that have Bluetooth built-in to “talk”
to each other without a wire connection. If a cell phone and headset
both have Bluetooth built in, the user could put the headset on
and leave the phone in his or her pocket. Bluetooth can also connect
a car to the driver’s Bluetooth-enabled cell phone. The phone
in this scenario connects to the car’s audio system, and dash-installed
controls take over the function of the phone. Calls are made and
retrieved using voice recognition, and the user never has to even
touch the actual phone (Auto Channel, 2003).
2. The desire on the part of the E&IT industry
to comply with federal laws. The desire on the part of consumers
to be safe, get help in case of an emergency, and maintain contact
with young children, aging parents with Alzheimer’s, or others
at risk of wandering off. Examples of these market forces include
the following advancements:
• Global positioning system feature: Facing
a federal requirement to provide location data to 911 dispatch centers
by 2005, cell phone carriers have developed a GPS system to track
wireless calls. A special chip in the phone times the signals from
three satellites to calculate its position, which is relayed to
the nearest 911 center (LaGeese, 2003). GPS equipped cell phones
can also be used to track young children, aging parents with Alzheimer’s,
or others at risk of wandering off, or to find out if your children
are where they say they are when you call them.
• Cellular phone with built-in optical
projector for display of data: A patent for a cellular phone that
is compact in size and weight includes a mechanism for displaying
received wireless data in its original page format, as sent from
the original source. This allows for viewing each original page
as a whole page, rather than as a series of partial pages. The phone
also allows the display of received wireless visual data with characters
in their true original size, thus allowing for ease of reading and
use.
Market Forces Reducing the Accessibility of Cell
Phones
1. The desire on the part of the E&IT industry
to achieve competitive advantage through innovation. Desire on the
part of consumers to purchase distinctive cell phones suited to
a personal sense of style. Examples include the following:
• Miniaturization. Many cellular phones
are being designed to be more portable and less obtrusive. As a
result, keypads have shrunk, making it difficult for users who are
blind to tactilely identify keys. In addition, users without fine
motor control skills have difficulty activating the smaller keys.
• Non-standard keypads. Some stylized
phones have keypads arranged in a circular pattern or other nonstandard
layout. Users who are blind find if difficult to identify the keypad
keys because they are not arranged in the familiar layout.
2. The desire on the part of the E&IT industry
to achieve competitive advantage and increase profits. Desire on
the part of consumers to purchase the most advanced, feature-rich
cell phone. Following is an example:
• Smart phones. There is a trend to integrate
PDA functionality with cellular phones. The complexity of the user
interface and the dexterity required to operate the smart phone
may place the phone beyond the capabilities of some users.
ATM Machines
The classic definition of an automated teller machine
(ATM) is an unattended machine, external to some banks, that dispenses
money when a personal coded card is used. More than 200 million
people use ATMs in the United States. Billions of transactions are
processed in the United States yearly. According to Grant Thornton
LLP, 350,000 ATMs are in the United States; 250,000 are in nonbank
locations, and 150,000 of these ATMs are owned by nonfinancial companies
(Grant Thornton, 2003).
ATMs have revolutionized the way most people do their
banking. Customers can take care of financial transactions at any
time of the day or night without having to go to a bank building
per se, since ATMs are readily available at supermarkets, convenience
stores, shopping malls, hotels, and many other public places. ATMs
are used for cash withdrawals, transferring money between accounts,
looking up account balances, depositing cash and checks, purchasing
money orders, obtaining credit-card advances, and purchasing stamps.
Talking ATMs have enabled people who are blind to also experience
the convenience of anytime banking. In the future, ATMs will be
able to send person-to-person “cash” payments, cash
checks, deposit cash immediately into your account, and be accessed
by a cell phone or PDA.
Market Forces Creating Demand for More Accessibly
Designed ATMs
1. The desire on the part of the E&IT industry
to comply with U.S. and international laws. Examples of legal requirements
that have prompted accessibility include the following:
• United States: ADA Accessibility Guidelines
for Buildings and Facilities (ADAAG) as amended through September
2002: Section 4.34 Automated Teller Machines [4.34.5] Equipment
for Persons with Vision Impairments states, “Instructions
and all information for use shall be made accessible to and independently
usable by persons with vision impairments” (Access Board,
n.d.).
• United States: Section 707 of ICC/ANSI
A117.1 Standard on Accessible and Usable Buildings and Facilities
is entitled, “Automatic Teller Machines (ATMs) and Fare Machines.”
Although the 2003 version of this document has not yet been finalized
or published, following is an example of preliminary wording (in
part): “Speech Output Machines shall be speech enabled. Operating
instructions and orientation, visible transaction prompts, user
input verification, error messages, and all displayed information
for full use shall be accessible to and independently usable by
individuals with vision impairments. Speech shall be delivered through
a mechanism that is readily available to all users including, but
not limited to, an industry standard connector or a telephone handset.
Speech shall be recorded or digitized human, or synthesized”
(International Code Council, n.d.).
• Australia: The Australian Bankers’
Association (ABA), the Human Rights and Equal Opportunity Commission
(HREOC), and the Accessible E-Commerce Forum worked with representatives
from member banks, other financial institutions, community groups,
suppliers and retailers, and the National Office for the Information
Economy’s (NOIE) Access Branch to develop a set of voluntary
industry standards that aim to improve the accessibility of electronic
banking (Australian Bankers’ Association, n.d.).
• United Kingdom: UK design guidelines
provide research-based information to ensure that ATMs meet the
needs of all users. UK design guidelines are based on ergonomic
research and testing, offering design principles and guidance for
those who design, manufacture, install, and maintain ATMs. The 2002
edition reflects and builds on the experience gained from advances
in the design of ATMs and the practical application of the 1999
edition (Feeney, 2003).
2. The desire on the part of the United Nations and
the World Bank to reduce poverty in developing countries by helping
those countries grow and prosper. The desire on the part of the
E&IT industry to achieve competitive advantage and generate
revenue from emerging markets. The desire on the part of consumers
in developing countries to have the basic necessities of life. Examples
of these market forces at work include the following:
• The unbanked: ATMs can be a channel
for the flow of money that is being kept “under the pillows”
of billions of people living within emerging markets who do not
have a bank account. About 11 million consumers in the United States
do not have bank accounts (Cipherwar.com, 2000). Delton Yuen, NCR’s
vice-president, Financial Solutions Division, Asia-Pacific, stated,
“If every household saves money in pillow cases or a cookie
jar, the economic system is going to have less money to go around
to fund capital investments. For countries to ensure that the economy
grows, they need capital. And when the money within a country is
not channeled into the financial system or banking system, that
capital is circulating less and less” (McGill, 2002).
• Talking ATMs: Although these devices
are being developed for people who are blind, they can also accommodate
people who cannot read. Four hundred and forty million people who
cannot read live in the top five emerging markets.
Personal Digital Assistants
PDAs store, analyze, and retrieve needed information
on demand, anytime and anywhere. They can be used as a calculator,
address book, calendar, memo pad, expense tracker, and an electronic
information storage device. They serve as a portable personal computer
and augmentative communications device. Some of the many industries
using PDAs are health care, building/construction, engineering,
restaurant, and sales. PDAs are useful for dispatching crews and
managing mobile personnel. While they are particularly useful in
the business world, they serve as an excellent memory aid for any
individual. Information can be transferred between the PDA and a
personal computer, providing portable access to information. PDAs
are also being used for leisure-time activities. They can provide
golfers with distance measurements and scorecards. It is also possible
to watch a movie on your PDA. Gartner Group predicted worldwide
PDA revenue would be $3.53 billion in 2003, or approximately 10
million new units shipped worldwide (Directions Magazine, 2003a).
Market Forces Creating Demand for More Accessibly
Designed PDAs
The primary force is the desire to minimize the cost
of doing business. PDAs are now replacing what were once expensive,
proprietary, industry-specific telecommunication devices. Another
force is the desire of consumers to maximize the ease of use of
PDAs in eyes-busy, hands-busy environments. Professionals using
PDAs in eyes-busy, hands-busy environments are more likely to find
PDAs more user-friendly and easier to use if they are equipped with
voice recognition and text-to-speech technologies. Examples of improvements
resulting from these market forces include the following:
• Health care: Wireless-equipped PDAs
have been embraced by the medical community to access medical records,
write electronic prescriptions, and use as a portable nursing-unit
terminal. PDAs are also replacing high-cost medical devices. CardioNet
developed a proprietary PDA-type electrocardiogram monitoring device
connected to electrodes on a patient’s chest. The PDA receives
signals from the electrodes and transmits data to the PDA device
(CardioNet, n.d.).
• Public safety: Field officers use Internet-ready
PDAs to access remote records from management databases. This helps
to improve the efficiency of creating incident reports. It also
optimizes the transfer of queries and responses (Directions Magazine,
2003b).
• Workforce management: Cobb EMC is an
electric cooperative serving more than 170,000 customers in five
metropolitan Atlanta counties. Cobb EMC uses PDAs to dispatch crews.
They claim that this has helped to streamline work processes and
increase service reliability (Directions Magazine, 2003c).
• Military: Applications and devices developed
for use by the military include the V3 Rugged PDA; industry-leading
handheld capabilities; integrated Bluetooth for wireless link to
phones, printers, and PCs; TFT screen with 64K colors; Windows CE-based
Pocket PC with IBM ViaVoice, MS Pocket Office, and other applications
(General Dynamics, n.d.).
• Multimedia industry: Pocket PC Films,
in Sherman Oaks, California, uses PDA technology to distribute video
content for Pocket PC and Palm OS devices. Film fans can buy CD-ROM
titles, load them on their computer, and sync them into their handheld
device. Pocket PC Films now distributes 25,000 titles. The huge
potential market to use PDAs to view high-quality multimedia has
led manufactures to equip them with high-quality audio capabilities.
For more information, access the following Web site: http://store.yahoo.com/pocketpcfilms/xsxtremwinsp.html.
• Assistive technology industry: In order
to reduce the cost of their products, several AT vendors are replacing
their proprietary augmentative communications device hardware with
PDAs. The touchscreen, text-to-speech, and voice recognition capabilities
of PDAs make this possible. Two vendors in particular are pioneering
this trend: Enkidu Research with their Palmtop Portable and Saltillo
with their ChatPC.
• Simplified writing interfaces: Written
Chinese has 6,000 characters. A computer keyboard has 47 character
keys. Chinese data entry is so difficult that an entire industry
of people makes their living as typists. Someone who is really good
with the Chinese version of Microsoft Word, which takes the simplified
“pinyin” transliteration and guesses at the character
the writer means, can type maybe 20 words a minute. To improve this,
PDA manufacturers have started to equip PDAs with better chips and
faster algorithms. Voice interfaces are becoming so powerful that
the Mandarin-PDA-based language recognizer can distinguish about
40,000 words and still not tax the memory or processing power of
the PDA (Kumagai, n.d.).
Televisions
A television is technically described as a telecommunication
system that receives, decodes, and displays images and plays audio
of objects, stationary or moving, broadcast from a separate transmitter.
Television is the medium that entertains, informs, and educates;
it can also serve as a companion to people who, due to circumstances
beyond their control, are limited to their homes. Traditionally,
people have used TVs to get news reports and watch movies, sports
events, and sitcoms. Cable TV is a telecommunication system that
receives, decodes, and displays images and plays audio of objects,
stationary or moving, broadcast over cable directly to the receiver.
With cable TV, people have many more options of channels to watch,
often devoted to a particular subject of interest, such as HGTV
for the home and garden enthusiast, or news broadcasts 24 hours
a day. In addition, movies can be purchased on a pay-per-view basis.
Technologically advanced TV systems allow viewers to play interactive
games, take a distance learning course, send instant messages, surf
the Web, send an email, and shop for and purchase products, including
movie tickets and CDs from talk shows and concerts.
High-definition television (HDTV) is a system that
has more than the usual number of lines per frame, resulting in
pictures that show more detail. Interactive television (iTV) provides
richer entertainment, interaction, and more information pertaining
to the shows, props, and people involved in its creation. In a sense,
it combines traditional TV viewing with the interactivity enjoyed
by those communicating through a network, such as the Internet.
According to Disney, their iTV program, “Disney Active Portal
on Sky Digital,” is a major step forward. It offers Disney
more flexibility and control of their interactivity in terms of
design and dynamic update. The new application empowers kids, giving
them the opportunity to participate in shows while still being able
to watch the action on screen.
Market Forces Creating Demand for More Accessibly
Designed Televisions
1. The desire on the part of the E&IT industry
to comply with U.S. laws. Examples of how these market forces resulted
in enhanced products and services include the following:
• Emergency programming: FCC rules require
broadcasters and cable operators to make local emergency information
accessible to persons who are deaf or hard of hearing and to persons
who are blind or have visual disabilities. This means that emergency
information must be provided both orally and in a visual format.
Video programming distributors include broadcasters, cable operators,
satellite television services (such as DirecTV and the Dish Network),
and other multichannel video programming distributors (FCC, 1999).
• Captioning: Congress first instituted
the requirement that television receivers contain circuitry designed
to decode and display closed captioning. As of July 1993, the FCC
required that all analog television sets with screens 13 inches
or larger sold in the United States contain built-in decoder circuitry
that allows viewers to display closed captions. Beginning July 1,
2002, the FCC also required that digital television (DTV) receivers
include closed caption display capability. As part of the Telecommunications
Act of 1996, Congress instructed the FCC to require video program
distributors (cable operators, broadcasters, satellite distributors,
and other multichannel video programming distributors) to phase
in closed captioning of their television programs. In 1997, the
FCC implemented rules to provide a transition schedule for video
program distributors to follow in providing more captioned programming.
The rules require that distributors provide an increasing amount
of captioned programming according to a set schedule. All English
language programming prepared or formatted for display on analog
television and first shown on or after January 1, 1998, as well
as programming prepared or formatted for display on digital television
that was first published or exhibited after July 1, 2002, is considered
“new programming” and must be captioned according to
benchmarks set by the FCC. The following benchmarks establish how
much new programming must be captioned each calendar quarter:
ú January 1, 2000, to December 31, 2001:
450 hours of programming per channel per quarter
ú January 1, 2002, to December 31, 2003:
900 hours of programming per channel per quarter
ú January 1, 2004, to December 31, 2005:
1,350 hours of programming per channel per quarter
ú January 1, 2006, and thereafter: 100
percent of all programming, with some exemptions
• Digital television mandate: The FCC
has issued a ruling that requires DTV licensees to simulcast 50
percent of the video programming of their analog channel on their
DTV channel by April 1, 2003. This requirement increases to 75 percent
on April 1, 2004, and 100 percent on April 1, 2005. The simulcasting
requirement was intended to ensure that consumers enjoy continuity
of free, over-the-air video programming service when the analog
spectrum is reclaimed at the end of the transition. With digital
transmission, a TV broadcaster will be able to
ú Send multiple programming at the same
time over the same channel
ú Improve the quality of the transmission
with options not available with analog transmission
ú Offer digital data services, which
will allow the TV broadcaster to send out virtual newspapers and
other types of services directly to your TV
2. The desire, on the part of the E&IT industry
to achieve competitive advantage and generate revenue.
• Word-search videos using the closed
captions: The need to produce “just-in-time” news stories
used to cause problems for broadcasters. When a major event occurred,
news programs would have to scramble around looking for some footage
that supported the subject of the news story. For example, when
an entertainer passes away, news programs might show a clip or two
of their last interview with that individual. It used to be very
time consuming to search through logs and libraries to find the
appropriate footage until broadcasters gained the ability to both
store digital copies of their broadcasts on computers and conduct
word searches on them using the captions. Captioning their programming
has enabled many news broadcasters to achieve a competitive advantage
in the marketplace by being the first to announce a breaking event
with the appropriate video content.
Voice Recognition
Voice recognition technology (VRT) by itself is neither
accessible nor inaccessible. It is the integration of VRT into other
products and services that can help to make those products and services
more accessible and usable. VRT, also referred to as speech recognition
technology (SRT), provides telecommunications and computing devices
with the ability to recognize and carry out voice commands or take
dictation. VRT is generally identified as either being speaker dependent
or speaker independent. Speaker-dependent systems recognize only
a particular individual’s voice and are often used in dictation
products. Speaker-independent systems can recognize multiple voices.
Speaker-dependent systems are better able to process an individual’s
quirky speech patterns, but they can take a significant amount of
time to train. There are also continuous versus discrete speech
recognition systems, in which, respectively, the user can talk at
a normal rate or is required to talk with pauses between words.
Voice recognition enhances quality of life and independence
for many people. Users do not have to use their hands when operating
a telecommunications device that incorporates VRT. This technology
is also useful in a hands-busy environment, such as when a radiologist
analyzes x-rays by holding them up to the light and verbally dictates
the results to a computer. It is also helpful when operating small
devices like cell phones and PDAs.
Many industries are adding VRT to their communication
systems as a way to lower operational expenses by cutting the costs
of call handling. In 1996, Charles Schwab became the first major
consumer company to offer voice recognition for its customers to
get stock quotes and other information at the customer’s convenience.
In addition to brokerage houses using VRT, the banking, health care,
law enforcement, travel, transportation, and entertainment industries,
to name just a few, are incorporating the technology.
The Market Forces Creating Demand for More Accessible
and Usable VRT
1. The desire on the part of the E&IT industry
to achieve competitive advantage. The desire of consumers to purchase
easy-to-use and convenient products. Following is an example of
an innovation resulting from these market forces:
• Voice Dialing: People trying to operate
a cell phone in an eyes-busy, hands-busy environment might experience
difficulty. This market factor led to the incorporation of VRT into
cell phones and the development of hands-free accessories for cell
phones. People with upper-mobility disabilities, people with low
vision, and many senior citizens can also benefit from voice dialing.
Voice dialing is a common feature on most digital cell phones. PCS-Direct,
an Internet-based phone store, carries nine different cell phones
equipped with voice dialing (PCS-Direct, n.d.).
2. The desire on the part of the E&IT industry
to reduce cost and employee turnover. The desire on the part of
call-center agents to make their jobs as pleasant and nonrepetitive
as possible. Examples of innovations resulting from these market
forces include the following:
• Interactive voice response systems (IVR):
To date, companies have attempted to handle interactions with their
customers using touch-tone IVR systems, but the companies have realized
that their customers are not entirely satisfied with this form of
interaction. Touch-tone interfaces are both frustrating and ineffective.
In order to support customer interactions more quickly and efficiently,
companies are beginning to move to speech recognition systems. Many
call centers use systems that combine digitized speech and speech
recognition. Using IVR systems costs much less than using call-center
agents. Thanks to IVR, customer requests can be handled with little
human intervention. Call-center agents can then become more productive
doing other things. Another benefit of IVR is that agents no longer
need to repeat the same information to each caller, over and over
again. This tends to increase employee satisfaction and reduce turnover.
“Following this, the market is believed to be on its way to
being worth $43 billion by 2007” (Telecomworldwire, 2002).
• Web-based voice portals: VRTs can be
used to enable people to access a Web site using a telephone. Extending
access to a commercial Web site to telephones can attract new customers
who may not be in a position to use a computer connected to the
Internet. There are many instances of this, including the following:
ú People operating from within low-bandwidth
infrastructures
ú People who never learned to read
ú Mobile professionals who need quick
access to information while on the go
ú Senior citizens who recognize the
value the Internet but are simply more comfortable using a telephone
ú People who are blind or visually impaired
ú People who are traveling and don’t
have access to their PCs
•VoiceXML
standards: The VoiceXML Forum
is an industry organization established to promote VoiceXML as
the universal standard for speech-enabled Web applications. The
VXML Forum “aims to drive the market for voice and phone-enabled
Internet access by promoting a standard specification for VXML,
a computer language used to create Web content and services that
can be accessed by phone.” Following standards breeds success
and enhances the compatibility and interoperability of your system
with others. Systems that have been developed according to standards
are easier and less expensive to maintain.
• Dictation, voice recognition, and transcription:
Many professions require the transcription of voice-recorded data.
These professions include law enforcement, medicine, and the legal
profession. The financial pressures to drive transcription costs
down and productivity rates up helped to fuel our $8 billion speech
recognition industry.
Distance Learning
“Distance learning is used in all areas
of education including pre-K through grade 12, higher education,
home school education, continuing education, corporate training,
military and government training, and telemedicine” (USDLA,
n.d.). Students participating in distance learning can use the learning
style of their choice. Audio-based classes could consist of recordings,
synthesized speech, and audio-conferencing. Video-based learning
includes video, videoconferencing, and Webcasting. Print-centered
techniques include online text, books, and handouts. Employers also
benefit when their employees participate in distance learning courses.
“Travel expenses are reduced or eliminated, there is increased
productivity since employees don’t need to leave the office
for extended periods of time, teams are brought together without
restrictions on schedule or location, and it provides the ability
to reach geographically dispersed populations with a uniform and
consistent approach” (Thunderbird, n.d.). Also, higher education
facilities are finding that distance learning is less expensive
to support than traditional classroom learning.
The types of technologies for implementing distance
learning include the following (Tabs, 2003, p. 11):
• Two-way video with two-way audio (two-way
interactive video)
• One-way video with two-way audio
• One-way live video
• One-way prerecorded video, including
prerecorded videotapes provided to students, and TV broadcast and
cable transmission using prerecorded video
• Two-way audio transmission (e.g., audio/phone
conferencing)
• One-way audio transmission, including
radio broadcast and prerecorded audiotapes provided to students
• Internet courses using synchronous
(i.e., simultaneous or “real time”) computer-based instruction
(e.g., interactive computer conferencing or Interactive Relay Chat)
• Internet courses using asynchronous
(i.e., not simultaneous) computer-based instruction (e.g., email,
listservs, and most World Wide Web-based courses)
• CD-ROM
• Multimode packages (i.e., a mix of
technologies that cannot be assigned to a primary mode), and other
technologies
Online education is now offered at more than 56 percent
of the nation’s two- and four-year colleges and universities,
with distance learning beginning to extend to high schools and lower.
Market Forces Creating Demand for More Accessibly
Designed Distance-Learning Technology
1. The World Bank and its members
want to reduce poverty and strengthen emerging economies:
American businesses have invested more than $250 billion in the
top 15 emerging markets with the sincere belief that it will yield
significant returns on their investment. Distance education is a
critical success factor in human development in emerging markets.
Some call it the “foundation of business success” in
emerging markets. Education provides the high-level skills necessary
to establish a growing, self-sustaining E&IT labor market. It
can also provide the training required by engineers, doctors, teachers,
nurses, business entrepreneurs, social scientists, and many other
professionals critical to the success of maturing a developing economy.
The information infrastructures supporting a majority
of distance-learning activities in emerging markets are low-bandwidth
environments. Many of their resources will need to operate over
wireless devices. This means that the content will need to be developed
in an accessible manner.
Billions of workers live in emerging markets. They
are the individuals who ultimately benefit from an effective distance-learning
infrastructure. However, in the top five emerging markets, 440 million
people can’t read. In order to benefit from distance learning,
the materials need to be provided in alternate formats.
2. Corporations want to educate
their employees more effectively and less expensively:
Distance learning produces a 60-percent faster learning curve
than traditional instruction. More than 6,000 U.S. companies offered
distance-learning courses to their employees in 2003. This was
up from 391 in 1998. The U.S. corporate business skills training
market is projected to reach $18.3 billion by 2006 (CAGR of 13.3
percent). Worldwide, the distance-learning IT education and training
market is projected to reach $28.6 billion by 2006 (CAGR of 7.1
percent).
3. Universities want to reduce
costs and increase enrollment and still offer a quality education.
Conservatively, 45 million people use online higher education.
By 2025, the global demand for online education is forecasted
to reach 160 million students. For every foreign student studying
in the United States, three to five more students would consume
U.S. education online if they had access to it (Moe, 2002).
4. The law: Many countries
have policies relating to Web accessibility. They are Australia,
Canada, Denmark, Finland, France, Germany, Hong Kong, India, Ireland,
Italy, Japan, New Zealand, Portugal, Spain, the United Kingdom,
and the United States of America. The European Union also has
Web-access policies. Distance learning usually takes place via
the Web (Web Accessibility Initiative, n.d.). Several countries
have detailed policies that specifically apply to education as
described here:
• Australia has a Disability Discrimination
Act (1992) that applies to education.
• Canada’s Charter of Rights and
Freedoms guarantees the basic rights and freedoms important to Canada
as a free and democratic society. The Canadian government has also
established a Common Look and Feel for Canadian government Web sites,
which includes accessibility provisions.
• The UK’s Special Educational Needs
and Disability Act took effect on September 1, 2002. The Act removes
the previous exemption of education from the Disability Discrimination
Act (1995), ensuring that discrimination against students with disabilities
will be unlawful. Institutions incurred additional responsibilities
in 2003, with the final sections of legislation coming into effect
in 2005.
The following U.S. policies make accessibility a
requirement for distance learning.
• ADA and Section 504: Two federal laws
govern accessibility of education—Title II of ADA and Section
504 of the Rehabilitation Act of 1973 (as amended in 1998). All
elementary, secondary, and postsecondary educational institutions
are regulated under these laws. A useful legal analysis of these
requirements is provided in the California Community Colleges’
Distance Education Access Guidelines (California Community College,
1999).
• Section 508: In order to ensure that
its technology is accessible to its own employees and to the public,
the Federal Government has created regulations based on Section
508 of the Rehabilitation Act that require that E&IT developed,
procured, maintained, or used by the Federal Government be accessible
to people with disabilities. These regulations apply to all federal
purchases of technology. Requirements in Section 508 may also impact
state colleges and universities, pending policy decisions from the
Department of Education’s Office of Civil Rights.
• California higher education requirements:
The California Community College system has released Distance Education
Access Guidelines and Alternate Media Access Guidelines. The Alternate
Media Access Guidelines serve as a guide for the implementation
of California Law AB422, requiring publishers to provide textbooks
in electronic format to the three systems of higher education in
California (the University of California, the California State University,
and the California Community Colleges). The Distance Education Access
Guidelines include a summary of legal requirements as well as access
guidelines for specific modes of distance education instructional
delivery. These documents and other resources are available from
the High Tech Center Training Unit of the California Community Colleges.
• Texas K–12 textbook adoptions:
Texas has for several years been studying the issue of access to
electronic books and educational software for students with disabilities.
Two reports, one issued in 1997 and one in 1999, provide information
on how educational materials can be made accessible. Texas requires
publishers to provide electronic files for adopted print materials
and is in the process of incorporating the federal Section 508 requirements
as an optional part of their adoption process for interactive educational
software and electronic textbooks. Further information about Texas
textbook accessibility is available from the Texas School for the
Blind and Visually Impaired.
III. Industry
Study
The purpose of the industry study was to document
universal design practices within industries represented by the
six product lines selected for study. Six different companies, representing
each of the six product lines, were selected as industry partners.
Selection of industry partners was primarily based on their leadership
in the marketplace and ability to deliver candid representations
of their experiences with UD. During data collection, every effort
was extended to foster an environment in which companies would be
able to deliver documentation of actual processes and experiences.
Each company was individually approached by Georgia
Tech and asked to participate in the research program. Nondisclosure
agreements (NDAs) were signed in order to ensure the companies that
Georgia Tech would protect any proprietary data disclosed during
the course of the study, as well as to foster a general environment
of open and frank discussions. Full disclosure was critical to the
success of the industry study because it was important that actual
experiences be documented as opposed to ideal situations or marketing
hype. The NDA restricts Georgia Tech from releasing any proprietary
information belonging to the industry partners. Therefore, it is
not the intent of this study to provide detailed descriptions of
experiences recorded as part of the research. This section documents
the general experiences of companies that are representative of
the six product lines selected for analysis and provides a basis
for identifying candidate interventions or approaches for the promotion
of UD.
As part of the industry study, we investigated the
presence of barriers and facilitators to accessible design. When
an industry partner indicated experiences with a particular barrier,
key personnel were interviewed to determine the policies and procedures
that were used to overcome the barrier. Prior to interviewing the
industry partners, a candidate list of facilitator and barriers
was identified.
Analysis of Facilitators
and Barriers to Accessible Design
Source materials, generated as part of the Information
Technology Technical Assistance and Training Center (ITTATC), were
reviewed in order to identify potential facilitators to accessible
design. Facilitators are defined as concepts, procedures, or actions
that may be employed by industry that might result in the development
of accessible technologies. We read the needs assessment literature
review, a survey of ITTATC National Advisory Committee participants,
and a survey of accessibility visionaries in order to create the
initial list of facilitators. The list was supplemented by our experience
consulting with industry and our preliminary findings from the ITTATC
case studies project.
Facilitators
The list of facilitators is divided into five categories:
design, organizational, informational, financial, and legal facilitators.
Design facilitators are methods or tools that may be implemented
in the design process and result in achieving a more accessible
design. Organizational facilitators include augmentations to communications
and infrastructure that may enhance the effectiveness of an accessibility
program within a company. Informational facilitators address the
lack of knowledge in accessible design and the continuation of common
misperceptions. Financial facilitators include items that make accessibility
appear to be fiscally attractive. Finally, legal facilitators include
legal positions that make accessibility easier to achieve.
Design Facilitators
• Integrate accessibility into engineering
processes. Often, product accessibility may be improved by integrating
the consideration of the product’s accessibility as a formal
step in the engineering design process. The most desirable outcome
is usually observed when accessibility is addressed very early in
the design process.
• Develop standardized mechanisms for
connecting assistive technologies. A common complaint from industry
is that it is difficult to ensure that their products successfully
interface with AT because not enough is known about the detailed
interface requirements of the variety of AT products on the market.
• Make technological advancements for
handling adaptive devices and flexible design. For example, develop
smaller components for connecting assistive devices so that products
can be smaller and lighter.
• Develop innovative strategies to promote
awareness and understanding of UD issues. For example, a company
could sponsor a design challenge contest to address a specific accessibility
concern or award bonuses to those who significantly contribute to
the design of a more accessible product.
• Share ideas, concepts, and research
with other organizations, including encouraging peer-reviewed research.
Two possible means to accomplish this are hosting a conference or
creating a journal of accessible design.
• Develop awareness of competing companies’
efforts in accessible design.
• Develop accessible design standards
and guidelines.
• Develop a tool to help individuals
understand their role in universal design.
• Provide training for understanding
accessible design, including demonstrations of why a particular
approach may not work for an individual with a particular limitation.
This will assist the designers in adjusting their approach to thinking
about accessible design and to developing accessibility in the early
phases.
• Fund the acquisition of ergonomic and
human performance data of people with disabilities.
• Develop methods for measuring accessibility
and comparing the accessibility of two similar products. One approach
to address these issues would be to start and/or participate in
a working group to develop standardized measurement methods.
• Develop a working group to formulate
a clear definition of design goals related to accessibility.
• Promote the benefits of UD. Accessible
design is likely to benefit a much larger population than the target
group.
• Perform accessibility evaluations on
new and existing products and services.
• Include elderly individuals and individuals
with disabilities in the design process. Get input from them early
and recruit them to participate in evaluations. This can be done
through prototype and product testing, focus groups, direct contact
with the designers, discussion forums, or other mechanisms.
• Test for product compatibility with
assistive technologies.
• Hire product designers with disabilities
or with experience in creating universally designed products.
• Hire support personnel with disabilities
to work directly with designers.
• Designate an accessibility coordinator
to monitor accessibility issues and become familiar with related
standards and guidelines.
• Provide concrete design examples of
universally designed products.
Organizational Facilitators
• Share accessibility information companywide
and make it part of the culture. Ensure that all departments have
the same understanding of accessibility requirements.
• Educate the company on the tangential
benefits of accessible design. While most recognize that increased
accessibility will result in an increase in the user base, some
do not realize the benefit of UD for the existing user base.
• Increase diversity in the workforce.
• Develop brown-bag and discussion groups
regarding accessibility efforts so that upper management has the
opportunity to learn about and factor this information into corporate
decisions.
• Ensure that the personnel responsible
for making marketing, product development, and design decisions
are educated about accessibility and accessible design.
• Educate middle management that accessible
design can be made part of the design process, and it will not burden
schedule and budget requirements.
• Recognize accessibility as a necessity
for the general population, rather than as an exception.
• Incorporate accessibility standards
into quality assurance programs.
Informational Facilitators
• Educate employees that people with
disabilities have the same wants and needs as people without disabilities
(e.g., communication, bill paying, travel, etc.). Remind them that
the general population suffers from a number of temporary disabilities
as well as disabilities that are related to aging.
• Recognize that relatively small changes
can have a large impact on accessibility. Something as simple as
reducing the force required to press a button can greatly increase
the usability of a product for all potential users (without taking
away from design creativity).
• Provide accessibility training for
managers, designers, sales representatives, customer service personnel,
and any other groups that may benefit from the knowledge.
• Advertise accessibility features of
products, and emphasize the benefits to everyone.
• Gather as much information about accessibility
and disabilities as possible. Survey employees, canvas disability
groups for information, hold community meetings to get direct input
from people familiar with disabilities, and provide a Web link and/or
phone number dedicated to obtaining feedback on product accessibility.
• Form partnerships/relationships with
organizations devoted to promoting accessibility.
• Provide information to consumers about
their rights under Section 508 and Section 255 and the company’s
efforts to comply with those regulations. Complete voluntary product
accessibility templates (VPATs) for products so that consumers can
make informed decisions.
• Purchase assistive technologies for
designers to work with, and train them to use the devices properly.
• Increase exposure of engineers and
designers to accessible design. Train them when they’re hired,
develop a short course that can be made available through local
universities, or encourage someone in the company to teach at local
universities to increase exposure at the university level.
• Seek employees who have a background
in UD.
• Ask employees—particularly those
with temporary or permanent disabilities—to comment on the
usability of products that they use and to provide design suggestions.
Establish a mechanism for employees to provide feedback, and possibly
develop a discussion forum from which additional informal feedback
can be acquired. Use the people already in the company, as many
of them may have experiences with others who have limitations.
Financial Facilitators
• Recognize accessibility as a product
enhancement, not as a cost-prohibitive retrofit.
• Market products with accessible features
to a large population, not just the target market for which they
are believed to be appropriate.
• Use employees to reduce costs associated
with funding research in accessible design.
• Include accessible design as a regular
part of the design process, rather than as a feature that needs
to be addressed separately at added cost.
• Factor accessibility upgrades into
the cost of other important upgrades.
• Study the cost of not designing accessible
products. For example, revenue may be lost because of the inability
to effectively market to a federal customer.
Legal Facilitators
• Demonstrate efforts to comply with
Section 508. Create VPATs.
• Review consumer complaints received
by legislators and industry.
• Designate an accessibility expert to
monitor government regulations.
• Pressure the government for more detailed
requirements that industry must meet or guidelines for satisfying
the regulations.
Barriers
The process used to identify candidate barriers was
similar to the process used to identify candidate facilitators.
Source materials, generated as part of ITTATC, were reviewed in
order to identify potential barriers to accessible design. Barriers
are defined as potential roadblocks to a successful accessibility
program. We read the needs assessment literature review, a survey
of ITTATC National Advisory Committee participants, and a survey
of accessibility visionaries in order to create the initial list
of barriers. The list was supplemented by our experience consulting
with industry and our preliminary findings from the ITTATC case
studies project.
Similar to the list of facilitators, the list of
barriers is divided into five categories: design, organizational,
informational, financial, and legal barriers. Design barriers are
obstacles in the design process that may result in difficulty in
achieving an accessible design. Organizational barriers include
impediments to communications and infrastructure that may serve
to limit the effectiveness of an accessibility program within a
company. Informational barriers have to do with the lack of knowledge
in accessible design and the continuation of common misperceptions.
Financial barriers include items that make accessibility appear
to be fiscally unattractive. Finally, legal barriers include items
that make accessibility difficult to implement because of litigation
concerns.
Some of the barriers are merely perceived barriers,
due to a lack of knowledge of or insufficient experience in accessibility.
Other barriers represent more significant challenges to the accessibility
community in general.
Design Barriers
• Marketing and technology trends sometimes
run counter to accessibility requirements. For example, the cell
phone industry has followed a trend of miniaturization that has
resulted in the creation of a smaller keypad, which is difficult
for individuals with some types of upper-mobility impairments to
use. Furthermore, the font size used for the labels on these keypads
has been reduced as well.
• There is a general lack of peer-reviewed
research in accessible design. Many human factors professions complain
of the lack of human performance research to support design in general.
Even fewer studies focus on human performance issues for people
with disabilities. In addition, there is little information about
standard practices and methods of accessible design in the open
literature. Designers simply do not have access to information they
need to create accessible products.
• There is a lack of realistic standard
guidelines and principles of accessible design.
• Designers lack an understanding of
accessible design and what can be achieved if products are designed
with accessibility in mind from the beginning. Very few products
that represent successful exercises in accessible design are commercially
available.
• Designers do not have access to information
about people with disabilities in a format usable to them. Designers
often require human performance and ergonomic data in an easy-to-use
format to support design decisions. Unfortunately, human performance
and ergonomic data for special populations, including people with
disabilities, are not a part of the standard data sets. Designers
must consult outside sources and attempt to compile the necessary
data from a wide variety of technical reports and published articles.
The compilation of this data is extremely time consuming and is
often unfeasible.
• A standard accessible design process
has not been documented, tested, or verified.
• Implementation of multiple methods
of display and control may make it difficult to create a streamlined
user interface. Many feel that the addition of accessibility features
creates an unwieldy user interface.
• There is no standardized method of
measuring accessibility or comparing the accessibility of two similar
products. Designers do not have a way of determining if their designs
have met their accessibility goals.
• Many feel that there is no clear definition
of how accessible a product has to be in order to be considered
an accessible design.
• Many designers equate accessible design
with designing products for the lowest common denominator.
• Individuals with disabilities are not
integrated into the design or evaluation process.
• There is a lack of tools and resources
useful for efficiently creating accessible products.
Organizational Barriers
• Often, there is a lack of communication
across departments about accessibility requirements. A few pockets
of accessibility awareness seem to exist within many companies,
but there is a lack of structure integrating a comprehensive accessibility
program.
• Many companies lack accessibility champions
who are in a position to influence company decisions. In many cases,
personnel responsible for a company’s accessibility efforts
come from human factors, usability, or disability support groups.
In general, these groups do not have a large amount of input in
corporate decisions.
• Often personnel responsible for making
accessibility decisions have little knowledge about accessibility
or accessible design.
• Middle management often perceives accessible
design to be in direct conflict with schedule and budget requirements.
• Accessibility is often a minor concern
when compared with other corporate issues, especially in today’s
economy.
• There is a lack of infrastructure to
support accessible design.
Informational Barriers
• Some view people with disabilities
as not having the same wants and needs as people without disabilities.
• Sometimes designers fail to consider
the possibility that someone with a disability would attempt to
use the products they design.
• Sometimes accessibility features are
poorly communicated to the consumers who require the features.
• For the most part, specific information
about accessibility and disabilities is not easy to obtain.
• Companies often do not know how to
market to people with disabilities.
• Consumers are not familiar with their
rights under Section 508 and Section 255.
• Some designers do not have sufficient
access to assistive technology interface requirements.
• Engineers and designers are not sufficiently
exposed to accessible design at the university level.
• Accessibility is often interpreted
narrowly to only include physical access to the technology.
Financial Barriers
• The cost of developing new technologies
associated with accessibility is often seen as prohibitive.
• The target market for accessible design
is not well understood or defined.
• There is a general lack of sources
of funding for research in accessible design.
• Some people feel that the business
case for accessibility is weak.
• It is difficult for companies to market
to consumers with disabilities.
• The cost associated with retrofitting
existing products is significant.
• The cost associated with purchasing
accessible products is not affordable by people with disabilities.
• The technology required to produce
accessible products is not available at a reasonable cost.
Legal Barriers
• Some companies feel that they are under
pressure to self-certify compliance with Section 508 in order to
compete.
• Some feel that federal regulation does
not go far enough in detailing the requirements that industry must
meet. Others feel that the regulations unnecessarily restrict creative
design and innovation.
• Exploration of the federal requirements
through litigation is both time consuming and costly.
• Some companies believe their competition
is incorrectly representing their product’s accessibility.
• Procurement officials do not understand
accessibility requirements to a sufficient degree. Officials may
not be able to recognize when an accessibility claim is false.
• Section 508 is either not being adhered
to or is being adhered to inconsistently.
Industry Study Data
Collection Methodology
Six companies or industry partners were selected
for participation in the study. Once the companies were identified
and the points of contact (POCs) established, each was given a list
of topics related to accessibility in the company. Georgia Tech
requested initial reactions during preliminary phone interviews
and then conducted onsite visits and in-person interviews with various
individuals involved in the accessibility program. Some industry
partners chose to provide detailed documentation and formal responses
to our initial inquiries before the interviews. The purpose of the
in-person interview was to obtain additional information and documentation
to enhance the initial responses provided on the topics of interest.
The data collected were based on a series of topics
related to accessibility in each company. The type and format of
data requested in response to each of the 10 topic areas is listed
below:
1. Documentation of current design practices, with
emphasis on user interface design and other aspects of products
related to accessibility and UD.
2. Documentation of current product evaluation practices,
with emphasis on accessibility and UD.
3. Key personnel who make decisions about product
design, product selection, and/or marketing related to accessibility
and UD.
4. Current products (fielded or in development) with
specific accessibility features or other direct relationship to
accessibility.
5. Lessons learned in developing accessible products.
Focus on: organizational barriers encountered, technical challenges,
financial barriers, informational barriers, and legal challenges.
6. Company forecasts of demand and requirements for
products with accessibility features.
7. Company training materials related to accessibility
and UD.
8. Company-funded research into accessibility and
UD.
9. Company contact with members of the disability
community relevant to product accessibility and usability by individuals
with disabilities.
10. Company position on product accessibility and
UD.
Georgia Tech scheduled an initial meeting with the
company POC, during which time the industry study objectives and
data requirements were reviewed in detail. Any readily available
information was collected, and the company POC was charged with
identifying sources for archival data and arranging personal interviews
with individuals qualified to supply the required information. The
data analyzed in this summary is based on materials provided directly
from the company, notes from the in-person meeting, and publicly
available materials.
Analysis of Industry Data:
Factors Influencing Adoption of UD Practices
As defined by Tobias and Vanderheiden (1998), the
primary factors that influence the adoption of UD principles are
government regulation (or the threat of regulation) and profitability.
The purpose of the industry study was to build upon previous work
and understand how the perception of profitability impacts UD.
Eleven business concerns have been identified as
having an influence on UD practices within an organization. Each
business concern has a different level of influence, depending on
the strength of the other factors. The factors influencing the adoption
of UD practices include the business case, strategy and policy,
demand and legislation, marketing and sales, research, design, testing,
resource allocation and funding, organization and staff, training,
and the customer and consideration of people with disabilities.
Detailed descriptions of the impact of each business concern on
UD are described below.
Business Case
The business case is the financial justification
and plan for including accessibility in product design. Central
to consideration of the adoption of UD principles for all six industry
partners was the identification of a compelling business case to
justify committing the required resources to the effort. Someone
at a company wishing to add accessibility features to an existing
product or to add schedule and budget to accommodate building accessibility
into the design of a new product is often required to justify the
added expense by producing either a formal or informal business
case for accessibility.
Several methods might be used to construct a business
case. Each method relies on the interpretation of market forecasts
and sales data and is, therefore, somewhat subjective. For example,
a senior manager might look at federal sales data and determine
that the number of sales at risk because of the production of inaccessible
products is negligible; therefore, it produces a very weak business
case for accessibility. A second senior manager might look at the
same data and see great potential for increasing the market share
of federal sales by enhancing accessibility; therefore, he or she
might determine that the business case for accessibility is strong.
The industry study identified the following primary
justifications for the business case for UD:
• Increase market share to include people
with disabilities
• Increase federal sales market share
• Reduce risk of losing market share
• Increase overall usability of the product
or service
• Reduce risk of costly legal action
• Increase status as a corporate citizen
While increasing market share in general is traditionally
regarded as a strong justification for a business case, the potential
to increase market share by extending the market focus to cover
people with disabilities is often seen as a relatively weak business
case, primarily for two reasons. First, the market for people with
disabilities is highly segmented. The cost associated with developing
a product for users with various disabilities and levels of functional
capabilities is not justified by the potential of direct sales to
people with disabilities. Second, the amount of disposable income
available to people with disabilities is not perceived to be great.
The additional cost associated with producing accessible products
cannot be passed along directly to consumers with disabilities.
Companies do not appear to fully appreciate the potential
value of extending their market share to nontraditional markets
through UD. UD is generally associated with design for inclusion
of people with disabilities. The market analysis documented elsewhere
in this report illustrates that this view of the market for UD products
is unnecessarily restrictive. Companies representing the six product
lines selected for analysis have failed to embrace the extended
market perspective for UD products.
The introduction of Section 508 of the Rehabilitation
Act, which requires federal agencies to consider accessibility in
the procurement of most products and services, should have had a
direct impact on the calculation of the market size of UD products.
Sales to the Federal Government represent a significant portion
of sales for many companies producing E&IT products and related
services. Based on the face value of Section 508, businesses wishing
to increase federal sales might do so by developing a more accessible
product than the competition and using accessibility as a key discriminator
on competitive bids. However, many of the industry partners failed
to recognize the potential increase in federal sales as a strong
business case, perhaps because of the perception that procurement
officials are not consistent in enforcing Section 508.
Possibly more compelling than the potential increase
in federal sales is the threat of loss of Federal Government market
share to a competitor. A company that enjoys a large share of the
federal market potentially could lose market share if a competitor
creates an accessible product that federal procurement officials
choose over the traditional supplier in an effort to conform to
the requirements of Section 508. In reality, none of the companies
participating in the industry study were aware of any lost sales
that could be attributed directly to a procurement official’s
attempt to conform to the requirements of Section 508.
Business cases are sometimes generated in response
to less tangible benefits and threats that are not directly related
to a company’s market position. For example, one of the companies
in the industry study referred to corporate citizenship as a justification
for research into accessibility and UD. Another company perceived
accessibility as clearly being related to usability, which had been
identified as a key market discriminator. Finally, one company mentioned
a concern about avoiding future legal actions as a motivator for
accessibility.
Strategy/Policy
Strategy is the high-level plan for UD or the implementation
of accessible design features. A policy is a written statement that
is a reflection of corporate strategy. Most industry partners had
an informal or formal policy statement approved by senior management;
however, they differed widely in their content and implementation.
External policy statements tended to be used primarily for marketing
and had little overall impact on processes and procedures. When
an internal policy statement was drafted and issued to employees,
it usually had the effect of temporarily increasing awareness of
accessibility; but a sustained, corporatewide commitment is rare
without the dedication of resources. Internal policy statements
that lack an associated commitment of resources are rarely enforced.
An effective policy must reach the level of a corporate
instruction or directive and must address inclusion of people with
disabilities in design and evaluation of products, increased training,
incorporation of documented standards and guidelines, increased
research and development, increased marketing of accessibility features
and efforts, and lowered costs for products with accessibility features.
The policy must also be associated with an implementation plan and
a commitment of needed resources.
Corporate culture had a strong influence on accessibility.
In two of the six companies in the industry study, employees reported
that the corporate culture was such that accessibility was just
expected to be considered when making design decisions. A strong
corporate culture was generally associated with a strong customer
voice requiring that accessibility be considered. Accessibility
will be considered, independent of policy, if the customer demand
is great. Policy tended to be more entrenched in corporate culture
if someone from senior management experienced a disability or had
a close relationship with someone with a disability.
Resource Allocation/Funding
Resource allocation and funding was the single most
frequently identified reason for the failure of accessibility policy.
Four of the six companies had money earmarked for staffing accessibility
program offices; however, the program offices were often underfunded
and did not have sufficient resources to effect change within the
corporation. In some cases, the accessibility program office consisted
of only one or two individuals who served as the focal point for
accessibility concerns throughout the company. Only one company
earmarked money specifically for accessibility research. Outreach
to employees was also severely limited. The accessibility program
offices often developed plans for implementing universal or accessible
design but lacked funding to appropriately implement the plan.
At least one company that decided to commit to accessibility
and establish an accessibility program office was reevaluating the
commitment of resources because of an inability to demonstrate return
on investment (ROI). The company sighted a lack of impact of accessibility
features on federal procurement decisions as the primary motivator
for reconsidering its commitment to accessibility. Companies spending
less money on accessibility were not perceived to suffer decreased
sales as a result of Section 508 procurement regulations.
Organization/Staff
Several methods of staffing for accessibility issues
were observed. The most common staffing organization, utilized by
four out of the six companies, involved the development of an accessibility
program office responsible for UD and accessibility issues throughout
the corporation. The size of the accessibility program offices varied
from a single member to a staff of five or six with a background
in accessibility issues. In other cases, responsibility for accessibility
was integrated into existing groups, such as marketing or human
factors.
Two staffing trends were noticed. First, the presence
of a single accessibility champion or a small number of accessibility
champions was very common among the industry partners. The success
of the accessibility program within a company that must rely on
the work of a very small number of accessibility champions was directly
related to the workload or attrition of the champions. Loss of an
accessibility champion could result in a major setback of accessibility
objectives. Second, the accessibility program office may become
a place to assign nonproductive personnel. While the majority of
accessibility program offices are staffed by competent individuals
capable of advancing UD principles if given adequate resources,
some companies have assigned accessibility to individuals who are
either transitioning between departments or are experiencing difficulty
marketing themselves within the company.
The missions of the accessibility program offices
also varied widely. In some cases, the program offices were mostly
reactive, responding to requests for information or to solve particular
accessibility concerns. In other cases, the accessibility program
offices were very proactive and focused on developing and testing
new technologies that might be integrated into future products.
In reality, a balanced approach is required. The group charged with
accessibility should be able to respond to the immediate needs of
the corporation as well as contribute to future planning and development
of universally designed products.
Unfortunately, the accessibility program office in
the four companies that had program offices demonstrated very little
control over design decisions that directly impacted the accessibility
of the final product. The accessibility program office should be
constructed to include groups or individuals who have decision-making
responsibilities to influence accessibility within the products.
This may include a human factors or accessibility group, or even
an oversight group that can serve as a resource for other groups
within the company. It also helps for accessibility awareness to
be widespread throughout the company. One method of accomplishing
this is to have staff in each group or available to each group who
have more extensive training and who can advocate for inclusion
of accessibility features.
Another staffing mechanism for enhancing accessibility
practices within the company is to hire people with various disabilities
and ensure that they are involved with design and evaluation of
products. However, this mechanism can be used inappropriately. For
example, it would be inappropriate to send a new product to a single
employee with a disability and ask the employee to quickly review
the product rather than conducting more extensive product testing.
This approach is especially problematic if the employee has other
responsibilities, has little experience with product evaluations,
and is not prepared to comment on the accessibility of the product
beyond his or her own personal experiences.
Training/Awareness
Some corporate accessibility training was offered
to employees; however, training relating to UD and accessibility
is not widespread. The most common type of training was aimed at
increasing employee awareness of Section 508, accessibility policy,
people with disabilities, and the specific accessibility issues
associated with the products that the company produces. An important
function of several accessibility program offices was to provide
targeted training to key decision makers as needed. The targeted
training was largely informal and usually conducted on a rather
limited basis. The training offered is generally focused on program
managers and design teams. Very little training is offered to sales
or marketing teams.
Typically, accessibility awareness is made available
on an as-needed basis and is specific to a project. In some cases,
a brief introduction is provided to all employees regarding the
importance of UD, but sometimes it is simply awareness through diversity
training. Training materials may include an overview of the range
of disabilities (including situational disabilities), assistive
technologies, principles of UD, minimal design requirements, business
and consumer arguments for addressing accessibility, consequences
of not addressing accessibility, a review of accessibility features,
legal requirements, and barriers and lessons learned.
Staff training is one of the best mechanisms for
getting accessibility included in product design. Oftentimes accessibility
is overlooked because of a lack of awareness of the issues. People
do not realize how inaccessible products can be to individuals with
disabilities, and they do not understand how much an individual’s
life can be improved with the availability of more accessible products.
Training can greatly impact accessibility practices through increasing
awareness of disability issues, increasing awareness of standards
and guidelines, and providing tools (processes and checklists, for
example) to facilitate accessibility implementation.
Companies should be aware of hidden messages within
corporate training. For example, if a company emphasizes Section
508 conformance over accessibility in general, employees may come
to view UD and accessibility as a federal sales issue. Designers
may choose to ignore accessibility requirements if they know that
their product is not likely to be marketed to the Federal Government.
To be effective, training should be tailored for
the decision makers who routinely impact accessibility in the corporation.
Technical staff might like to consider the needs of people with
disabilities, but they are junior staff members who do not have
the power to implement major design decisions. Technical staff training
is effective if concrete design examples and information about integrating
UD guidelines into the design process are offered. However, changes
to the design process are often resisted by middle managers, who
argue that extra development time would be required, that money
must be expended, or that these changes are not relevant to the
target market. The key decision makers are the key product team
members and the personnel who are responsible for defining the products’
functional requirements.
One successful method of providing UD and accessibility
awareness training is to incorporate basic constructs into employee
induction training. Other successful training methods include alternate
delivery methods, such as a video on the importance of UD and the
impact of inaccessibility on the lives of people with disabilities.
Computer-based training materials have also been used to increase
general awareness of accessibility issues.
Research
With one notable exception, the accessibility program
offices of the four companies participating in the industry study
were not directly linked with corporate research. One company was
able to successfully integrate personnel with research experience
into the accessibility program office. This integration allowed
the program office to offer design solutions to the accessibility
problems that it identified through testing. However, most accessibility
program offices were not in a position to influence research priorities
or review research before it was integrated into a product development
cycle.
Several companies successfully employed external
consultants to assist with UD or accessibility research. However,
externally funded research tended to be more exploratory in nature
and less focused on design-oriented solutions.
Research into accessibility issues is dependent on
available funding. Much design work is dependent on research into
the best way to implement accessibility features, compatibility
with assistive technologies, and development of emerging technologies.
Advanced and ongoing research can influence accessibility implementation
through identification of features that are useful for the disability
community, cost effective, and appealing to a wide population.
Design
In many cases, accessibility processes are in place
for both design and quality assurance, including user-centered design,
but are either not documented or not followed consistently. Accessibility
requirements are not well integrated into existing design processes.
For those companies that do include accessibility requirements in
the design process, the requirements are typically tailored to the
specific product line or range of product lines produced by the
company.
Design decisions are made by a range of personnel.
Industrial designers or a design management team typically handles
display and control layout. Product managers or core team members
detail the design and ensure manufacturability. Design decisions
are also made at the engineering level. Typically, decisions about
trade-offs are made at an upper management level. Decisions about
product requirements are typically handled at the marketing level.
Accessibility champions can have some influence over the design,
independent of the above-mentioned roles.
All six companies participating in the industry study
adopted some variant of a product development or life cycle design
process. However, each company varied in the extent to which engineering
process manuals were followed. Smaller projects and internal research
and development projects tended to operate outside of the formally
defined development process. None of the companies reported immediate
changes to the development process in response to Section 508. Rather,
UD and accessibility requirements have slowly been integrated into
the development process, mainly in response to efforts from members
of the companies’ internal accessibility program offices.
Three of the six companies reported that accessibility was addressed
in its formal engineering product manuals. However, two of those
three companies reported that their formal engineering process simply
required that accessibility be considered at some point in the design
process. In general, detailed requirements or checklists relating
to accessibility were not found in formal design documents.
The product life cycle design process is designed
to manage the product from its inception through its retirement
and eventual cessation of support. Although different companies
have different names for their individual design processes, the
processes all generally follow these steps:
• Product planning
• Requirements definition
• Product specification
• Development
• Verification and testing
• Manufacturing
• End-of-life management
In order for UD principles to be incorporated into
the final product, the principles must be considered at the very
beginning of design. Accessibility simply must be considered during
product planning. Companies that relied solely on accessibility
testing after product development were unable to have a substantial
impact on the overall accessibility of the product. Product planners
must decide very early on whether accessibility will be considered
in the design of the product and to what extent the product will
meet or exceed accessibility technical guidelines. Companies that
failed to consider accessibility early in product development often
failed to have a significant impact on the accessibility of the
final design.
In the requirements definition phase, it is important
to define objectively testable requirements for accessibility. It
is not sufficient to require that the product be accessible because
doing so provides little information to designers and prevents accessibility
verification testing. Vague accessibility requirements are more
likely to be ignored in both the development and the verification
and testing phases of design. Proper accessibility requirements
should be defined in the form of the incorporation of relevant Section
508 technical requirements or specific functional performance requirements.
For example, the requirements document could incorporate specific
paragraphs from Section 508 technical requirements that apply to
the specific product under development, or it could require that
specific user tasks must be able to be performed by a given population
of users with specified functional capabilities and limitations.
During the product-specification phase, the functionality
and appearance of the product is defined in accordance with the
definition of product requirements. Personnel with expertise in
UD must be available to assist in defining the specifications, reviewing
the product specifications that impact accessibility, and determining
if the accessibility-related product requirements are met by the
product specification. Major changes to the product design are unlikely
after the product specification has been produced, so it is critical
that accessibility be considered before moving on to the design
phase.
During development, the design is conceptualized,
produced, and prototyped. Typically, a project leader will arrange
a multidisciplinary team that might involve members of engineering,
computer science, industrial design, human factors, quality assurance,
and marketing. At least one member of the development team should
have an understanding of the accessibility issues related to the
product under development. Iterative testing and development are
important during this phase.
Testing
Companies participating in the industry study routinely
performed usability testing, but they rarely included users with
disabilities in usability testing and rarely conducted user testing
for accessibility. Accessibility evaluations are different from
standard usability evaluations in at least three ways. First, accessibility
evaluations measure the degree to which a specific impairment restricts
the operation of a device. In addition to measuring how effective
a device is, usability evaluations also tend to measure customer
satisfaction and efficiency. While satisfaction and efficiency data
may be collected during an accessibility evaluation, this type of
data is not the primary focus. A device may have usability issues
and still remain accessible, as long as usability problems of the
device do not disproportionably affect the ability of a user with
an impairment to accomplish a given task. Second, accessibility
evaluations are, in general, performance based rather than subjective.
The focus of an accessibility evaluation is generally on measuring
functional performance. Finally, the primary motivation for performing
an accessibility evaluation is compliance with government regulations.
While technical standards and guidelines for usability certainly
exist, few legal requirements must be met in order for a device
to be considered usable.
Federal procurement officers, in an attempt to comply
with Section 508, routinely request information about the accessibility
of a product prior to a purchase. All of the companies that participated
in the industry study reported some level of UD or accessibility
testing. However, the depth and breadth of the testing varied widely.
Most testing was performed in order to fill out a voluntary product
accessibility template. One company’s engineering process
required that a VPAT be constructed prior to launching the product.
Although it is unlikely that an unfavorable evaluation would delay
product launch, requiring the VPAT prior to product launch does
force the design team to consider accessibility. VPATs are often
requested by federal procurement officers as part of their required
market research. Two of the six companies performed quality assurance
or requirements-verification testing as part of the normal design
process.
Testing was generally restricted to an inspection
for conformance with the technical requirements of Section 508.
Notably, the functional performance requirements of Section 508
were often overlooked. The functional performance requirements are
perceived as being difficult to test. The most effective method
of testing the functional performance requirements of Section 508
involves user-in-the-loop testing with representative members of
the disability community. Use of a task-based approach is critical
to accurately measuring accessibility and directly comparing the
accessibility of more than one similar product. None of the industry
partners routinely performed user testing for the purpose of measuring
conformance with the functional performance requirements of Section
508.
The industry partners were split regarding a preference
for internal or independent, third-party testing. Three companies
preferred to keep testing in-house, and three companies preferred
to contract an independent lab to perform testing.
As with any kind of testing, accessibility evaluations
are more effective if they are conducted in conjunction with an
iterative design process. Testing can have the greatest impact on
accessibility if people with disabilities are included in the evaluation
process and have the opportunity to do early testing to facilitate
design changes.
Demand/Legislation
Demand is impacted by consumer need and interest
as well as legislation requiring accessibility. Demand can influence
the presence of UD features in three ways. First, consumers may
voice their interest in products with accessibility features. If
customer demand is great enough, companies are likely to address
accessibility issues. Second, some companies primarily market to
other companies. For example, cell phone manufacturers market their
products to cellular network providers. The purchaser, the cellular
network provider in this example, is in a strong position to pass
along requirements for UD to the manufacturer. Finally, if enforceable
legislation requires the government to purchase accessible products
or requires a minimal level of accessibility, industry will not
be able to ignore the need to incorporate accessibility features
into their products.
However, legislation has not been effective in increasing
demand for accessible products. Many problems stem from conflicting
requirements. Local and global requirements may differ. The business
customer’s requirements may differ from other requirements
that support accessibility for the end-user. In addition, the regulations
do not change as quickly as technology does, limiting the development
of enhanced capabilities. Not all consumers have the latest version
or model, rendering some applications inaccessible for those using
older technologies. To complicate the issues further, the federal
requirements are too general to be particularly useful and lend
themselves to various interpretations. Some companies even misrepresent
accessibility of their products, claiming to be 100-percent accessible,
but fail to deliver an accessible product or deliver only a partially
accessible product.
Marketing/Sales
One method of increasing demand involves adequate
marketing of products with accessibility features. Often, companies
develop products that have accessibility features, but they are
not marketed as features that support the needs of a particular
disability population. Unless the consumer does extensive research,
it may not be evident that the features exist. Consumers do not
always know what to ask for or how to ask, so unless the products
are marketed appropriately or the sales staff is trained to identify
features that may benefit a particular user, awareness of those
features will remain low. Sales staff should be trained to discuss
accessibility features with consumers, to spot consumers who may
benefit from particular features, and to relay customer requests
back to designers or some other appropriate department within the
company who will get those requests factored into design considerations.
Some companies do not have any forecasts for accessibility
marketing. There is considerable recognition that the aging population
is increasing and will need to be accommodated, though this is not
addressed in the current marketing strategy. There is also an increased
recognition for accommodation of temporary disabilities resulting
from a physical or mental impairment or from an environmental or
situational limitation.
Customers/People with Disabilities
The final influences on accessibility are the customer—whether
a business customer (for example, the carrier in the case of cell
phones) or the end-user. When a business customer is the major driver
of product requirements, UD solutions are not likely to be integrated
into a product if they are not requested.
End-users, including people with disabilities, can
influence the design process by supporting companies in their efforts
to generate products that include accessibility features. Customers
can also influence the design process by making their problems and
successes known to the companies so that the designers can build
on that knowledge and improve the process for future product development.
However, there were few examples of how customer feedback resulted
in a change to the design of a product.
Many companies shy away from direct interaction with
people with disabilities and disability advocacy groups. Companies
often perceive that inclusion of people with disabilities is complicated,
perhaps even aversive in nature. As an alternative, they sometimes
have phone contact with various accessibility organizations that
assist them in understanding the needs of users with various functional
limitations. The quantity and quality of the guidance received from
the advocacy group is perceived to be largely dependent on who happens
to answer the phone on a given day.
Companies are often hesitant about interaction with
disability advocacy groups unless the technology that they are developing
is perceived to be accessible. Companies often seek an advocacy
group’s “stamp of approval” but rarely interact
directly with the group to improve the accessibility of an inaccessible
product. Some companies interact specifically with employees with
disabilities, but do not involve outside individuals. Other interaction
is through conferences, workshops, or trade shows. Some companies
perform user testing internally or through outside consultants,
and this occasionally involves people with disabilities.
Analysis of the Industry
Study Findings
All of the companies that participated in the industry
study have made strategic decisions to address the accessibility
of their products and services. A few of the companies had long-standing
accessibility programs that were reinvigorated by the technical
requirements of Section 508. Other companies initiated their accessibility
activities while planning for their response to Section 508. Regardless,
Section 508 has clearly had an impact on the way accessibility and
UD are being addressed within industry. The most common approaches
to addressing accessibility issues were the following:
• Increasing the awareness of employees
• Integrating accessibility requirements
into the design process
• Performing accessibility verification
testing
• Establishing an accessibility program
office
All six companies in the industry study provided
training, formally or informally, to a subset of their employees.
Three of the companies in the industry study have integrated accessibility
guidance, particularly the technical requirements of Section 508,
into their design process. Four of the six companies performed accessibility
verification testing for the purpose of generating a VPAT for federal
procurement officials. Finally, three of the industry study partners
established accessibility program offices in order to coordinate
accessibility activities within the company.
The industry study has identified a number of situations
where UD principles have been successfully integrated into corporate
culture; however, there are still numerous opportunities for improvement.
First, legislation has had an impact on the accessibility of E&IT,
but it has fallen far short of its potential to inspire universally
designed products. Second, the industry study identified a number
of barriers to accessibility experienced by the industry study participants.
Some issues were associated with specific industries; however, the
vast majority of barriers are common to all industries represented
by the six product lines selected for study. The potential to develop
interventions that are likely to have a profound effect on a large
number of companies producing E&IT products and services is
significant.
A research project studying the barriers to UD was
conducted from 1996 to 1998 by Dr. Pieter Ballon, Dr. Gerd Paul,
Dr. Leslie Haddon, and Dr. Monique van Dusseldorp under the European
Union’s Telematics Applications for the Integration of Disabled
People and the Elderly (TIDE) program. The team interviewed 68 managers
from telecommunications, computer hardware, software, electronic
commerce, public information services, Internet, broadcast, and
interactive services. The interviewees were middle- and high-ranking
managers from marketing, product management, design, and usability
departments, primarily in the Netherlands, Germany, and the United
Kingdom. Ballon’s team found that a low awareness of UD was
present among these upper- and mid-level managers. Few of them believed
that UD would improve industry’s development practices.
The researchers did find a number of positive factors.
Many of the managers understood and appreciated the concept of UD
because it fits with their existing criteria for good design. At
the same time, UD is compatible with trends within the IT industry
to offer solutions that adapt to users’ preferences, experience
levels, and task requirements. Finally, the researchers found interest
in the possibility of expanding markets to include older people
and people with disabilities.
The researchers felt that the quality of marketing
information concerning the needs of real and potential users was
comparatively low in the E&IT industry when compared with other,
more mature consumer goods industries. In most E&IT industry
sectors, information and guidelines on inclusive design are lacking.
They found that larger companies have more means and procedures
with which to consider the user and his or her needs in the design
process than small enterprises, especially start-up firms in software
and Web design.
The research identified nine types of barriers to
the implementation of UD principles. At the most general level are
barriers relating to a failure to sufficiently consider or involve
any end-users in the design process. More important, companies fail
to consider or involve older and end-users with disabilities in
the design process. Some general developments in the E&IT industry
also have a negative impact on implementation: the speed of product
development, market trends, and industry organization.
For the industry study, a list of potential barriers
to UD was reviewed with each of the industry partners. The industry
partners were asked to comment on their experiences and report methods,
if any, that were used to overcome the barriers. The purpose of
the study was to build upon the findings of the TIDE program by
reviewing an extensive list of accessibility barriers with E&IT
companies competing in the U.S. market. The following barriers were
common to most of the companies participating in the industry study:
• Section 508 is either not being adhered
to or is being adhered to inconsistently.
• Some people feel that the business
case for UD and accessibility is weak.
• A standard accessible design process
has not been documented, tested, or verified.
• There is a lack of realistic standards,
guidelines, and principles of accessible design.
• There is no standardized method of
measuring accessibility or comparing the accessibility of two similar
products.
• Many feel that there is no clear definition
of how accessible a product has to be in order to be considered
an accessible design.
• Often there is a lack of communication
across departments regarding accessibility requirements.
• Many companies lack accessibility champions
who are in a position to influence company decisions.
• Middle management often perceives accessible
design to be in direct conflict with schedule and budget requirements.
• Individuals with disabilities are not
integrated into the design or evaluation processes.
Common barriers identified during the industry study
are discussed in detail in the following paragraphs:
Section 508 is either not being
adhered to or is being adhered to inconsistently. Inconsistent
application of Section 508 by federal procurement officials was
the most commonly heard complaint among the industry partners. As
might be expected, the industry partners that did not market to
the Federal Government were less concerned about Section 508 issues.
Two of the industry partners did not market to the
Federal Government, and four of the partners produced products that
were directly marketed to the Federal Government. The industry partner
representing a distance learning software company markets its products
mainly to universities. The company perceived that it must conform
with the technical requirements of Section 508 because its customers
were demanding conformance; however, the company was technically
not obligated to develop products in conformance with Section 508.
The company made a decision to design to Section 508 because its
customers incorrectly assumed that Section 508 applied to them because
they received federal funding as public universities. The company
representing cell phone manufacturing had little experience with
Section 508 mainly because it marketed its products almost exclusively
to the cellular network carriers and did not feel much pressure
to conform to Section 508 requirements.
The four remaining companies that did market to the
Federal Government expressed discontent with the way federal procurement
officials have procured products and services under Section 508.
In general, companies responded to Section 508 in one of two ways.
Some adopted a “wait and see” attitude while minimally
responding to the requirements of Section 508. Such companies might
produce VPATs, but they were unlikely to invest resources in developing
products to conform to Section 508 until the cost could be justified.
Companies in this category have yet to experience either lost or
increased sales to Federal Government customers because of Section
508. There is a perception by some in industry that Section 508
conformance is being “rubber stamped” by procurement
officials and that the content of the VPAT is not important as long
as a VPAT is offered.
Other companies have been very proactive in their
response to Section 508. Two of the companies in the industry study
have incorporated Section 508 requirements into their design process.
However, at least one company is currently reconsidering its accessibility
program investment in response to Section 508 because it has not
realized increased federal sales from its increase in overall accessibility.
Furthermore, the company did not observe a reduction in federal
sales for competitors that were perceived as producing less accessible
products. In short, accessibility seems to have failed to become
a key discriminator, as promised under Section 508.
Some people feel that the business
case for UD and accessibility is weak. All six companies
reported that they struggled with the business case for universally
designed products and services. Most companies could not report
specific instances in which accessibility was a key discriminator
in a federal procurement. In the absence of data suggesting that
federal sales could be increased with UD or data suggesting that
federal sales were at risk because of nonconforming products,
companies were reluctant to use federal sales figures in developing
a business case for UD.
A standard accessible design
process has not been documented, tested, or verified. Several
companies have attempted to integrate UD into their standard product
development process. Process interventions typically include prompts
to consider accessibility during design, the addition of accessibility
requirements to requirements definition documents, and limited
testing with users with disabilities. However, no one has been
able to determine if the interventions are sufficient or if additional
interventions are required in order to produce accessible products
and services. The impact of the integration of candidate accessibility
interventions into the design process has not been studied extensively.
There is a lack of realistic
standards, guidelines, and principles of accessible design.
Accessibility design guidelines that are currently available are
not sufficiently detailed to have a profound effect on the overall
accessibility of all E&IT products. Some guidance does exist,
such as the technical requirements associated with Section 508
and Section 255; however, the guidance is sometimes ambiguous
or subject to alternative interpretations.
There is no standardized method
of measuring accessibility or comparing the accessibility of two
similar products. The industry partners struggled with
the issue of measuring accessibility of products or comparing
the accessibility of two similar products. An industry agreed-upon
accessibility metric does not exist. In addition, industry has
not identified a standard method of measuring accessibility. Currently,
accessibility is measured only in terms of Section 508 conformance.
The VPAT is currently the agreed-upon vehicle for reporting accessibility;
however, it does not necessarily reflect the actual accessibility
of the product it was created for, nor does the VPAT allow procurement
officials to directly compare the accessibility of two similar
products.
Many feel that there is no clear
definition of how accessible a product has to be in order to be
considered an accessible design. Many people see UD as
a goal. The goal is to create a product that is usable by as many
people in as many situations as possible. Given that complete
accessibility is either impossible or cost prohibitive, companies
are struggling with determining just how accessible their product
needs to be in order to be considered accessible. The problem
is compounded by the fact that companies do not have useful methodologies
for measuring accessibility.
Often there is a lack of communication
across departments regarding accessibility requirements.
Communication between the accessibility program offices and other
departments was limited by the resources of the program office.
While some proactive outreach activities were observed, the accessibility
program offices were generally reactionary in nature. Most of
the decisions that impact accessibility take place within product
design teams working on specific projects and outside the influence
of the program office. Also, sales departments in two of the industry
partners were not well connected with personnel making decisions
about new product development. In two companies, the demand for
accessible products was great, but that demand was not communicated
to the group defining the requirements for the next generation
products.
Many companies lack accessibility
champions who are in a position to influence company decisions.
Accessibility champions working within the companies participating
in this study had diverse backgrounds and job responsibilities.
The accessibility champion, in order to be truly effective, must
be able to influence corporate decisions for the purpose of setting
priorities and securing resources to further UD efforts.
Middle management often perceives
accessible design to be in direct conflict with schedule and budget
requirements. Project managers are responsible for making
sure that a development project comes in on time and on budget.
Since accessibility generally does not have a specific budget,
the research required to identify accessibility requirements and
integrate them into the design is perceived as being a threat
to the objectives of the project manager. If accessibility features
can be developed without adversely impacting budget and schedule,
they have a chance of be integrated into the product; however,
accessibility activities are often the first activities to be
cut if budget and schedule are threatened.
Individuals with disabilities
are not integrated into the design or evaluation processes.
Many of the industry partners did not include people with disabilities
in either the design phase or the testing and evaluation phase
of product development. Tight schedules and limited resources
were the most common reasons sited for lack of integration of
people with disabilities into the design process. Other problems
exist because of the accessibility barriers themselves. For example,
it would be difficult to find a user who is blind and has extensive
experience with computer-based training software if computer-based
training software is generally inaccessible to users who are blind.
Also, very few users with disabilities are experienced in participating
in design focus groups or accessibility evaluations. Industry
partners that perform user testing with people with disabilities
typically perform only very limited or sporadic testing.
Barriers Specific to Product Lines
ATM Industry UD Barriers.
The most important barriers to UD expressed by the industry partner
representing the ATM industry were the following:
• A standard accessible design process
has not been documented, tested, or verified.
• Sometimes accessibility features are
poorly communicated to the consumers who require the features.
• The cost of developing and fielding
new technologies associated with accessibility is often seen as
prohibitive.
• Personnel responsible for making accessibility
decisions often have little knowledge about accessibility or accessible
design.
• Accessibility is often interpreted
narrowly to include only physical access to the technology.
Barriers specific to the ATM industry identified
during the industry study are discussed in detail in the following
paragraphs.
A standard accessible design process
has not been documented, tested, or verified. Factors beyond
the immediate control of manufacturers of ATMs often affect the
accessibility of ATMs. For example, while the manufacturer supplies
guidelines for placement of the ATM, the purchaser of the ATM may
choose to install the ATM in an inaccessible location. Furthermore,
the purchaser often insists on loading custom software onto the
ATM that may or may not take advantage of the built-in accessibility
features of the device.
Sometimes accessibility features
are poorly communicated to the consumers who require the features.
Some users may not be fully aware of the accessibility features
available on ATMs. UD features may not be utilized if users are
unable to identify which ATMs possess the features or understand
how to use them. While manufacturers often create end-user instruction
materials and product brochures, the applicability of the materials
is limited by the extent of software customization performed by
the purchaser.
The cost of developing and fielding
new technologies associated with accessibility is often seen as
prohibitive. ATMs represent a substantial investment for
the purchaser. Replacement of ATMs is often cost prohibitive and
extremely difficult. Furthermore, the life expectancy of ATMs is
such that they rarely need a full replacement. Product components
are simply replaced as needed or as substantially upgraded functionality
is made available. Accessibility enhancements are unlikely to justify
replacement of an existing ATM or even provide justification for
replacing key ATM components. However, if the accessibility enhancements
are bundled with security or performance enhancements, purchasers
may find the upgrade more attractive.
Personnel responsible for making
accessibility decisions often have little knowledge about accessibility
or accessible design. Banks may place the ATM in an inaccessible
location, may design inaccessible screens, or may design the pathway
to the ATM in such a way as to make it inaccessible
Accessibility is often interpreted
narrowly to include only physical access to the technology.
During a normal design process the total user experience is often
considered; however, it may be overlooked when the design is focused
on accessibility. For example, when addressing access issues for
individuals in a seated position, the inability of the user to privately
enter his or her PIN is overlooked. A seated person cannot conceal
the key presses in the same manner as someone standing. Accessibility
evaluations should address the total user experience and not just
the physical access issues.
Cell Phone Industry UD Barriers.
The most important barriers to UD expressed by the industry partner
representing the cell phone industry were as follows:
• Marketing and technology trends sometimes
run counter to accessibility requirements.
• Sometimes accessibility features are
poorly communicated to the consumers who require the features.
• Companies often do not know how to
market to people with disabilities.
• The cost associated with purchasing
accessible products is not affordable by people with disabilities.
Barriers specific to the cell phone industry identified
during the industry study are discussed in detail in the following
paragraphs.
Marketing and technology trends
sometimes run counter to accessibility requirements. Several
marketing trends currently run counter to UD within cell phones.
Miniaturization is currently driving the development of most cell
phones. As the form factor of cell phones is reduced, the space
available for both the display and the keypad is reduced. Users
who have difficulty reading information on small displays or users
who have difficulty selecting small keys have difficulty using small
cell phones. In addition, there is a current trend to expand the
capabilities of phones to include PDA functionality. The “smart
phones” are controlled by complex menu structures that may
be difficult for some users to navigate.
Sometimes accessibility features
are poorly communicated to the consumers who require the features.
Cell phone manufacturers build phones to the requirements specified
by the carriers and often have little interaction with end-users.
In general, the cellular network providers are the exclusive customers
of the cell phone manufacturers. The cell phone manufacturers have
little control over how their products are marketed to end-users.
Therefore, accessibility features built into cell phones are often
not communicated to the end-user.
Companies often do not know how
to market to people with disabilities. In the cell phone
industry, this issue applies to the cellular network providers rather
than the manufacturers. The sales staff members of the cellular
network providers are often not familiar with the accessibility
features of the phones operating on their networks and are incapable
of advising people with disabilities about their purchase decision.
The cost associated with purchasing
accessible products is not affordable by people with disabilities.
Accessibility features tend to be added to the high-end products,
which are typically not subsidized by the carrier. Higher processing
speeds and greater memory are often required to operate accessibility
features such as voiced menu options. Phones containing adequate
processing and storage resources tend to be relatively expensive.
In addition, customized third-party software designed to increase
the accessibility of programmable phones is expensive and therefore
out of reach of most users with disabilities.
Distance Learning Software Industry
UD Barriers. The most important barriers to UD expressed
by the industry partner representing the distance learning software
industry were the following:
• Designers lack an understanding of
accessible design and what can be achieved if products are designed
with accessibility in mind from the beginning.
• There is a lack of tools and resources
useful for efficiently creating accessible products.
• The amount of time required to produce
accessible products is prohibitive.
Barriers specific to the distance learning software
industry identified during the industry study are discussed in detail
in the following paragraphs.
Designers lack an understanding
of accessible design and what can be achieved if products are designed
with accessibility in mind from the beginning. Although developers
of the core distance learning software seem to understand and design
for accessibility, the developers of course content may not have
the same appreciation for UD. Professors, teachers, instructors,
and teaching assistants are responsible for the development of the
vast majority of distance learning course content. The content may
consist of videotaped lectures, audiotapes, transcripts of lectures,
PowerPoint presentations, PDF documents, multimedia presentations,
streamed video, and electronic texts. Each content type is associated
with very specific accessibility issues. For example, streamed video
should be closed captioned and, in some cases, audio described in
order to be considered accessible. Unfortunately, few content providers
are able to commit the necessary resources required to develop fully
accessible content.
There is a lack of tools and resources
useful for efficiently creating accessible products. The
tools available to content providers provide very little assistance
in creating accessible content. Often, content must be recoded manually
in order to be accessible. For example, the effort required to design
and develop an accessible slide presentation is often many times
greater than the effort required to create the presentation without
the accessibility features. Presentation software such as Microsoft’s
PowerPoint does not natively generate accessible content. Therefore,
the content provider must work outside of the presentation software
to develop an accessible HTML representation of the original presentation.
The amount of time required to
produce accessible products is prohibitive. The effort required
to caption one hour of video can take an experienced professional
as much as 14 hours to complete. Content providers simply do not
have the time, resources, or the tools to create fully accessible
distance learning content.
PDA Industry UD Barriers.
The most important barriers to UD expressed by the industry partner
representing the PDA industry were as follows:
• Marketing and technology trends sometimes
run counter to accessibility requirements.
• Companies often do not know how to
market to people with disabilities.
• The cost associated with purchasing
accessible products is not affordable by people with disabilities.
• Designers lack an understanding of
accessible design and what can be achieved if products are designed
with accessibility in mind from the beginning.
Barriers specific to the PDA industry identified
during the industry study are discussed in detail in the following
paragraphs.
Marketing and technology trends
sometimes run counter to accessibility requirements. The
primary interface for most PDA devices, such as Palm OS or Pocket
PC-based products, is a touch-sensitive stylus interface. The touch-sensitive
interface, like the touchscreen interface, is not accessible to
people who are blind. Low-vision users may find it difficult to
utilize assistive technologies, such as a magnifying lens, while
holding the device and using the stylus. Users with fine motor control
limitations will find it extremely difficult to select items from
the on-screen menus because of the precise motor control movements
required to use a touch-sensitive stylus interface. Although the
potential for use of a PDA by people with disabilities is great,
the technology is currently inaccessible to many users.
Many of the elements needed for the development of
an accessible PDA are already embedded into existing products. Technologies
needed for voice recognition interfaces—such as microphones,
speakers, storage, and a sufficiently fast processor to process
the voice recognition algorithms—are generally built into
many PDAs. However, the software required to fully implement the
technology in an accessible manner has not yet been developed. As
an alternative to using the stylus interface, some programs support
navigation using the hardware keys found on many PDAs. Key press
navigation is available for some applications, but adoption of the
alternative navigation scheme is not widespread among software developers.
Companies often do not know how
to market to people with disabilities. Perhaps because of
the inaccessibility inherent in the touch-sensitive stylus interface,
the accessibility of mainstream PDAs seems to have been overlooked.
Therefore, PDAs are generally not marketed to people with disabilities,
nor is the potential for PDAs to improve the lives of people with
disabilities recognized.
The cost associated with purchasing
accessible products is not affordable by people with disabilities.
While the cost of PDAs has been reduced, they still represent a
substantial investment for consumers. People with disabilities are
reluctant, and rightly so, to invest in technologies with unproven
track records on accessibility. Accessible devices with PDA functionality,
such as Freedom Scientific’s PACMate, can cost up to 10 times
the standard PDAs. Therefore, few people with disabilities are able
to afford the devices without assistance.
Designers lack an understanding
of accessible design and what can be achieved if products are designed
with accessibility in mind from the beginning. Because of
the touch-sensitive stylus interface, many see the PDA as inherently
inaccessible, just as a digital camera is inherently inaccessible
to a person who is blind. PDAs, particularly as storage capacities
and processing power increase, are gradually becoming true handheld
personnel computers. It is reasonable to assume that a capable PDA
could employ some of the same mechanisms for accessibility as personal
computers. For example, voice displays used in conjunction with
keypad navigation could be used in a similar manner to the way screen
readers are used with personnel computers. Voice recognition technologies
could provide access to users who are unable to interact with the
screen or keys. Screen magnifiers could be employed to assist users
with low vision. Cooperation between hardware manufacturers, operating
system developers, software application developers, and AT software
developers will be needed in order to produce a fully accessible
PDA. Currently, hardware manufacturers are reluctant to change their
product unless the necessary accessibility features are built into
the operating system and demand from software application developers
increases.
Television Manufacturing Industry
UD Barriers. The most important barriers to UD expressed
by the industry partner representing the television manufacturing
industry were the following:
• Personnel responsible for making accessibility
decisions often have little knowledge about accessibility or accessible
design.
• There is a lack of realistic standards,
guidelines, and principles of accessible design.
Barriers specific to the television industry identified
during the industry study are discussed in detail in the following
paragraphs.
Personnel responsible for making
accessibility decisions often have little knowledge about accessibility
or accessible design. Accessibility of televisions depends
on the cooperation of television manufacturers, content distributors,
and content developers. Television manufacturers are responsible
for developing hardware designs to take advantage of accessibility
features, such as closed captioning and descriptive audio, added
by content developers. Content distributors must be aware of the
accessibility features and deliver the content so it does not interfere
with accessibility features. Design decisions made by television
manufacturers, content distributors, and content developers often
are made for technological, financial, or creative reasons without
consideration for accessibility.
There is a lack of realistic standards,
guidelines, and principles of accessible design. While standards
and guidelines exist for some aspects of television accessibility,
such as closed captioning, very little guidance is available for
the accessibility of most television components. For example, little
if any guidance is available for the accessibility of remote controls
or on-screen menus.
Voice Recognition Software
UD Barriers. The most important barriers to UD expressed
by the industry partner representing the voice recognition software
industry were as follows:
• The technology required to produce
accessible products is not available at a reasonable cost.
• The cost of developing and fielding
new technologies associated with accessibility is often seen as
prohibitive.
Barriers specific to the voice recognition software
industry identified during the industry study are discussed in detail
in the following paragraphs.
The technology required to produce
accessible products is not available at a reasonable cost.
Great advances in technology have improved both the response time
and accuracy of voice recognition software. However, frequent errors
and recognition delays greatly impact the overall usability of voice
recognition software. There are two basic types of voice recognition
software. Natural language recognition software, such as Dragon
Naturally Speaking or IBM ViaVoice, attempts to process and recognize
a vast vocabulary of words. Such programs can be used to navigate
computer programs as well as produce text. In general, the user
is required to tune the voice recognition software to the nuances
of his or her voice in order to obtain acceptable levels of voice
recognition accuracy. In contrast, limited vocabulary voice recognition
software, such as an automated phone attendant, improves accuracy
by constraining the number of words that the system can recognize.
Limited vocabulary systems are speaker independent and do not require
tuning to the user’s voice.
Natural language voice recognition software is still
perceived as being too inaccurate and slow for use as an alternative
to keyboard and mouse input. Users with disabilities who have used
the technology in the past are reluctant to purchase additional
software because of past disappointments. However, user perception
of limited vocabulary voice recognition software is changing. Specialized
voice recognition software can be embedded in common products such
as digital copiers and public kiosks to provide access to a device
that would otherwise be inaccessible.
The cost of developing and fielding
new technologies associated with accessibility is often seen as
prohibitive. Although the pathway to embedding voice recognition
technology in common E&IT products is understood, implementation
of the integration can be challenging. The embedded voice recognition
system typically consists of a voice recognition algorithm, audio
input and output circuitry, a processor to execute the voice recognition
algorithms, and a software vocabulary. The audio circuitry and processor
represent a nontrivial production cost. The cost to develop the
voice recognition algorithms, or license existing ones, and capture
needed samples of the vocabulary can also be expensive.
For additional information, please visit the online
version of this report located at www.ncd.gov.
List
of Acronyms and Abbreviations
| 3G |
third
generation |
| AAATE |
Association
for the Advancement of Assistive Technology in Europe |
| ADA |
Americans
with Disabilities Act |
| ADAAG |
Americans
with Disabilities Act Accessibility Guidelines |
| ANSI |
American
National Standards Institute |
| ASX |
active
streaming XML |
| AT |
assistive
technology |
| ATIS |
Alliance
for Telecommunications Industry Solutions |
| ATM |
automated
teller machine |
| B2B |
business-to-business |
| B2C |
business-to-consumer |
| BSNL |
Bharat
Sanchar Nigam Limited |
| BWA |
broadband
wireless access |
| CAGR |
compounded
annual growth rate |
| CC |
closed
captioning |
| CCG |
country
commercial guide |
| CCID |
China
Center of Information Industry Development |
| C-DoT |
Center
for Development of Telematics |
| DEL |
direct
exchange line |
| DWDM |
dense
wavelength division multiplexing |
| DOC |
Department
of Commerce |
| DTV |
digital
television |
| DVD |
digital
videodisc |
| DVS |
descriptive
video service |
| E&IT |
electronic
and information technology |
| EU |
European
Union |
| FCC |
Federal
Communications Commission |
| FDI |
foreign
direct investment |
| GDP |
gross
domestic product |
| GPS |
global
positioning system |
| GSM |
Global
System for Mobile Communications |
| GTRI |
Georgia
Tech Research Institute |
| HAC |
Hearing
Aid Compatibility Act |
| HDTV |
high
definition television |
| HREOC |
Human
Rights and Equal Opportunity Commission |
| HTML |
hypertext
markup language |
| Hz |
Hertz |
| IC |
integrated
circuitry |
| IDEA |
Individuals
with Disabilities Education Act |
| IEP |
individualized
education program |
| IMMA |
Instructional
Material Accessibility Act |
| ISDN |
integrated
services digital network |
| ISP |
Internet
service provider |
| IT |
information
technology |
| iTV |
interactive
television |
| IT&T |
information
technology and telecommunications |
| ITTATC |
Information
Technology Technical Assistance and Training Center |
| IVR |
interactive
voice response |
| MAIT |
Manufacturers
Association of Information Technology |
| MFN |
most-favored
nation |
| MII |
Ministry
of Information Industry |
| MNC |
multinational
company |
| MTNL |
Mahanagar
Telephone Niagam Limited |
| NAFTA |
North
American Free Trade Agreement |
| NALS |
National
Adult Literacy Survey |
| NCAM |
National
Center for Accessible Media |
| NCD |
National
Council on Disability |
| NCI |
National
Captioning Institute |
| NDA |
nondisclosure
agreement |
| NOIE |
National
Office for the Information Economy |
| OEM |
original
equipment manufacturer |
| PC |
personal
computer |
| PDA |
personal
digital assistant |
| PIN |
personal
identification number |
| PROSEC |
program
of sectoral promotion |
| PSAP |
public
service answering point |
| ROI |
return
on investment |
| SDH |
synchronous
digital hierarchy |
| SME |
small-
and medium-sized enterprise |
| SMS |
short
messaging service |
| SOHO |
small
office home office |
| SRT |
speech
recognition technology |
| TIDE |
Telematics
Applications for the Integration of Disabled People and the
Elderly |
| TTY |
teletype |
| UD |
universal
design |
| VDRA |
Video
Description Restoration Act |
| VoIP |
voice
over Internet protocol |
| VPAT |
voluntary
product accessibility template |
| VPN |
virtual
private network |
| VPT |
village
public telephone |
| VRT |
voice
recognition technology |
| VXML |
VoiceXML |
| W3C |
World
Wide Web Consortium |
| WTO |
World
Trade Organization |
| xDSL |
all
types of digital subscriber lines |
| XML |
extensible
markup language |
Bibliography
1193. (1998). Telecommunications Act Accessibility
Guidelines. Part 1193. Retrieved September 2003 from http://www.access-board.gov/telecomm/html/telfinl2.htm.
1194-77. (1998) Telecommunications Act Accessibility
Guidelines. Preamble to 36 CFR Part 1194 (particularly para. 77).
Retrieved September 2003 from
http://www.access-board.gov/telecomm/html/telfinal.htm#Background.
12101. (1990). Title 42. The Public Health and Welfare.
42 U.S.C. Sec. 12101. Retrieved September 2003 from http://www4.law.cornell.edu/uscode/42/12101.html.
12111. (1990). Title 42. The Public Health and Welfare.
42 U.S.C. Sec. 12111 (9 and 10). Retrieved September 2003 from http://www4.law.cornell.edu/uscode/42/12111.html.
12113. (1990). Title 42. The Public Health and Welfare.
42 U.S.C. Sec. 12113. Retrieved September 2003 from http://www4.law.cornell.edu/uscode/42/12111.html.
35.104. (1990). Title 28. Nondiscrimination on the
Basis of Disability in State and Local Government Services. 28 CFR
Sec. 35.104. Retrieved September 2003 from http://www.Dol.Gov/Oasam/Regs/Cfr/28cfr/Part35/35104.htm.
35.160 (1990). Title 28. Nondiscrimination on the
Basis of Disability in State and Local Government Services. 28 CFR
Sec. 35.160. Retrieved September 2003 from http://www.Dol.Gov/Oasam/Regs/Cfr/28cfr/Part35/35160.htm.
36 CFR. (1998). Part 1193. Telecommunications Act
Accessibility Guidelines. Retrieved September 2003 from http://www.access-board.gov/telecomm/html/telfinal.htm.
36.303. (1990). Part 36. Nondiscrimination on the
Basis of Disability by Public Accommodations and in Commercial Facilities.
Subpart A. Sec.36.303, Auxiliary Aids and Services. Retrieved September
2003 from http://www.usdoj.gov/crt/ada/reg3a.html#anchor-97857.
P.L. 104-104, Sec. 255, codified at 47 U.S.C. Sec.
255. Also the guidelines developed by the Access Board and adopted
by the Federal Communications Commission to implement the statute,
36 CFR Part 1193.
Access Board. (n.d.). 4.34, “Automated Teller
Machines.” Retrieved October 5, 2003, from http://www.access-board.gov/adaa/html/adaag.htm#4.34.
ADA Accessibility Guidelines. (2002). For Buildings
and Facilities, as amended through September 2002. Retrieved September
2003 from
http://www.access-board.gov/adaa/html/adaag.htm#4.34.
Adaptive Environments (n.d.). Retrieved August 22,
2003, from http://www.adaptiveenvironments.org/universal/index.php.
Administration on Aging. (2002). A Profile of Older
Americans: 2002. Retrieved August 28, 2003, from http://www.aoa.gov/prof/Statistics/profile/profiles2002.asp.
Adult Literacy Survey. (2003). Retrieved September
2003 from
http://www.nald.ca/nls/ials/introduc.htm and
http://www.nifl.gov/nifl/facts/reference.html#sum2002.
Age Structure. (2003). The World Factbook 2003. Demographic
Data. Central Intelligence Agency. Retrieved September 2003 from
http://www.cia.gov/cia/publications/factbook/fields/2010.html.
Americans with Disabilities Act of 1990. (1990).
P.L. 101-336, codified at 42 USC Sec. 12101 et seq.
Area. (2003). The World Factbook 2003. Demographic
Data. Central Intelligence Agency. Retrieved September 2003 from
http://www.cia.gov/cia/publications/factbook/fields/2147.html.
Asset-Based Marketing Definition. (2003). Network
for Information Exchange. Also known as undifferentiated marketing,
unsegmented marketing. Retrieved August 28, 2003, from http://www.legamedia.net/lx/result/match/4fbf93ec5664737908069eea37caf83b/
index.php.
Assistive Technology Act of 1998. (1998). Retrieved
September 2003 from http://www.mdtap.org/tt/1998.09/1b-art.html.
(AAATE) Association for the Advancement of Assistive
Technology in Europe. (2003). A 2003 View on Technology and Disability.
AAATE position paper. Retrieved January 6, 2004, from http://139.91.151.134/aaate/aaatenew.htm#positionTechnologyDisability.
Australian Bankers’ Association. (n.d.). Automated
Teller Machines (ATMs). Retrieved September 2003 from http://www.bankers.asn.au/ABA/pdf/ATM%20Standard.htm.
Authoring Tool Accessibility Guidelines 1.0. (2000).
W3C Recommendation 3 February 2000. Retrieved September 2003 from
http://www.w3.org/TR/ATAG10.
Auto Channel. (2003). “Bluetooth Helps Drivers
Say No to DWD: Driving While Dialing.” Retrieved October 5,
2003, from
http://www.theautochannel.com/news/2003/07/10/164605.html.
Ballon, P., M. van Dusseldorp, L. Haddon, and G.
Paul. (1998). Design for All and ICT Business Practice: Addressing
the Barriers, Examples of Best Practice. Delft, Netherlands. Institute
for Strategy, Technology, and Policy of the Netherlands, Organization
for Applied Scientific Research
Benyon, D., Al Crerar, and S. Wilkinson. (2001).
“Individual Differences and Inclusive Design.” In User
Interfaces for All: Concepts, Methods, and Tools, ed. C. Stephanidis.
Mahwah, NJ: Lawrence Erlbaum Associates.
Bhatnagar, Subhash. (n.d.). The Future of E-Government
in Developing Countries. Retrieved October 5, 2003, from
http://www1.worldbank.org/publicsector/egov/bhatnagar_juneconference.pdf.
Bow-Lingual CONNECT. (2003) A service that can convert
dog barks into text and expressions. Customers can enjoy Bow-Lingual
CONNECT by using it in conjunction with Vodafone K.K.’s V601SH,
a mobile handset by Sharp.
California Community College. (1999). Distance Education
Access Guidelines for Students with Disabilities. Retrieved October
5, 2003, from http://www.htctu.fhda.edu/publications/guidelines/distance_ed/disted.htm.
Cambridge Telecom Report. (2000). “Lucent Technologies
Introduces New Portfolio of Enhanced Services for Wireless Carriers.”
Retrieved October 5, 2003, from http://www.findarticles.com/cf_0/m0BFP/2000_March_6/59976170/p1/article.jhtml?term=lucent+technologies+introduces+new+portfolio.
CardioNet. (n.d.). How It Works. Retrieved October
5, 2003, from http://cardionet.com/how.html.
Center for Universal Design (n.d.). Retrieved August
7, 2003, from http://www.design.ncsu.edu/cud.
China. (2003). United States and Foreign Commercial
Service Market Research Report. “Leading Sectors for U.S.
Exports and Investments (China) FY2004.” [7/15/2003]. Matthew
Gettman. Retrieved August 2004 from http://www.stat-usa.gov/mrd.nsf/vwCCG_Country/9D3C7D7A6F111FCB85256EEE002E2C12?OpenDocument&sessID=E0CB08BD1264A4E.
Cipherwar.com. (2000). Bank Accounts for Everyone.
Retrieved October 5, 2003, from http://www.cipherwar.com/news/00/first_accounts.htm.
Collin, N. (n.d.). Automated Speech Recognition.
Retrieved October 5, 2003, from www.ncollin.demon.co.uk/speechrecognition.html.
Cover Pages by Oasis. (2001). VoiceXML Forum. Retrieved
October 5, 2003, from http://www.oasis-open.org/cover/vxml.html.
Czinkota, Michael R. (2001). Foundation for International
Business Education and Research and The McDonough School of Business,
Georgetown University. The STAT-USA /Internet Companion to International
Business Exercise 2, page 55. Retrieved April 5, 2003, from http://www.stat-usa.gov/companion.
Developmental Marketing. (2003). Network for Information
Exchange. Retrieved August 28, 2003, from
http://www.legamedia.net/lx/result/match/faedb8a717a0aa6e050e96312b89ff1e/
index.php.
Directions Magazine. (2003a). “Gartner Says
Palm OS Licensees Accounted for 51 Percent of PDA Shipments and
41 Percent of Worldwide Revenue in Second Quarter of 2003.”
Retrieved August 1, 2003, from
http://www.directionsmag.com/press.releases/index.php?duty=Show&id=7682).
———. (2003b). “Intergraph
Public Safety Launches New Wireless PDA-Based Application Providing
Superior In-the-Field Dispatch Response and Flexibility.”
Retrieved October 5, 2003, from
http://www.directionsmag.com/press.releases/index.php?duty=Show&id=7639.
———. (2003c). “Cobb
EMC to Deploy Intergraph Solution for Outage and Mobile Workforce.”
Retrieved October 5, 2003, from
http://www.directionsmag.com/press.releases/index.php?duty=Show&id=7709.
Disabilities, Opportunities, Internetworking, and
Technology (n.d.). Retrieved August 22, 2003, from http://www.washington.edu/doit/Brochures/Technology/universal.design.html.
DisabilityInfo.gov. (2003). Retrieved August 28,
2003, from http://www.disabilityinfo.gov.
EITAAC Report. (May 12, 1999). Retrieved January
8, 2001, from
http://www.access-board.gov/sec508/commrept/eitaacrpt.htm.
Electronic and Information Technology Accessibility
Standards. (2000). Retrieved January 24, 2003, from http://www.access-board.gov/sec508/508standards.htm.
Emiliani, P. L. (2001). “Special Needs and
Enabling Technologies: An Evolving Approach to Accessibility.”
In User Interfaces for All: Concepts, Methods, and Tools, ed. C.
Stephanidis. Mahwah, NJ: Lawrence Erlbaum Associates.
ESL Online Education and Training. (2000). Leadership
in the Global Economy Through English. Retrieved September 2003
from http://www.molinedu.com/countryprof/english/uk/uk_eng.htm.
Fact Sheet. (2003). Telephone Access for People with
Speech Disabilities. Retrieved from http://www.disabilityworld.org/01_03_03/access/phone.shtml.
Fain, W. B., A. Cianciolo, H. Hancock, and T. M.
Whaley. (2001). Structured Interviews to Support the ITTATC Needs
Assessment. Atlanta, GA: Georgia Institute of Technology.
Fastap. (n.d.). Retrieved October 5, 2003, from http://www.digitwireless.com/demos/interactive_flash.html.
(FCC) Federal Communications Commission. (1999.)
Notice of Inquiry. Docket No. WT 96-198); also generally, FCC Report
on High Speed and Advanced Telecommunications (August 3, 2000).
———. (n.d.a). FCC Closed
Captioning Fact Sheet. Retrieved August 27, 2003, from http://www.fcc.gov/cgb/consumerfacts/closedcaption.html.
———. (n.d. b). Accessibility
of Emergency Video Programming to Persons with Hearing and Visual
Disabilities. Retrieved October 5, 2003, from
http://www.fcc.gov/cgb/consumerfacts/emergencyvideo.html.
Feeney, R. (2003). Access to ATMs: UK Design Guidelines.
Retrieved October 5, 2003, from
http://www.equalopportunity.on.ca/eng_g/subject/index.asp?action=search_7&file_id=17644.
Fletcher, V. (2002). Universal Design, Human-Centered
Design for the 21st Century. Retrieved August 22, 2003, from http://www.adaptiveenvironments.org/examples/
humancentered.php?f=4.
Francik, E. (1996). Telephone Interfaces: Universal
Design Filters. Retrieved August 22, 2003, from http://www.trace.wisc.edu/docs/taacmtg_aug96/pbfilter.htm.
General Dynamics C4 Systems. (n.d.). Rugged Workstations,
Servers and Displays. Retrieved October 5, 2003, from
http://www.army-technology.com/contractors/computers/general_d/general_d1
Global Edge. (2003). Potential Indicators for Emerging
Markets 2003. Michigan State University. Retrieved October 5, 2003,
from http://globaledge.msu.edu/ibrd/marketpot.asp.
GlobalEDGE. (2003). Market Potential Indicators for
Emerging Markets. Overall Market Potential. Michigan State University,
Center for International Business Education and Research. Retrieved
September 1, 2003, from
http://globaledge.msu.edu/ibrd/marketpot.asp?SortField=OverallMarketPotentialIndexR#MarketPotential.
Global Marketing Definition. (2003). Network for
Information Exchange. Also known as international marketing. Retrieved
August 28, 2003, from
http://www.legamedia.net/lx/result/match/0c4701a7d182077ab602256788097058/
index.php.
Global Reach. (2003). Global Internet Statistics
(by Language). Retrieved August 28, 2003, from http://www.global-reach.biz/globstats/index.php3.
Grant Thornton. (2003). “ATM Outsourcing Trend
on the Rise.” Retrieved October 5, 2003, from http://www.grantthornton.com.
Haub, C. (2003). World Population Data Sheet, July,
2003. Population Reference Bureau. Retrieved September 2003 from
http://www.guttmacher.org/pubs/journals/2915603.pdf.
The Hindu Survey of Indian Industry. Retrieved September
10, 2004, from http://www.hinduonnet.com/books/sii/2004/sii04.htm.
India. (2004). United States and Foreign Commercial
Service Market Research Report. “Leading Sectors for U.S.
Exports and Investments (India) FY2004.” [11/03/2003]. Hayden
Wetzel. Retrieved August 2004 from http://www.statusa.gov/mrd.nsf/vwCCG_Country/
66AFB608D7BDD44B85256EEE002E2751?OpenDocument&sessID=
504A087512541C1.
International Code Council. (n.d.). ICC/ANSI A117:
2003 Edition—Document Development. Retrieved October 5, 2003,
from http://www.iccsafe.org/a117/editiondev.html.
(IDC) International Data Corporation (2000). Web-Site
Globalization. The Next Imperative for the Internet 2.0 Era. Retrieved
August 28, 2003, from
http://www.etranslate.com/en/downloads/IDC_Globalization_report.pdf.
International Monetary Fund. (2003). Foreign Direct
Investment in Emerging Market Countries—Report of the Working
Group of the Capital Markets Consultative Group (CMCG). “Foreign
Direct Investment in Emerging Market Countries 1990-2002 (in millions
U.S. dollars).” Retrieved September 2003 from
http://www.imf.org/external/np/cmcg/2003/eng/091803.pdf.
International Trade Administration. (1999). U.S.
International Travel And Tourism Balance Of Trade (Receipts/Exports
And Payments/Imports) 1990-1999pr. Office of Travel and Tourism
Industries. Retrieved August 28, 2003, from
http://tinet.ita.doc.gov/view/f-1999-03-001/index.html?ti_cart_cookie=20031223.143327.04298.
———. (2001). International
Arrivals to U.S. by Country of Residency-Historical Visitation.
Inbound 1994-2000. Office of Travel and Tourism Industries. Retrieved
August 28, 2003, from
http://tinet.ita.doc.gov/view/f-2000-04-001/index.html?ti_cart_cookie=20031223.143327.04298.
———. (2004). International
Arrivals to the United States for March and First Quarter 2004.
Office of Travel and Tourism Industries. Retrieved August 2003 from
http://tinet.ita.doc.gov/view/m-2004-I-001/analysis_q1.html.
Internet Users. (2003). The World Factbook 2003.
Demographic Data. Central Intelligence Agency. Retrieved August
28, 2003, from
http://www.cia.gov/cia/publications/factbook/fields/2010.html.
iVoice, Inc. (2003). “iVoice Introduces Revolutionary
Voice Dialing Capabilities.” Retrieved October 5, 2003, from
http://www.ivoice.com/media/Apr012003221907.htm.
Jacobs, Steven I. (2002). The Business Benefits of
Accessible E&IT Design. Table 25. IDEAL Group, Inc. Not accessible
via the Internet.
———. (2003). The Business
Benefits of Accessible E&IT Design. Retrieved March 18, 2003,
from http://www.ideal-group.org.
Kaplan, D. (n.d.). The Definition of Disability.
Retrieved September 18, 2003, from http://www.accessiblesociety.org/topics/demographics-identity/dkaplanpaper.htm.
Kearney, A. T. (2002). FDI Confidence Index. Vol.
5. Retrieved August 15, 2003, from http://www.atkearney.com/shared_res/pdf/FDI_Confidence_Sept2002_S.pdf.
Kiel v. Select Artificials Inc. 169 F. 3d 1131 (8th
Cir.). (1999) cert. denied, 120 S. Ct. 59 (1999). (Employer who
restructured job to eliminate use of telephone did not violate reasonable
accommodation obligation by refusing to furnish teletypewriter.)
Kumagai, J. (n.d.). “Talk to the Machine.”
Retrieved October 5, 2003, from
http://www.spectrum.ieee.org/WEBONLY/publicfeature/sep02/voic.html.
LegaMedia. (2003). “<LEXicon> E-zine
& Portal für Juristen & Unternehmer.” Retrieved
August 28, 2003, from http://www.legamedia.net/lx/result/match/
1bcd9811926293346330da3b914990cb/index.php.
LaGeese, D. (2003). “They Know Where You Are.”
U.S. News & World Report. Retrieved October 5, 2003, from http://www.usnews.com/usnews/issue/archive/030908/
20030908041452_brief.php.
Leichtman Research Group, Inc. (2003). “Other
Key Findings.” Retrieved August 28, 2003, from http://www.leichtmanresearch.com/press/111203release.html.
Light Reading. (2002). News Wire Feed, “Internet
Backbone Growth Slowing. TeleGeography Study, 16 October 2002.”
Retrieved September 2003 from
http://www.lightreading.com/document.asp?doc_id=22747&site=lightreading.
Literacy Demographic Data. (2003). The World Factbook
2003. Central Intelligence Agency. Retrieved September 2003 from
http://www.cia.gov/cia/publications/factbook/
fields/2103.html.
Live Text. (2000). Learning Styles. Retrieved August
28, 2003, from
http://p12.livetext.com/doc/31762/139548.
Market Segmentation Definition. (2003). Network for
Information Exchange. Also known as differentiated marketing, Retrieved
August 28, 2003, from http://www.legamedia.net/lx/result/match/6d9104823ce91ef09659071c70cb54f4/
index.php.
Mass Marketing Definition. (2003). Network for Information
Exchange. Also known as undifferentiated marketing, unsegmented
marketing. Retrieved August 28, 2003, from
http://www.legamedia.net/lx/result/match/1bcd9811926293346330da3b914990cb/
index.php.
McFarland, D. (2002). “Cell Phone Ownership
Grows 29% from 1999-2001 According to New Scarborough Study.”
Retrieved October 5, 2003, from http://www.scarborough.com/scarb2002/press/pr_cellphone.htm.
McGill, J. (2002). “Banking the Unbanked.”
Retrieved October 5, 2003, from http://www.self-service-touchpoints.com/content.asp?contentid=137.
Mexico. (2004). United States and Foreign Commercial
Service Market Research Report. “Leading Sectors for U.S.
Exports and Investments (Mexico) FY2004.” [09/12/2003]. Aileen
Nandi. Retrieved August 2004 from http://www.stat-usa.gov/mrd.nsf/
vwCCG_Country/9464AED4221E2E5C85256EEE002E365E?OpenDocument&sessID=
600108EC12842ED
Microsoft. (n.d.). Accessibility Homepage. Retrieved
December 15, 2000, from http://www.microsoft.com/enable. Note: These
guidelines have since been removed from this Web site.
Moe, M. T. (2002). “Emerging Trends in Post
Secondary Education—The View to 2012.” Retrieved October
5, 2003, from http://www.usdla.org/ppt/THINKEQUITY.ppt.
(NCAM) National Center for Accessible Media. (2003).
A Developer’s Guide to Creating Talking Menus for Set-top
Boxes and DVDs. Retrieved October 2003 from http://ncam.wgbh.org/news/pr_20030821.html.
(NCD) National Council on Disability. (1998). “International
Update.” NCD Bulletin. Retrieved from
http://www.google.com/search?hl=en&lr=&ie=UTF-8&oe=UTF-8&q=%22million+people+with+disabilities+worldwide%22&btnG=Google+Search.
———. (2002). Universal Design
Request for Proposals. Washington, DC: National Council on Disability.
———. (2004). “Improving
Federal Disability Data.” Retrieved July 8, 2004, from http://www.ncd.gov/newsroom/publications/2004/improvedata.htm.
National Institute for Literacy. (2003). “ESL
Literacy Fact Sheet.” Retrieved September 2003 from http://www.nifl.gov/nifl/facts/facts_overview.html.
———. (n.d.). “FAQ.”
Retrieved August 15, 2003, from
http://www.nifl.gov/nifl/faqs.html#literacy%20rates.
Niche Marketing Definition. (2003). Network for Information
Exchange (2003). Also known as concentrated marketing. Retrieved
August 28, 2003, from
http://www.legamedia.net/lx/result/match/b416dc4ed36ab23ac5d3129f3a8bbdde/index.
php.
Nielsen/NetRatings. (2004). “Web Connection
Speed Trends—Home Users (US).” Retrieved August 2003
from http://www.websiteoptimization.com/bw/0406.
North Carolina State University. (1997). Principles
of Universal Design. The Center for Universal Design. Retrieved
August 15, 2003, from
http://www.design.ncsu.edu:8120/cud/univ_design/principles/seven.htm.
Ostroff, E. (1999). Retrieved August 7, 2003, from
http://www.archvoices.org/index.cfm?pg=Resources&s=UniversalDesign.
———. (2001). “Universal
Design: The New Paradigm.” In (Eds.), Universal Design Handbook,
ed. W. F. E. Preiser and E. Ostroff., pp. 1.3–1.12. New York:
McGraw Hill.
PCS-Direct. (n.d.). Retrieved October 5, 2003, from
http://www.pcs-direct.com/phones.htm.
Peppers, Don, and Martha Rogers. (1997). The One
to One Future. Available from Amazon.com:
http://www.amazon.com/exec/obidos/search-handle-url/index=books&field-author=Martha%20Rogers/103-2833482-7027839.
Perera, Sylvie. (n.d.). “Interactive Digital
Television Services for People with Low Vision.” Retrieved
June 2004 from http://www.tiresias.org/itv/intro.htm.
Population. (2003). The World Factbook 2003. Demographic
Data. Central Intelligence Agency. Retrieved September 2003 from
http://www.cia.gov/cia/publications/factbook/fields/2119.html.
Preiser, Wolfgang F.E., and Elaine Ostroff. (2001).
The Universal Design Handbook. Section 1.3, “Terminology:
Universal Design,” p. 1.5. Weimar, TX: C.H.I.P.S.
Product Line Stretching Definition. (2003). Network
for Information Exchange. Retrieved August 28, 2003, from
http://www.legamedia.net/lx/result/match/d9ab49e1e15a71da44ae66fe708497c7/index.
php.
Pyramid Research (2004). http://www.pyramidresearch.com/home.asp.
Royal National Institute of the Blind (RNIB). (n.d.)
Accessibility Guide. Retrieved June 4, 2003, from http://www.mandoforms.com/download/index.html.
———. (n.d.) Accessible Web
Design. Retrieved June 4, 2003, from http://www.rnib.org.uk/digital/hints.htm.
Russia. (2004). United States and Foreign Commercial
Service Market Research Report. “Leading Sectors for U.S.
Exports and Investments (Russia) FY2004.” [01/05/2004]. Geoffrey
Cleasby. Retrieved August 2004 from http://www.stat-usa.gov/mrd.nsf/vwCCG_Country/3CA107BDCD8D829185256EEE002E2959?OpenDocument&sessID=D084083C1204545.
Samsung. (n.d.). “Cell Phones.” Retrieved
October 5, 2003, from
http://www.001abc.com/cellphones/samsung_sch_t300.html.
Section508.gov. (2003). “Agency Section 508
Coordinator List.” Retrieved August 28, 2003, from http://www.section508.gov/index.cfm?FuseAction=Content&ID=84.
SIL International. (2003). Ethnologue: Languages
of the World. 14th ed. Retrieved November 2003 from http://www.ethnologue.com.
Sandhu, J. S. (2001). “An Integrated Approach
to Universal Design: Toward the Inclusion of All Ages, Cultures,
and Diversity.” In Universal Design Handbook, ed. W. F. E.
Preiser and E. Ostroff, pp. 3.3–3.14. New York: McGraw Hill.
Steinfeld, E. (1994). The Concept of Universal Design.
Buffalo, NY. Retrieved January 3, 2001, from http://www.arch.buffalo.edu/~idea/publications/free_pubs/pubs_cud.html.
Stephanidis, C. (2001). “User Interfaces for
All: New Perspectives into Human-Computer Interaction.” In
User Interfaces for All: Concepts, Methods, and Tools, ed. C. Stephanidis.
Mahwah, NJ: Lawrence Erlbaum Associates.
Stockwatch. (2003). “China Ventures to Help
Teach Chinese Children English.” News Release 30 January 2003.
Retrieved September 2003 from
http://new.stockwatch.com/newsit/newsit_newsit.pasp?bid=B-204275-C:CHV&news_region=C&symbol=CHV.
Story, M. F. (2001). “Principles of Universal
Design.” In Universal Design Handbook, ed. W. F. E. Preiser
and E. Ostroff, pp. 10.3–10.19. New York: McGraw Hill.
Story, M. F., J. L. Mueller, and R. L. Mace. (1998).
“The Universal Design File: Designing for People of All Ages
and Abilities.” Retrieved August 7, 2003, from http://www.design.ncsu.edu:8120/cud/pubs/center/books/ud_file/toc3b14.htm.
Tabs, E. D. (2003). Distance Education at Degree-Granting
Postsecondary Institutions: 2001–2002. U.S. Department of
Education. Washington, DC: National Center for Education Statistics.
Retrieved September 5, 2003, from http://nces.ed.gov/pubs2003/2003017.pdf.
TechDis. (n.d.). “Usability and Accessbility
of PDAs in Education.” Retrieved August 27, 2003, from http://www.techdis.ac.uk/PDA/front.htm.
Telecommunications Act Accessibility Guidelines.
(1998). 36 CFR Part 1193. RIN 3014-AA19. Retrieved September 2003
from
http://www.access-board.gov/telecomm/html/telfinal.htm.
———. (n.d.). Retrieved January
24, 2003, from http://www.access-board.gov/telecomm/html/telfinl2.htm.
Telecommunications Industry Association, Access (TIA
Access). (1996). Resource Guide for Accessible Design of Consumer
Electronics. Designer’s Guide to Accessible Design. Retrieved
September 2003 from http://www.tiaonline.org/access/guide.html.
Telecomworldwire. (2002). “Datamonitor Issues
Predictions for Voice Recognition Market.” Retrieved October
5, 2003, from
http://web2.infotrac.galegroup.com/itw/infomark/899/930/41123108w2/purl=rc1_PRS_0_A88830418&dyn=4!xrn_1_0_A88830418?sw_aep=cmlweb.
Telephones, Mobil Cellular: (2003). The World Factbook
2003. Telecommunications data. Central Intelligence Agency. Retrieved
September 2003 from
http://www.cia.gov/cia/publications/factbook/fields/2151.html.
Terrell v. USAIR, 132 F. 3d 621 11th Cir. (1998).
(Denial of access to modified keyboard not a violation where employee
not required to type in its absence.)
ThinkEquity Partners. (2003). National Science Foundation.
Retrieved September 2003 from http://www.usdla.org/ppt/THINKEQUITY.ppt.
Thunderbird. (n.d.). “Distance Learning Benefits.”
Retrieved October 5, 2003, from
http://www.t-bird.edu/exec_ed/ethunderbird/benefits.htm.
Tobias, J., and G. Vanderheiden. (1998). “Why
Companies Might Adopt Universal Design: An Initial Report from the
Universal Design Research Project.” Proceeding of RESNA 1998
annual conference, pp. 349–351.
Trace Research and Development Center. (1999). Excerpt
from “User Interface for All.” Constantin Stephanidis.
Mahwah, NJ: Lawrence Erlbaum Associates, Inc. Retrieved August 28,
2003, from http://www.trace.wisc.edu/docs/phones/tcrd1/summary/index.htm.
Turkey. (2004). United States and Foreign Commercial
Service Market Research Report. “Leading Sectors for U.S.
Exports and Investments (Turkey) FY2004.” [07/10/2003]. Erik
Hunt. Retrieved August 2004 from http://www.stat-usa.gov/mrd.nsf/vwCCG_Country/7387566F3CEA48F885256EEE002E2B58?OpenDocument&sessID=E00808B01264BF5.
U.S. and Foreign Commercial Service and U.S. Department
of State. China Country Commercial Guide FY 2003: Leading Sectors.
Market Research Reports. Retrieved September 2003 from http://www.stat-usa.gov/MRD.NSF/vwCCG_Country/
4BB189FCD050B06285256DE20034574B?OpenDocument&sessID=509B12272323E94.
U.S. Census Bureau. (1997). Census Brief (CENBR/97-5),
p. 2. Retrieved September 2003 from
http://www.census.gov/prod/3/97pubs/cenbr975.pdf.
———. (2000). “Characteristics
of the Civilian Noninstitutionalized Population by Age, Disability
Status, and Type of Disability: 2000.” Census 2000 Brief.
Retrieved August 28, 2003, from http://www.census.gov/hhes/www/disable/disabstat2k/table1.html.
U.S. Department of Commerce. (2003). “Technology
Assessment of the U.S. Assistive Technology Industry.” Retrieved
January 7, 2003, from http://67.98.119.215/atreportweb.
(USDLA) U.S. Distance Learning Association. (n.d.).
“Resources: Research Information and Statistics.” Retrieved
October 5, 2003, from http://www.usdla.org.
U.S. House of Representatives. (2002). No Child Left
Behind Act of 2001, H.R. 1. Retrieved August 28, 2003, from
http://edworkforce.house.gov/issues/107th/education/nclb/nclb.htm.
University of Washington DO-IT (Disabilities, Opportunities,
Internetworking, and Technology). (n.d.). World Wide Access: Accessible
Web Design. Retrieved June 4, 2003, from http://www.washington.edu/doit/Brochures/Technology/universal.design.html.
User Agent Accessibility Guidelines 1.0. (2002).
W3C Recommendation, 17 December 2002. Retrieved September 2003 from
http://www.w3.org/TR/UAAG10.
Vanderheiden, G. (n.d.). Fundamental Principles and
Priority Setting for Universal Usability. Retrieved August 7, 2003,
from http://trace.wisc.edu/docs/fundamental_princ_and_priority_acmcuu2000/index.htm.
———. (1990). “Thirty-Something
(Million): Should They Be Exceptions.” Human Factors, 32(4),
383–396. Available at http://trace.wisc.edu/docs/30_some/30_some.htm.
———. (1997). Design for People
with Functional Limitations Resulting from Disability, Aging, and
Circumstance. In (Ed.), Handbook of Human Factors and Ergonomics,
ed. G. Salvendy. 2nd ed., pp. 2010–2052. New York: John Wiley
& Sons, Inc.
———. (2001). “Fundamentals
and Priorities for Design of Information and Telecommunication Technologies.”
In Universal Design Handbook, ed. W. F. E. Preiser and E. Ostroff,
pp. 65.3–65.15. New York: McGraw Hill.
Vodafone K.K. (2003). “Vodafone K.K. Introduces
Japan’s First Handset with Built-In TV Tuner.” Retrieved
September 2003 from
http://www.vodafone.jp/english/release/2003/031014e.pdf.
Vodafone K.K. (2003.) “Vodafone K.K. Launches
Sha-mail Card Service. Picture Messages Can Now Be Sent to Mailboxes.”
Retrieved September 2003 from
http://www.vodafone.jp/english/release/2003/031029e.pdf.
W3C Web Accessibility Initiative. (n.d.). Checklist
of Checkpoints for Web Content Accessibility Guidelines 1.0. Retrieved
June 4, 2003, from
http://www.w3.org/TR/WCAG10/full-checklist.html.
———. (n.d.). Policies Relating
to Web Accessibility. Retrieved October 5, 2003, from http://www.w3.org/WAI/Policy/#Introduction.
Web Content Accessibility Guidelines 1.0. (1999).
W3C Recommendation, 5 May 1999. Retrieved September 2003 from http://www.w3.org/TR/WCAG10.
White House. (2001). President’s New Freedom
Initiative. Retrieved August 28, 2003, from http://www.whitehouse.gov/infocus/newfreedom.
Winograd, T., ed. (1997). “Interspace and an
Every-Citizen Interface to the National Information Infrastructure.”
In More Than Screen Deep: Toward Every-Citizen Interfaces to the
Nation’s Information Infrastructure. Washington, DC: National
Academy Press. Available at http://www.nap.edu/readingroom/books/screen.
Wireless Phone Used to Withdraw Cash from ATM in
Europe. (2002). Retrieved September 2003 from http://www.3g.co.uk/PR/April2002/3271.htm.
Workforce Investment Act of 1998. (1998). P.L. 105-220,
Sec. 408(b), “Electronic and Information Technology,”
codified at 29 USC Sec. 794d.
http://www.usdoj.gov/crt/508/508law.html.
World Bank, World. (2002). Development Indicator
Database. Retrieved September 2003 from https://publications.worldbank.org/subscriptions/WDI.
World Information Technology and Services Alliance.
(2003). Public Policy Report 2003: List of Key E&IT Industry
Issues That Will Need To Be Addressed If the Promises of a Global
IT Infrastructure and Digital Economy Are To Be Fulfilled.
XML Accessibility Guidelines. (2002). W3C Working
Draft, 3 October 2002. Retrieved September 2003 from http://www.w3.org/TR/xag.html.
Yahoo.com. (n.d.). “Pocket Films Store.”
Retrieved October 5, 2003, from
http://store.yahoo.com/pocketpcfilms/xsxtremwinsp.html.
ZDNet Australia. (2002). “New Software Brings
Lip-Reading to Mobiles.” Retrieved September 2003 from
http://www.phonechoice.com.au/index.cfm?section=newsarchive&page=35. |