
|
||||||
|
|
||||||
|
|
December 2006
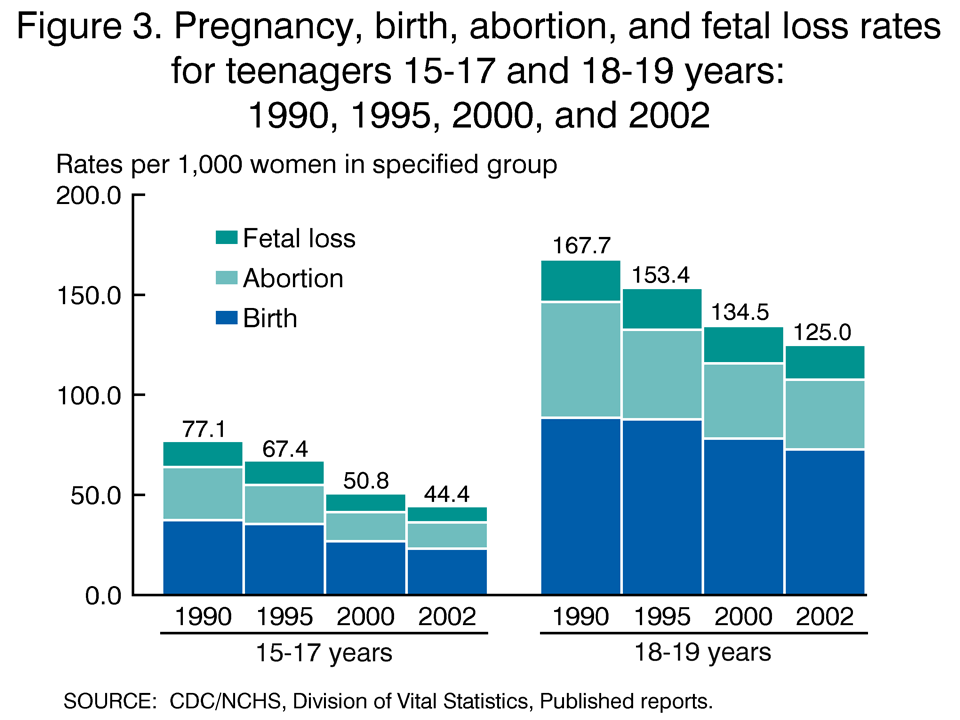
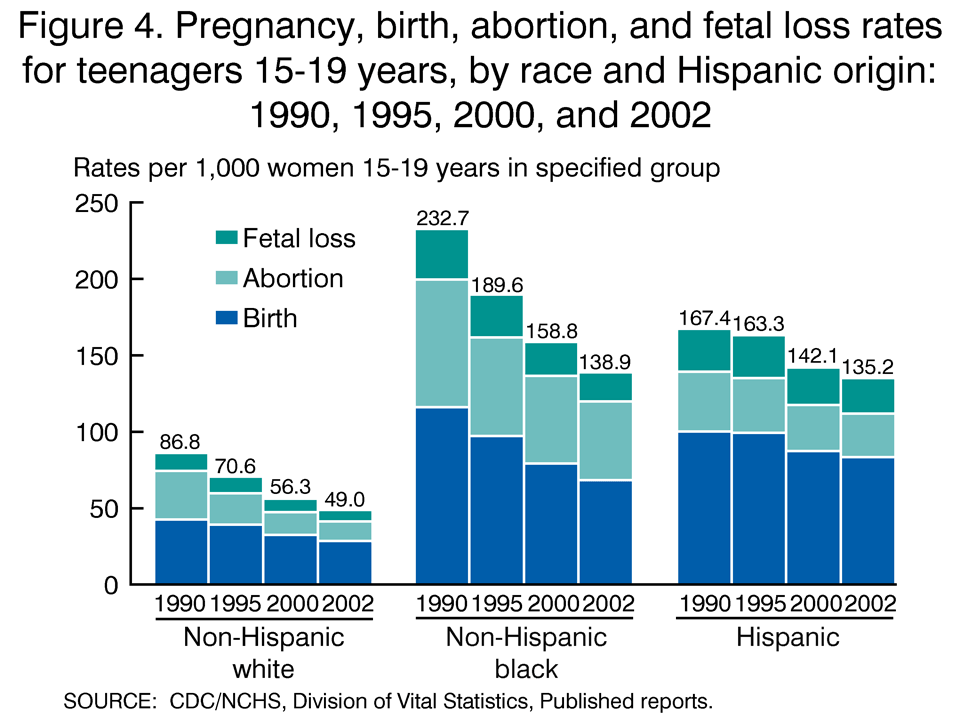
Recent Trends in Teenage Pregnancy in the United States, 1990-2002 by Stephanie J. Ventura, M.A.; Joyce C. Abma, Ph.D.; William D. Mosher, Ph.D., Division of Vital Statistics; and Stanley K. Henshaw, Ph.D., The Guttmacher Institute Abstract Objectives—This report presents detailed pregnancy rates for teenagers 15-19 years, for 1990-2002, updating a national series of rates begun in 1976. Methods—Tabular and graphical data on pregnancies and pregnancy rates for teenagers 15-19 years by age, race, and Hispanic origin are presented and briefly described. Information on teenage pregnancies by pregnancy outcome is presented, including complete counts of live births and estimates of induced abortions and fetal losses. Results—In 2002, an estimated 757,000 pregnancies among teenagers 15-19 years resulted in 425,000 live births, 215,000 induced abortions, and 117,000 fetal losses. The overall teenage pregnancy rate was estimated at 76.4 pregnancies per 1,000 females aged 15-19 years, down 10 percent from 2000 (84.8 per 1,000), and 35 percent lower than the peak rate in 1990 (116.8 per 1,000). The 2002 rate is an historic low for the Nation. Rates for young teenagers declined relatively more than for older teenagers throughout this 12-year period. Overview An estimated 757,000 pregnancies among teenagers 15-19 years ended in 2002, 9 percent fewer than in 2000 (834,000) and about one-fourth fewer than the peak number estimated for 1990, 1,017,000 (Table 1). The 2002 total included 425,000 live births and an estimated 215,000 induced abortions and 117,000 fetal losses. The estimate for 2002 represents a record low for the Nation, the fewest reported since this series of national pregnancy estimates began in 1976 (1,2). The most recent year for which these estimates can be prepared is 2002, because more current national estimates of abortions are not available. Teenage pregnancy rates continued to decline since 2000 (the most recent year for which data were previously available), dropping 10 percent overall between 2000 and 2002. During the period 1990-2002, the rate fell 35 percent (Table 2). The estimated rate for 1990, 116.8 pregnancies per 1,000 women aged 15-19 years, was the highest ever reported over the period 1976-2002. By 2002, the rate fell to an estimated 76.4 per 1,000. Put another way, the 1990 rate of 116.8 means that 11.7 percent of U.S. teenagers were pregnant in 1990 compared with 7.6 percent in 2002. The pace of decline continued in recent years: For the 2000-2002 period, the rate dropped about 5 percent per year, compared with an average decline of about 3 percent per year during 1990-2000. Despite the continuous declines, the U.S. teenage pregnancy rate is still among the highest among industrialized nations (3). The costs of teenage childbearing in the United States are substantial. The National Campaign to Prevent Teen Pregnancy recently estimated that $9.1 billion in public funding was expended on teenage childbearing in 2004 (4). These costs include public assistance, health care, child welfare, and other expenses. This Health e-stat summarizes the overall trends in pregnancy for teenagers 15-19 years for the years 1990-2002, updating the most recent report of pregnancy estimates that included 1990-2000 (2). Estimates of numbers and rates are presented in Tables 1 and 2, and trends are illustrated in Figures 1-4. More detailed data on the changes and variations in pregnancies and pregnancy rates for all females 10-44 years of age will be presented in a forthcoming report. Trends by Age The estimated pregnancy rate for young teenagers 15-17 years fell from 77.1 per 1,000 in 1990 to 44.4 in 2002, a 42-percent drop (Table 2 and Figures 1 and 3). During the recent period, 2000-2002, the rate fell 13 percent. During 1990-2000, the rate fell about 4 percent per year while during 2000-02, the rate dropped 6.5 percent annually. The rate for older teenagers declined more modestly, falling 25 percent from 167.7 per 1,000 in 1990 to 125.0 in 2002 (Table 2 and Figures 2 and 3). The rates declined continuously for older teenagers: about 2 percent annually during 1990-2000 and about 3.6 percent annually for 2000-2002. Pregnancy rates for both age groups in 2002 are record lows for the Nation since this series of rates began in 1976 (1, 2). Rates by Race and Hispanic Origin Pregnancy rates for black and white non-Hispanic teenagers dropped by about 40 percent each during 1990-2002, whereas the rate for Hispanic teenagers fell about 19 percent (Table 2 and Figure 4). Pregnancy rates for white and black non-Hispanic teenagers declined fairly steadily through the period 1990-2002; the decline for Hispanic teenagers began after 1994. The pace of decline in the pregnancy rates by race and Hispanic origin increased in the recent period 2000-2002 compared with 1990-2000: Rates fell 6 to 7 percent per year during 2000-2002 for black and white non-Hispanic teenagers and 2.5 percent for Hispanic teenagers, compared with annual declines of about 4 percent for black and white non-Hispanic teenagers and 1.6 percent per year for Hispanic teenagers during 1990-2000. Among age subgroups, pregnancy rates fell for all race and Hispanic origin groups between 2000 and 2002, except for Hispanic teenagers 18-19 years whose rate was unchanged. Pregnancy rates for black teenagers were substantially higher than for white or Hispanic teenagers in 1990. By 2002, the rates for black and Hispanic teenagers were very similar and were each more than two and one-half times the rate for non-Hispanic white teenagers (Figure 4). Trends in Pregnancy Rates by Outcome Rates for all components of pregnancy among teenagers have fallen since 1990 (Table 2). The birth rate dropped 28 percent from 1990 to 2002, whereas the abortion rate declined 46 percent. During the 1990s, the abortion rate fell more rapidly than the birth rate. Since 2000, these two trends have been similar with annual declines of about 5 percent for each. The birth rate has continued to fall since 2002, and has now declined 33 percent from 1990 through 2005 (5). Overall, four in seven teenage pregnancies ended in a live birth in 2002, two in seven in induced abortion, and about one in seven in a fetal loss.
Suggested citation
Acknowledgments References 1. Ventura SJ, Mosher WD, Curtin SC, Abma JC, Henshaw S. Trends in pregnancies and pregnancy rates by outcome: Estimates for the United States, 1976-96. National Center for Health Statistics. Vital Health Stat 21(56). 2000. Available from: http://www.cdc.gov/nchs/data/series/sr_21/sr21_056.pdf. 2. Ventura SJ, Abma JC, Mosher WD, Henshaw S. Estimated pregnancy rates for the United States, 1990-2000: An Update. National vital statistics reports vol 52 no 23. 2004. Available from: http://www.cdc.gov/nchs/data/nvsr/nvsr52/nvsr52_23.pdf .3. The Guttmacher Institute. Teenagers’ sexual and reproductive health. Facts in Brief. New York: The Alan Guttmacher Institute. 2002. Available from: http://www.guttmacher.org/pubs/fb_teens.pdf. 4. Hoffman S. By the numbers: The public costs of teen childbearing. Washington, DC: The National Campaign to Prevent Teen Pregnancy. 2006. Available from: http://www.teenpregnancy.org/costs/default.asp. 5. Hamilton BE, Martin JA, Ventura SJ. Births: Preliminary Data for 2005. Health e-stat. Hyattsville, MD: National Center for Health Statistics. 2006. Available from: http://www.cdc.gov/nchs/products/pubs/pubd/hestats/ prelimbirths05/prelimbirths05.htm. 6. Martin JA, Hamilton BE, Sutton PD, Ventura SJ, Menacker F, Kirmeyer S. Births: Final data for 2004. National Vital Statistics Reports vol 55 no 1. Hyattsville, MD: National Center for Health Statistics. 2006. Available from: http://www.cdc.gov/nchs/data/nvsr/nvsr55/nvsr55_01.pdf. 7. Strauss LT, Herndon J, Chang J, Parker WY, Bowens SV, Berg CJ. Abortion surveillance – United States, 2002. MMWR 54(No.SS-7):1-31. 2005. Available from: http://www.cdc.gov/mmwr/PDF/ss/ss5407.pdf. 8. Henshaw SK. The Guttmacher Institute. Unpublished tabulations, 2006. 9. Finer LB, Henshaw SK. Estimates of U.S. Abortion Incidence, 2001-2003. The Guttmacher Institute. Available from: http://www.guttmacher.org/pubs/2006/08/03/ ab_incidence.pdf. 10. Kelly JE, Mosher WD, Duffer AP, Kinsey SH. Plan and operation of the 1995 National Survey of Family Growth. National Center for Health Statistics. Vital Health Stat 1(36). Available from: http://www.cdc.gov/nchs/data/series/sr_01/ sr01_036.pdf. 11. Groves RM, Benson G, Mosher WD, et al. Plan and operation of cycle 6 of the National Survey of Family Growth. National Center for Health Statistics. Vital Health Stat 1(42). 2005. Available from: http://www.cdc.gov/nchs/data/series /sr_01/sr01_042.pdf. 12. National Center for Health Statistics. Postcensal estimates of the resident population of the United States as of July 1, 2005, by year, state and county, age, bridged race, sex, and Hispanic origin (vintage 2005). Available from: http://www.cdc.gov/nchs/about/major/dvs/popbridge/ popbridge.htm. 13. Ingram DD, Parker JD, Schenker N, et al. United States Census 2000 with bridged race categories. National Center for Health Statistics. Vital Health Stat 2(135). 2003. Available from: http://www.cdc.gov/nchs/data/series/sr_02/sr02_135.pdf. 14. Schenker N, Parker JD. From single-race reporting to multiple-race reporting: Using imputation methods to bridge the transition. Stat Med 22:1571-87. 2003. Technical Notes The pregnancy estimates in this report and previous reports from this series are the sums of live births, induced abortions, and fetal losses. Live births—Data presented in this report are based on information reported on birth certificates filed for all births in the United States. Data are provided to the National Center for Health Statistics (NCHS) through the Vital Statistics Cooperative Program. Details on the data elements collected in the birth certificate file are discussed in previous reports (5,6). Induced abortions—Abortion data in this report are national estimates based on abortion surveillance information collected from most states by the Centers for Disease Control and Prevention’s National Center for Chronic Disease Prevention and Health Promotion (NCCDPHP), which are adjusted to national totals compiled by The Guttmacher Institute (AGI) from their surveys of all known abortion providers (7,8,9). In 2002, the NCCDPHP abortion surveillance system collected data on abortions by age for 47 states, the District of Columbia, and New York City. No data were available for Alaska, California, and New Hampshire (7). The numbers of abortions published by NCCDPHP tend to be lower than the numbers published by AGI (7). For example, the total number of abortions reported by NCCDPHP was about 20 percent lower in 2000 than reported by AGI for the same reporting areas (7,8). Fetal losses—Information on fetal losses in this report is based on cycles 3 through 6 of the National Survey of Family Growth (NSFG), conducted in 1982, 1988, 1995, and 2002 by NCHS (10,11). This information comes from the pregnancy histories collected for each woman in the NSFG samples. The proportions of recent pregnancies (excluding induced abortions) ending in fetal loss in the years preceding each survey are used to compile estimated fetal loss rates. Data from the last four NSFG cycles have been combined in this way to provide statistical reliability because of small numbers of pregnancies especially for teenagers. The estimates for 1990-2000 in this report have been revised to incorporate the combined fetal loss estimates from Cycles 3 through 6 of the NSFG; previous estimates used data from Cycle 5 only (1,2). The fetal loss figures are estimates, and variations reflect in part the extent to which pregnancies are recognized especially at very early gestation periods. Despite this, the NSFG data are preferable to vital statistics reports of fetal losses, because vital statistics data are generally limited to losses occurring at gestations of 20 weeks or more, whereas NSFG data include all gestations. The vast majority of fetal losses occur early in pregnancy before the reporting requirements for fetal losses are in effect. Even fetal losses of 20 weeks or more are underreported in vital statistics data.
Race and Hispanic
origin
Population denominators
Computation of rates
This page last reviewed October 15, 2008
|