

Geographic
Implementing advanced vehicles, fuels, and infrastructure must be coordinated geographically, as well as temporally. Maps facilitate this coordination. This page features maps that illustrate the convergence of flexible fuel vehicles (FFVs), Clean Cities coalitions, alternative fueling stations, fuel production facilities, and transportation routes for E85. Also available are maps highlighting U.S. biomass production and areas of highest potential for hydrogen consumption.
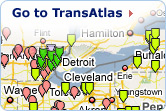
TranAtlas 
This interactive map uses a Google Maps interface to display:
- Existing and planned alternative fueling stations
- Alternative fuel production facilities
- Light-duty vehicle density
- Roads and political boundaries
Users can customize the map display, print, and query the underlying data.
TransAtlas is part of a suite of geographic analysis tools for renewable energy developed at the National Renewable Energy Laboratory.
The following tables feature PDF and JPEG files that can be downloaded and saved. Download Adobe Reader.
E85 Maps
| Description | File |
|---|---|
E85 FFVs, Clean Cities Coalitions, and E85 Refueling StationsMap combining regions with more than 2% penetration of E85-capable FFVs, Clean Cities coalitions, and E85 stations |
(PDF 11.7 MB) |
FFV Registrations by Zip CodeMap of E85 FFV penetration levels by U.S. zip codes |
(PDF 3.5 MB) |
US Federal FFV Fleets and E85 StationsMap of federal FFV fleets and E85 refueling stations |
(JPEG 112 KB) |
Minnesota Ethanol Infrastructure and PopulationMap of Minnesota's ethanol refineries, E85 refueling stations, and zip-codes based population and FFV penetration |
(JPEG 887 KB) |
Biomass and Hydrogen Maps
| Description | File |
|---|---|
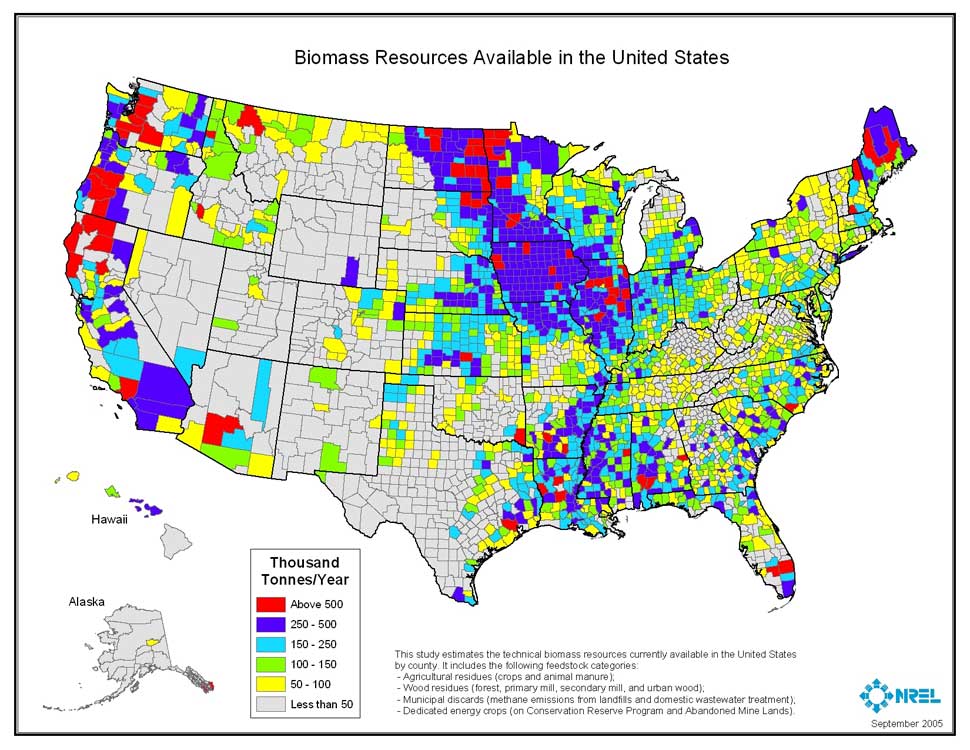
Biomass Resources Available in the United StatesMap of available U.S. biomass resources |
(JPEG 129 KB) |
Hydrogen Infrastructure Demand Consumer StrategyMap of hydrogen demand |
(JPEG 78 KB) |
For more information about the data, analysis, and trends presented on these pages, please contact Caley Johnson at the National Renewable Energy Laboratory.