
USGS/Cascades Volcano Observatory, Vancouver, Washington
Mount St. Helens, Washington
Maps and Graphics, etc.
-
 [Interactive Imagemap,150K,InlineGIF]
Cascade Range Volcanoes
-- Graphic by: Lyn Topinka, 1996
-
 [Map,20K,InlineGIF]
Major West Coast Volcanoes - Washington, Oregon, and California
-
 [Map,27K,InlineGIF]
Potentially Active Volcanoes of the Western United States
-- Modified from: Brantley, 1994, Volcanoes of the United States:
USGS General Interest Publication
-
 [Graphic,70K,InlineGIF]
Cascades Eruptions During the Past 4000 Years
-
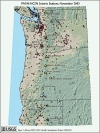
Seismic Monitoring at Cascade Volcanic Centers - The Big Picture
Informational text and shaded relief map
showing locations of all PNSN/NCSN seismic stations operating in the Pacific Northwest as of November, 2003. Map includes the 13 major Cascade volcanic centers.
-- Excerpt from: Moran, 2005, USGS Scientific Investigations Report 2004-5211
-
 [Map,18K,InlineGIF]
Washington State and the Columbia River.
-- includes major volcanoes
-
 [Map,40K,InlineGIF]
University of Washington's Pacific Northwest Seismic Network
-- Modified from: University of Washington Geophysics Program, 1998,
includes seismic station location map and link to PNSN
-
 [Map,30K,InlineGIF]
Oregon and Southern Washington -
University of Washington's Pacific Northwest Seismograph Network
-- Modified from: University of Washington Geophysics Program, 1999,
includes seismic station location map and link to PNSN
-
 [Map,26K,InlineGIF]
Mount St. Helens Location
-- Modified from: Costa, 1994, USGS OFR94-313
-
 [Interactive Imagemap,26K,InlineGIF]
Location of the Cascades Volcano Observatory and the
Mount St. Helens National Volcanic Monument
-- Lyn Topinka, 1997
-
 [Interactive Imagemap,47K,InlineGIF]
Mount St. Helens and Vicinity - Points of Interest
-- Lyn Topinka, 1997
-
 [Interactive Imagemap,29K,InlineGIF]
Mount St. Helens National Volcanic Monument
-- Lyn Topinka, 1997
-
 [Map,33K,InlineGIF]
Index to 7.5-minute-USGS-Topographic Quadrangles surrounding
Mount St. Helens National Volcanic Monument
-- Modified from: USDA/USFS, 1990
-
 [Map,20K,InlineGIF]
Major Hydrologic Features in the Mount St. Helens Region
-- Basemap from: Crandell and Mullineaux, 1978, USGS Bulletin
1383-C
-
 [Schematic,13K,InlineGIF]
Windy Ridge Viewpoint - Looking West
-- Modified from: Doukas, 1990, USGS Bulletin 1859
-
 [Image,106K,InlineJPG]
Annotated NASA Image:
Looking South at
Mount Adams, Mount St. Helens, and the Columbia River, Washington,
August 1989.
-- NASA Photo, courtesy NASA Earth From Space;
Modified with text by USGS/CVO
-
 [Image,86K,InlineJPG]
Annotated NASA Image:
Mount St. Helens and Vicinity, Washington, September 1992
-- NASA Photo, courtesy
NASA Earth From Space;
Modified with text by USGS/CVO.
-
 [Image,99K,InlineJPG]
Annotated NASA Image:
Mount St. Helens, Washington, September 1994
-- NASA Photo, courtesy
NASA Earth From Space;
Modified with text by USGS/CVO
-
 [Image,168K,InlineJPG]
Annotated NASA Image:
Columbia River and Mount St. Helens, Washington, October 1994
-- NASA Photo, courtesy
NASA Earth From Space;
Modified with text by USGS/CVO
-
 [Graphic,20K,InlineGIF]
Generalized North-South Geologic Cross Sections Through Mount St. Helens
-- Modified from: Doukas, 1990, USGS Bulletin 1859
-
 [Graphic,651K,InlineJPG]
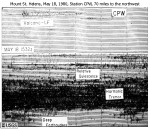
Mount St. Helens Seismogram, May 18, 1980,
-- from Station CPW, 70 miles to the northwest.
-
 [Map,21K,InlineGIF]
Mount St. Helens area showing May 18, 1980 devastation
-- Modified from: Tilling, Topinka, and Swanson, 1990
-
 [Map,14K,InlineGIF]
Distribution within the United States of
May 18, 1980 ash fallout from Mount St. Helens
-- Modified from: Tilling, Topinka, and Swanson, 1990
-
 [Map,22K,InlineGIF]
May 18, 1980 Ash Plume Path
-- Modified from: Sarna-Wojcicki, et.al., 1981, IN:
USGS Professional Paper 1250
-
 [Map,32K,InlineGIF]
Lakes North of Mount St. Helens Affected by the May 18, 1980 Eruption
-- Modified from: Dion and Embrey, 1981, USGS Circular 850-C, and
Embrey and Dion, 1988, WRI-87-4263
-
 [Graphic,18K,GIF]
Surface-water temperatures of Spirit Lake before (1974) and after (1980)
the May 18, 1980 eruption of Mount St. Helens
-- Modified from: Dion and Embrey, 1981, USGS Circular 850-G
-
 [Graphic,18K,InlineGIF]
Plot of thickness vs. distance from vent for several tephras from
Cascade Range volcanoes.
-- Modified from:
Hoblitt, et.al., 1987, USGS Open-File Report 87-297
-
 [Schematic,13K,GIF]
Stratigraphic section in Harry Gardner Park.
-- L, lithic-rich layer; P, pumice-rich layer.
-- Modified from: Doukas, 1990, USGS Bulletin 1859
-
 [Schematic,22K,GIF]
Dome Growth 1980-83 - Ground Profile
-- Taken from tracings of photographs from
fixed photo station on crater floor, approximately 1 kilometer north
of center of dome. Products of each extrusive episode include talus that
accumulated during that episode. Scale varies owing to perspective
view; true east-west basal diameter of dome in
December 1983 was about 830 meters.
-- Modified from: Swanson, et.al., 1987,
IN: GSA Special Paper 212
-
 [Schematic,10K,GIF]
Dome Growth 1980-86 - Yearly Ground Profile
-- Taken from tracings of photographs from
fixed photo station on crater floor, approximately 1 kilometer north
of center of dome. Includes accumulated talus.
Scale varies owing to perspective view. Approximate 1986 east-west
basal diameter of dome was about 860 meters.
-- Modified from: Topinka, 1992, IN: USGS Bulletin 1966
-
 [Schematic,14K,GIF]
Lobe Development
-- Aerial View:
Schematic drawings of lobe development in the growth of a lava dome,
as traced off aerial photographs of
Mount St. Helens Lava Dome, 1980-1981.
-- Modified from: Swanson, et.al., 1987,
IN: GSA Special Paper 212
-
 [Schematic,12K,GIF]
Emerging New Lobe, August 1982
-- Taken from tracings of photographs from
photo station on crater floor, showing 1-day and 2-week intervals.
-- Modified from: Topinka, 1992, IN: USGS Bulletin 1966
-
 [Map,2.14M,PDF]
Hazards Report and Map Menu
Volcanic-Hazard Zonation for Mount St. Helens, Washington, 1995
-- Wolfe and Pierson, 1995, USGS Open-File Report 95-497
-
 [Graphic,18K,GIF]
Map showing 1982 Mount St. Helens Monitoring Sites
-- Modified from: E. Iwatsubo, 1996,
and Brantley and Topinka, 1984
-
 [Graphic,20K,GIF]
Map showing 1995 Mount St. Helens Dome Deformation EDM Lines
-- Modified from: E. Iwatsubo, 1996
-
 [Graphic,30K,GIF]
Map showing Mount St. Helens "OuterNet" Flank
Deformation Trilateration Lines
-- Modified from: E. Iwatsubo, 1996
-
Seismic Monitoring at Cascade Volcanic Centers - The Big Picture
Informational text and shaded relief map
showing locations of all PNSN/NCSN seismic stations operating in the Pacific Northwest as of November, 2003. Map includes the 13 major Cascade volcanic centers.
-- Excerpt from: Moran, 2005, USGS Scientific Investigations Report 2004-5211
-
[Map,40K,InlineGIF]
University of Washington's Pacific Northwest Seismic Network
-- Modified from: University of Washington Geophysics Program, 1998,
includes seismic station location map and link to PNSN
-
[Map,30K,InlineGIF]
Oregon and Southern Washington -
University of Washington's Pacific Northwest Seismograph Network
-- Modified from: University of Washington Geophysics Program, 1999,
includes seismic station location map and link to PNSN
-
 [Map,16K,InlineGIF]
University of Washington's Pacific Northwest Seismograph Network -
Mount St. Helens Vicinity
-- Modified from: University of Washington Geophysics Program,
1997
-
 [Graphic,20K,InlineGIF]
Mount St. Helens Seismicity, 2007,
-- showing relationship between time and depth of earthquakes beneath
Mount St. Helens. "0" depth is referenced to 1.5 km (about 1 mile)
below the current summit of Mount St. Helens (8,363 feet above sea
level).
-- Modified from:
University of Washington's Geophysics Program
-
 [Graphic,29K,InlineGIF]
Mount St. Helens Energy Release, 2007,
-- Each point represents the sum of energy released by all earthquakes in a 14 day period,
Energy is computed in 14 day time windows, every 7 days,
Strain energy is plotted in ergs1/2,
Green triangles, if shown, represent phreatic explosions,
Cyan triangles, if shown, represent dome-building eruptions, and
Red triangles, if shown, represent explosive magmatic eruptions.
-- Modified from:
University of Washington's Geophysics Program
-
 [Graphic,20K,InlineGIF]
Mount St. Helens Seismicity, 2006,
-- showing relationship between time and depth of earthquakes beneath
Mount St. Helens. "0" depth is referenced to 1.5 km (about 1 mile)
below the current summit of Mount St. Helens (8,363 feet above sea
level).
-- Modified from:
University of Washington's Geophysics Program
-
 [Graphic,26K,InlineGIF]
Mount St. Helens Energy Release, 2006,
-- Each point represents the sum of energy released by all earthquakes in a 14 day period,
Energy is computed in 14 day time windows, every 7 days,
Strain energy is plotted in ergs1/2,
Green triangles, if shown, represent phreatic explosions,
Cyan triangles, if shown, represent dome-building eruptions, and
Red triangles, if shown, represent explosive magmatic eruptions.
-- Modified from:
University of Washington's Geophysics Program
-
 [Graphic,20K,InlineGIF]
Mount St. Helens Seismicity, 2005,
-- showing relationship between time and depth of earthquakes beneath
Mount St. Helens. "0" depth is referenced to 1.5 km (about 1 mile)
below the current summit of Mount St. Helens (8,363 feet above sea
level).
-- Modified from:
University of Washington's Geophysics Program
-
 [Graphic,28K,InlineGIF]
Mount St. Helens Energy Release, 2005,
-- Each point represents the sum of energy released by all earthquakes in a 14 day period,
Energy is computed in 14 day time windows, every 7 days,
Strain energy is plotted in ergs1/2,
Green triangles, if shown, represent phreatic explosions,
Cyan triangles, if shown, represent dome-building eruptions, and
Red triangles, if shown, represent explosive magmatic eruptions.
-- Modified from:
University of Washington's Geophysics Program
-
 [Graphic,20K,InlineGIF]
Mount St. Helens Seismicity, 2004,
-- showing relationship between time and depth of earthquakes beneath
Mount St. Helens. "0" depth is referenced to 1.5 km (about 1 mile)
below the current summit of Mount St. Helens (8,363 feet above sea
level).
-- Modified from:
University of Washington's Geophysics Program
-
 [Graphic,20K,InlineGIF]
Mount St. Helens Seismicity, 2003,
-- showing relationship between time and depth of earthquakes beneath
Mount St. Helens. "0" depth is referenced to 1.5 km (about 1 mile)
below the current summit of Mount St. Helens (8,363 feet above sea
level).
-- Modified from:
University of Washington's Geophysics Program
-
 [Graphic,20K,InlineGIF]
Mount St. Helens Seismicity, 2002,
-- showing relationship between time and depth of earthquakes beneath
Mount St. Helens. "0" depth is referenced to 1.5 km (about 1 mile)
below the current summit of Mount St. Helens (8,363 feet above sea
level).
-- Modified from:
University of Washington's Geophysics Program
-
 [Graphic,20K,InlineGIF]
Mount St. Helens Seismicity, 2001,
-- showing relationship between time and depth of earthquakes beneath
Mount St. Helens. "0" depth is referenced to 1.5 km (about 1 mile)
below the current summit of Mount St. Helens (8,363 feet above sea
level).
-- Modified from:
University of Washington's Geophysics Program
-
 [Graphic,20K,InlineGIF]
Mount St. Helens Seismicity, 2000,
-- showing relationship between time and depth of earthquakes beneath
Mount St. Helens. "0" depth is referenced to 1.5 km (about 1 mile)
below the current summit of Mount St. Helens (8,363 feet above sea
level).
-- Modified from:
University of Washington's Geophysics Program
-
 [Graphic,22K,InlineGIF]
Mount St. Helens Seismicity, 1999,
-- showing relationship between time and depth of earthquakes beneath
Mount St. Helens. "0" depth is referenced to 1.5 km (about 1 mile)
below the current summit of Mount St. Helens (8,363 feet above sea
level).
-- Modified from:
University of Washington's Geophysics Program
-
 [Graphic,30K,InlineGIF]
Mount St. Helens Seismicity, 1998,
-- showing relationship between time and depth of earthquakes beneath
Mount St. Helens. "0" depth is referenced to 1.5 km (about 1 mile)
below the current summit of Mount St. Helens (8,363 feet above sea
level).
-- Modified from:
University of Washington's Geophysics Program
-
 [Graphic,23K,InlineGIF]
Mount St. Helens Seismicity, 1997,
-- showing relationship between time and depth of earthquakes beneath
Mount St. Helens. "0" depth is referenced to 1.5 km (about 1 mile)
below the current summit of Mount St. Helens (8,363 feet above sea
level).
-- Modified from:
University of Washington's Geophysics Program
-
 [Graphic,25K,InlineGIF]
Mount St. Helens Seismicity, 1996,
-- showing relationship between time and depth of earthquakes beneath
Mount St. Helens. "0" depth is referenced to 1.5 km (about 1 mile)
below the current summit of Mount St. Helens (8,363 feet above sea
level).
-- Modified from:
University of Washington's Geophysics Program
-
 [Graphic,25K,InlineGIF]
Mount St. Helens Seismicity, 1995,
-- showing relationship between time and depth of earthquakes beneath
Mount St. Helens. "0" depth is referenced to 1.5 km (about 1 mile)
below the current summit of Mount St. Helens (8,363 feet above sea
level).
-- Modified from:
University of Washington's Geophysics Program
-
 [Graphic,25K,InlineGIF]
Mount St. Helens Seismicity, 1980-1998,
-- showing relationship between time and depth of earthquakes beneath
Mount St. Helens. "0" depth is referenced to 1.5 km (about 1 mile)
below the current summit of Mount St. Helens (8,363 feet above sea
level).
-- Modified from:
University of Washington's Geophysics Program
-
 [Graphic,25K,InlineGIF]
Mount St. Helens Seismicity, 1980-1996,
-- showing relationship between time and depth of earthquakes beneath
Mount St. Helens. "0" depth is referenced to 1.5 km (about 1 mile)
below the current summit of Mount St. Helens (8,363 feet above sea
level).
-- Modified from:
University of Washington's Geophysics Program
-
[Graphic,651K,InlineJPG]
Mount St. Helens Seismogram, May 18, 1980,
-- from Station CPW, 70 miles to the northwest.
-
 [Map,InlineGIF]
Location Map, Major Hydrologic Data Collection Sites
surrounding Mount St. Helens
-- Current and Historical
-
 [Map,16K,GIF]
Location Map, Castle Lake Piezometers
-- Modified from: Roeloffs, 1994, USGS WRI-94-4075
-
 [Table,14K,GIF]
Summary of drainage basin and channel characteristics,
Lewis River system
-- From: Martinson, et.al., 1985, USGS Open-File Report 85-631
-
 [Table,15K,GIF]
Summary of eruptive effects, Lewis River system
-- From: Martinson, et.al., 1985, USGS Open-File Report 85-631
-
 [Table,14K,GIF]
Drainage basin characteristics and volcanic impacts,
Toutle River system
-- From: Meyer and Dodge, 1987, USGS Open-File Report 87-549
-
 [Graphic,12K,GIF]
Erosion of North Fork Toutle River at Loowit Confluence,
1982 vs. 1990
-
 [Graphic,11K,GIF]
Flood of February 1996 - Cowlitz River at Castle Rock
-- stage adjusted to feet above sea level (NAVD88)
-
 [Graphic,12K,GIF]
Flood of February 1996 - Toutle River at Tower Road
-- stage in feet above gage (1929NGVD)
-
[Graphic,70K,InlineGIF]
Cascades Eruptions During the Past 4000 Years
-
 [Graphic,14K,GIF]
Post-A.D. 1400 segment of eruptive history of Mount St. Helens
-- From: Tilling et.al., 1990
-
 [Table,27K,InlineGIF]
Simplified Eruptive History of Mount St. Helens
-- Modified from: Swanson et.al., 1989, AGU Field Trip Guidebook T106,
Original Simplified from: Crandell, 1987
-
 [Schematic,25K,GIF]
West-East Geologic Section of gully bank near NE base of
Mount St. Helens, south of Windy Ridge
-- Modified from: Doukas, 1990, USGS Bulletin 1859
-
 [Schematic,25K,GIF]
Generalized stratigraphic section of outcrop at
Muddy River-Pine Creek Fan (near Lahar Viewpoint).
-- Modified from: Doukas, 1990, USGS Bulletin 1859
-
[Graphic,18K,InlineGIF]
Plot of thickness vs. distance from vent for several tephras from
Cascade Range volcanoes.
-- Modified from:
Hoblitt, et.al., 1987, USGS Open-File Report 87-297
Return to:
[Mount St. Helens Menu] ...
[Mount St. Helens Eruptive History Menu] ...
[Mount St. Helens May 18, 1980 Menu] ...
[MORE Cascade Range Maps and Graphics]
[MORE Washington State Maps and Graphics]
[MORE Annotated NASA Images]

Use of CVO Material and Copyright Information
URL for CVO HomePage is:
<http://vulcan.wr.usgs.gov/home.html>
URL for this page is:
<http://vulcan.wr.usgs.gov/Volcanoes/MSH/Graphics/framework.html>
If you have questions or comments please contact:
<GS-CVO-WEB@usgs.gov>
09/02/08, Lyn Topinka
 [Graphic,18K,GIF]
 [Schematic,13K,GIF]
 [Schematic,22K,GIF]
 [Schematic,10K,GIF]
 [Schematic,14K,GIF]
 [Schematic,12K,GIF]
 [Graphic,18K,GIF]
 [Graphic,20K,GIF]
 [Graphic,30K,GIF]
 [Map,16K,GIF]
 [Table,14K,GIF]
 [Table,15K,GIF]
 [Table,14K,GIF]
 [Graphic,12K,GIF]
 [Graphic,11K,GIF]
 [Graphic,12K,GIF]
 [Graphic,14K,GIF]
 [Schematic,25K,GIF]
 [Schematic,25K,GIF]