Kai Ge Research Images
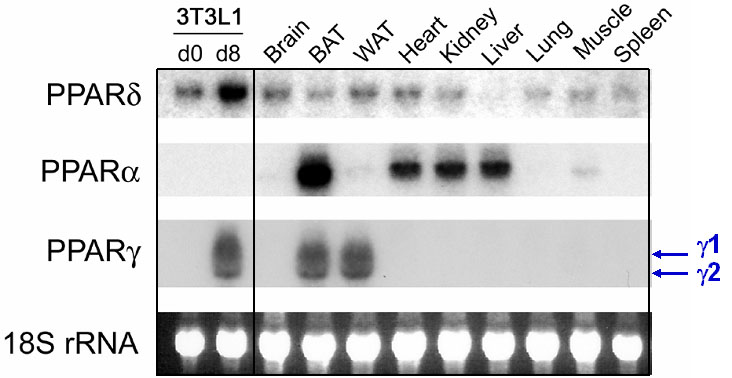
Fig. 1. Tissue distribution of PPARs: Northern blot analysis of expression of PPARs in mouse tissues and in 3T3L1 adipogenesis. BAT, brown adipose tissue; WAT, white adipose tissue.
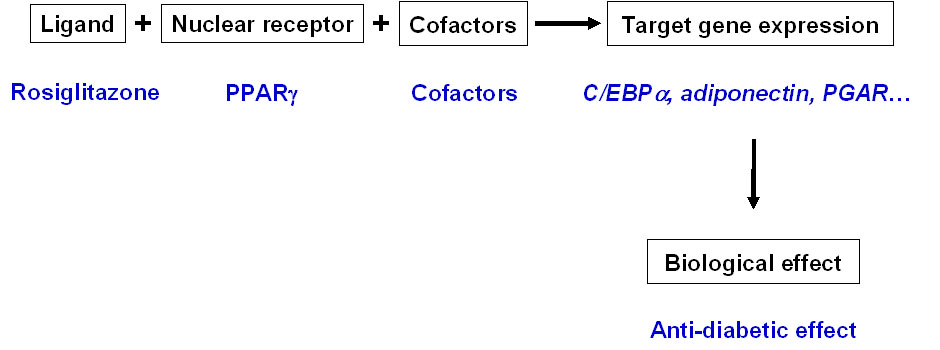
Fig. 2. Molecular mechanisms of nuclear receptor biology.
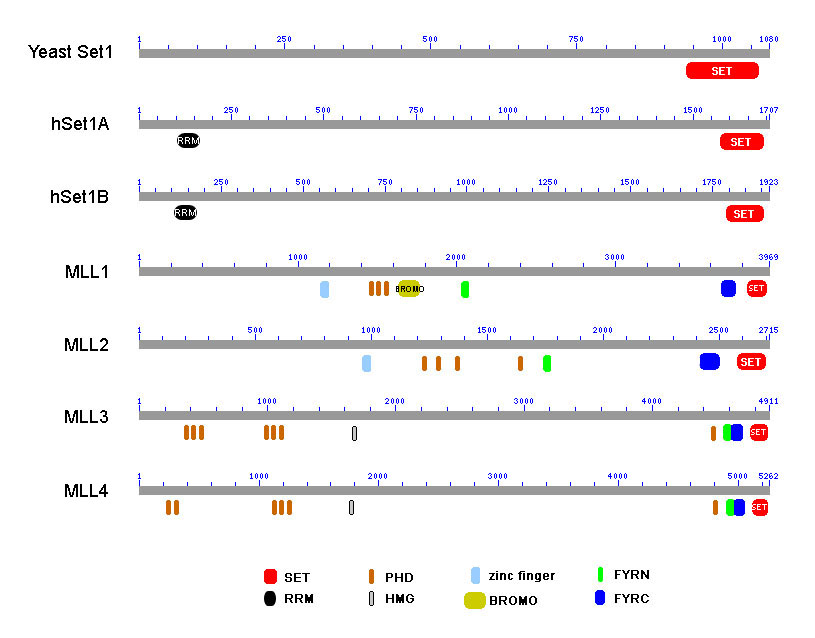
Fig. 3 Domains in yeast Set1 and human Set1-like histone methyltransferases.
Page last updated: December 16, 2008