Publication and Information Products
Aging Trends
February 2008
No. 9
Multiple Causes of Death in Old Age
By Yelena Gorina, M.S., M.P.H., and Harold Lentzner, Ph.D.
Page Content
Highlights Overview Where do the data come from?
How many causes of death are usually reported? Has the number of causes changed over time?
What are the most common causes of death among older adults?
Are there common combinations of causes of death?
What do we learn from an examination of multiple causes?
About the data References Figures Tables
Highlights
Information on all conditions listed on the death certificate can provide a more complete picture of comorbidity at the time of death. This analysis shows that:-
On average about three causes are listed on the death certificates of older decedents.
-
Heart disease and cancer, the leading underlying causes of death are also the most prevalent when all causes on the death certificate are considered.
-
Of the major causes, diabetes, septicemia, and pneumonia are two to three times as likely to be listed as associated than as underlying causes; by contrast, cancer is most often reported as underlying cause of death.
-
Certain conditions are reported together on the same death certificate more often than would be expected if they were unrelated; for example diabetes and ischemic heart disease, and Alzheimer's disease and pneumonia.
Overview
What is known about the nature of fatal diseases and injuries is based largely upon the tradition of identifying a single condition present at death as the underlying cause. As stated on the U.S. Standard Certificate of Death, the underlying cause is considered to be the disease or injury that initiated events resulting in death.
In many cases there is little question regarding the cause that initiated the events resulting in death. For example, an individual may die from a genetic disorder such as cystic fibrosis or from injuries suffered in a car crash. Other conditions listed on the death certificate may be part of the sequence of events leading to death or might have contributed to death in other ways. In some situations, however, especially among older adults, several potentially fatal disease processes may be present or there may be a set of conditions that jointly contribute to death. The certifying physician or medical examiner determines which conditions "caused" death, and in some cases that decision may be arbitrary.
In cases such as these, the complexity of morbid processes is better understood through the application of multiple cause-of-death (MCD) statistics. MCD can be used to better determine the impact of some diseases that alone or in combination with other diseases accelerate fatal processes, even though they are not often identified as the underlying cause of death. Monitoring trends in fatal outcomes of diseases and injuries and the frequency of common patterns of causes of death also may offer insight into emerging health issues affecting older Americans. Knowledge of the common combinations of diseases on death certificates can suggest further epidemiological investigations. Data from the National Vital Statistics System, used in this report, provide information on mortality by both underlying and multiple cause of death.
How does cause of death reporting work?
Through the National Vital Statistics System, the National Center for Health Statistics (NCHS), Centers for Disease Control and Prevention, collects and publishes data on deaths obtained from the registration offices of all states, the District of Columbia, Puerto Rico, the Virgin Islands, and Guam. The process begins with a death certificate completed by a medical certifier, often the attending physician, which includes information on all causes of death. For the purpose of national mortality statistics, every death is attributed to just one underlying condition drawn from all the conditions stated on the death certificate. The underlying cause is used in most official reports and medical research. However, additional medical information is compiled and provided in official multiple cause-of-death data files produced by NCHS.
Cause of death is coded according to the appropriate revision of the International Classification of Diseases (ICD). Effective with deaths occurring in 1999, the United States began using the Tenth Revision of the ICD (ICD-10); during the period 1979-1998, causes were coded and classified according to the Ninth Revision (ICD-9). Each of the changes in revisions has produced some artificial discontinuities in cause-of-death trends. For more information on cause-of-death classification see Technical Notes in "Deaths: Final Data for 2004".
Where do the data come from?
Data for this report have been drawn from the detailed multiple cause-of-death files from the National Vital Statistics System maintained by NCHS. Selected data are also available in tables on the NCHS Trends in Health and Aging website. The Trends in Health and Aging website is a user-friendly, web-based archive of statistics on the health-related aspects of life of older Americans developed by NCHS, with support from the National Institute on Aging. This report is drawn from tables that display the number of conditions listed on death certificates, disease-specific counts of underlying and all reported causes of death, and patterns of comorbidity. A complete set of tables is available from the authors on request.
Terminology
Underlying cause of death - The disease or injury that initiated the train of events leading directly to death.
Associated causes - Causes other than the underlying cause, listed on the death certificate, both in the sections for sequence of events and for other contributing conditions.
Reported causes - All diseases or injuries recorded on the death certificate, both underlying and associated causes. Also referred to as "any mention" or "multiple" causes.
Leading causes of death - The most frequently occurring causes of death among a standard list of rankable causes, produced by NCHS. The rankings usually refer to underlying cause.
Rankable causes of death - The major mutually exclusive causes of death, reporting of which is considered most useful from a public health perspective.
How many causes of death are usually reported? Has the number of causes changed over time?
The cause-of-death component of the "standard" death certificate provides the medical certifier with a two-part format to enter all relevant diseases and conditions present at the time of death (Figure 1). Part I reports the chain of events resulting in death. Each condition or disease listed in Part I should cause the condition recorded on the line above it. The condition on the last line initiated this chain of events and is usually accepted as the underlying cause of death. Other significant conditions contributing to the death but not part of this chain are reported separately in Part II.
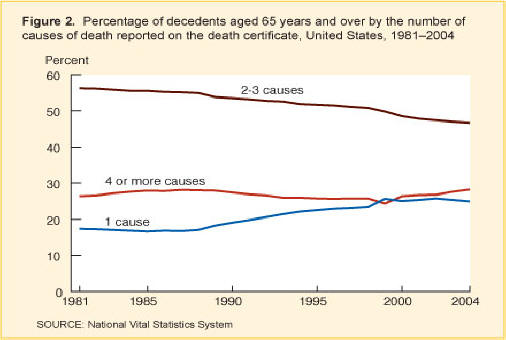
In 2004, one-quarter of all deaths of those 65 years and over had only a single cause entered on the death certificate. In another one-quarter, the underlying cause and one other condition were reported, and one-half of all deaths had three or more causes reported. Persons 75 years and over were slightly more likely to have three or more causes reported than younger seniors. The distribution for men and women was about the same.
Over the last two decades, the proportion of deaths among older adults with only one cause reported has modestly increased while the proportion with two or three causes declined (Figure 2). This seems to have reversed a rising trend in reporting of multiple causes for all deaths that occurred throughout much of the 20th century.1 In the early 1980s, about 83 percent of the deaths of older adults had more than one cause reported; by 2004 the rate had fallen to about 75 percent. Declines were evident for both sexes and for all age groups. The number of deaths that had four or more causes listed increased slightly in the late 1980s, declined toward the end of the century, and then increased slightly again.
Autopsies and cause of death
One possible reason for the decline in the number of causes on the death certificate between 1981 and 2004 is the decrease in the number of autopsies performed. Autopsies are conducted in part to evaluate the quality of medical care and "enhance the quality of cause-of-death information reported on the death certificate." Numerous studies have shown their value Hoyert, et al. Autopsy rates have fallen dramatically from about 1 in 4 hospital deaths in the 1960s to less than 1 in 10 by the mid-1990s.
Over a two-decade interval, the proportion of deaths with only one cause reported on the death certificate increased.
What are the most common causes of death among older adults?
Multiple cause-of-death data provides the opportunity to rank a cause such as heart disease or diabetes based on its prevalence as the underlying cause or as one of the reported or multiple causes of death. See the table on the Trends in Health and Aging website.
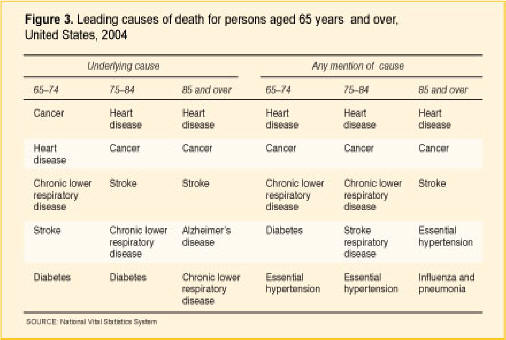
In 2004, out of the 1,755,669 total deaths among persons 65 years and over, 30 percent were from heart diseases, 22 percent were from cancer, and 7 percent were from stroke based on the underlying cause of death. Using either underlying cause or any mention of cause, heart disease, cancer, and stroke remain the leading causes of death among older Americans (Table 1). However, the impact of other chronic diseases is more evident when multiple causes of death are considered (Figure 3). In 2004, for example, essential hypertension and pneumonia, based on any mention as opposed to underlying cause, were more frequently reported for decedents 85 years or over than Alzheimer's disease and chronic lower respiratory diseases, the fourth and fifth leading underlying cause of death.
Over time, the frequency of reporting common chronic illnesses on the death certificate can change dramatically. In 1981, for example, atherosclerosis was the fifth most common cause mentioned on death certificates of the oldest decedents and Alzheimer's disease was almost never mentioned. Since 1999, however, Alzheimer's disease has been more frequently mentioned than atherosclerosis. Reporting of Alzheimer's disease as both an underlying and associated cause of death increased significantly after 1998 when ICD-10, the new system of disease classification, was introduced. Increased awareness of Alzheimer's disease among clinicians is another reason for the increase.
Some chronic diseases are much more likely than others to be recorded as the underlying cause of death
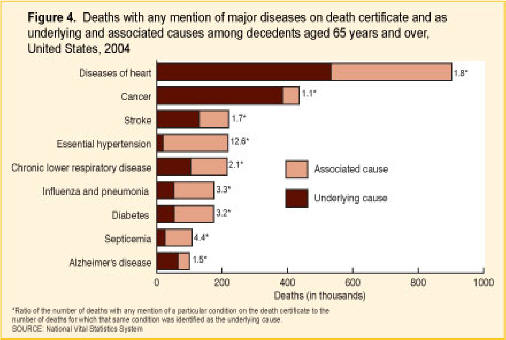
One of the measures of the contribution of a major disease or injury to mortality is the ratio of the number of deaths with any mention of that particular condition on the death certificate to the number of deaths for which the condition was identified as the underlying cause. A ratio of 1.0, the minimum value, indicates that the condition was always selected as the underlying cause whenever it appeared on a death certificate; a ratio of 2.0 indicates that for every death for which the condition was the underlying cause, there was another where the condition was an associated cause. See the table on the Trends in Health and Aging website.
In 2004, of the most common chronic causes of death for persons 65 years of age or over, heart disease, cancer, stroke, and Alzheimer's disease all had ratios of less than 2.0 (Figure 4). Cancer with a ratio of 1.1 was most likely to be listed as the underlying cause if it was on the death certificate. Among older decedents, diseases associated with frailty, such as congestive heart failure, pneumonia, septicemia, anemia, and nutritional deficiency, as well as other commonly listed causes, such as diabetes, renal failure, essential hypertension, and chronic lower respiratory diseases had ratios of over 2.0 (ratios not shown in Figure 4 are available from the authors on request). In 2004, diabetes was the underlying cause in only one of every three deaths for which it was listed as a cause of death, while Alzheimer's disease was twice as likely to be listed as the underlying cause than as an associated condition.
Of the major causes of death, cancer is most often recorded as the underlying cause when reported on a death certificate.
Changes in the death certificate and coding system can affect the ratio of any mention to underlying cause for some causes of death. In 1989, after the standard death certificate was revised to improve the cause-of-death recording, the ratio sharply declined for diabetes and increased for septicemia. Between 1998 and 1999, the transition to the ICD-10 classification system of diseases and revision of the rules for selecting the underlying cause of death resulted in sharp increases of the ratio for pneumonia and decreases for chronic lower respiratory diseases, nutritional deficiencies, atherosclerosis, and chronic liver diseases and cirrhosis. For other diseases, however, such as Alzheimer's, septicemia, and renal failure the death rates changed dramatically after 1998, but the ratio of deaths with any mention of the condition to deaths with the condition as an underlying cause followed the trends that existed before 1998.
Are there common combinations of causes of death?
We know that the presence of certain diseases can increase the risk of death from other diseases. For example, diabetes increases the risk of death from stroke and heart disease. Other conditions such as pneumonia, renal failure, or anemia may occur as a consequence of the debilitating effects of the underlying cause of death. For example, a completed cause-of-death sequence may list heart disease as the underlying cause of death with pneumonia as the immediate or final cause; diabetes and Alzheimer's disease may be listed as contributing causes.
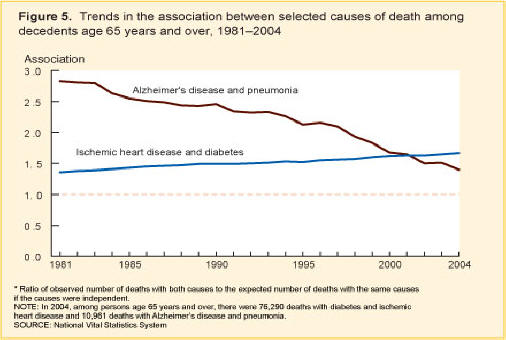
Multiple cause-of-death analysis offers an opportunity to better understand the connection between certain diseases and conditions at the time of death. One way to describe associations between two or more causes of death is to calculate the ratio of the observed number of deaths with a combination of the causes to the expected number of deaths with the same combination of causes if the causes were independent. A value higher than 1 indicates an association stronger than expected, a value less than 1 suggests a less than expected association.
A measure of association
The strength of an association between two causes of death is calculated as a ratio of the numbers:
Observed numbers of deaths with both causes A&B
divided by
Expected numbers of deaths with both causes A&B
The observed number of deaths can be obtained from the multiple cause-of-death files.
The expected number of deaths based on an assumption of independence is:
(Deaths with cause A)
multiplied by
(Deaths
with cause B)
divided by
Total deaths (all causes)
Example: The association between diabetes and stroke is stronger than expected and decreases with age.
| Age | Total deaths | Deaths with stroke recorded | Deaths with diabetes recorded | Expected deaths (stroke & diabetes) | Observed deaths (stroke & diabetes) | Ratio of observed to expected deaths |
|---|---|---|---|---|---|---|
| 65-74 |
399,666 |
35,937 |
50,507 |
4,542 |
6,813 |
1.50 |
| 75-84 |
684,230 |
86,398 |
75,280 |
9,506 |
12,906 |
1.36 |
| 85 and over |
671,773 |
97,479 |
48,343 |
7,015 |
8,791 |
1.25 |
For decedents 65 years of age and over, the joint frequencies of some of the most common pairs of causes of death show, for example, a strong association at death for diabetes with heart disease, essential hypertension, renal failure, stroke, atherosclerosis, and anemia (Table 2). Lower than expected associations were found, for example, between malignant neoplasms as a group and other major chronic illnesses (however there was an elevated association between cancer of the trachea, bronchus and lung, and chronic lower respiratory diseases).
The strength of an association between causes of death sometimes changes over time. Thus, the association between ischemic heart disease and diabetes increased between 1981 and 2004, and the link between Alzheimer's disease and pneumonia declined (Figure 5).
For most of the examined pairs of causes of death, associations were similar for men and women. Associations often differ by age, generally decreasing with age. Figure 6 shows that the association between ischemic heart disease and diabetes decreases with older age, but the association has been increasing over time within each age group.
Medical professionals have long been aware that the presence of certain chronic conditions increases the risk of acquiring or exacerbating others and that system failure at the end of life often produces a cascade of fatal conditions. This study and others2 confirm those observations through an evaluation of paired causes of death. In expanding the investigation to include the associations between three co-occurring causes of death, Stallard showed that diabetes is closely associated with combinations of heart disease and hypertension and stroke and hypertension. The 1981-2004 tables produced for three-way combinations of selected causes of death are available from the authors on request.
What do we learn from an examination of multiple causes?
Multiple cause-of-death data complement traditional underlying cause-reporting by highlighting the extent and types of comorbid conditions contributing to death.
This study shows that while the vast majority of older adult decedents have multiple conditions listed on the death certificate, the proportion with only one cause recorded has increased since the 1980s. This could reflect a true decline in fatal comorbidity. However, it may also be the case that medical histories are deficient or that medical certifiers are not receiving the appropriate training to record all the conditions that caused the death. The decline in autopsies may also have contributed to the decline in the number of causes recorded.
When multiple cause-of-death statistics are examined, it is evident that major chronic conditions not always listed as underlying causes of death are important contributors to mortality for older adults, although heart disease, cancer, and stroke are still the most common causes. In interpreting the importance of any cause of death at a given time or across time, it is important to recognize that the numbers reflect not only patterns of diseases and treatments, but also changes in the coding system, and in the level of scientific knowledge and "average clinical opinion of the certifiers." This average may mask underlying differences of opinion among certifiers regarding the presence or clinical importance of a disease. These differences may be present by geographical region, age cohort, or medical training. Average clinical opinion can change as the fatal impact of conditions such as diabetes or Alzheimer's disease becomes better understood.
About the data
Information on mortality comes from death certificates collected by the states and forwarded to NCHS for processing and publishing. Geographic coverage has been complete since 1933 and the quality and availability of the data have made death rates an important barometer of the health and well-being of the population. NCHS has released data files with multiple cause-of-death information since 1968. These files contain codes for all diagnostic terms reported on the death certificate and also demographic information.
As is the case with all data collection systems, mortality data have limitations to consider when estimating levels and trends in multiple-cause mortality in older persons.
Causes of death are sometimes missed on the death certificates of older adults. The completeness of the death certificate depends on the thoroughness of the certifier and on the amount of information available. Studies show that the quality of the decedent's medical history, and thus the physician's report, diminishes with the age of the deceased. Incompleteness of the death certificate for elderly decedents may be a particular problem for those dying in long-term-care institutions where medical certification may be handled with less precision, less is known about the decedents' medical histories, and less diagnostic information is available from laboratory tests and autopsy results.3
Trends in causes of death may be affected by changes in coding conventions, in the death certificate format, or in the training of medical certifiers. As an illustration, when the Ninth Revision of the ICD replaced the Eighth in 1979, the number of deaths attributed to septicemia jumped abruptly, then leveled off after certifiers received instructions to report more specific illnesses as the underlying cause of death. The introduction of the Tenth revision of the ICD in 1999 has produced some new discontinuities; however, in most cases multiple cause data, which identify all conditions and are not affected by changes in the rules for selecting the underlying cause, can supplement analysis of underlying cause of death during a transition period.
As another example, in 1989, after the format of the death certificate was changed to include more space to encourage certifiers to provide more complete information, a study found that the mortality trend for some causes of death changed significantly.4 Similarly, diabetes as a cause of death increased rapidly after instructions on the death certificate included diabetes as an example. This may have reminded certifiers to include this disease.
There is also varying reliability in the reporting of other characteristics of older decedents including age, race, and ethnicity. Nonetheless, cause-of-death data provide important measures of outcomes in public health research.
References
- Israel R, Rosenberg H, Curtin L. Analytical potential for multiple cause-of-death data. Am J Epidemiol 24(2):161-79. 1986.
- Stallard E. Underlying and multiple cause mortality at advanced ages: United States 1980-1998. North American Actuarial J 6(3):64-87. 2002.
- Feinleib M. Measuring the health and health care of the aging. Vital Health Stat 5 (6):3-4. 1991.
- Hoyert D, Rosenberg H, MacDorman M. Effect of changes in death certificate format on cause specific mortality trends, United States, 1979-92. Death certification and mortality statistics: An International Perspective. Studies on medical and population subjects 64:47-58. 2000.
Suggested citation
Gorina Y. and Lentzer H. Multiple causes of death in old age. Aging Trends, No. 9. Hyattsville, MD. National Center for Health Statistics. 2008.
Figures


Tables
| Cause of death | Underlying cause of deaths (number) | Underlying cause of total deaths (percent) | Any mention of cause of deaths (number) | Any mention of cause of total deaths (percent) |
|---|---|---|---|---|
Diseases of heart |
533,302 |
30 |
903,595 |
51 |
Cancer |
385,847 |
22 |
435,162 |
25 |
Stroke |
130,538 |
7 |
219,814 |
13 |
Chronic lower respiratory
diseases |
105,197 |
6 |
215,728 |
12 |
Alzheimer's disease |
65,313 |
4 |
100,247 |
6 |
Diabetes |
53,956 |
3 |
174,130 |
10 |
Influenza and pneumonia |
52,760 |
3 |
175,361 |
10 |
All deaths |
1,755,669 |
100 |
1,755,669 |
… |
... Category not applicable.
SOURCE: National Vital Statistics System
| Selected cause | Association1 | Deaths2 |
|---|---|---|
Essential hypertension |
2.74 |
54,078 |
Renal failure |
2.16 |
34,987 |
Atherosclerosis |
1.81 |
7,767 |
Anemia |
1.62 |
5,734 |
Stroke |
1.42 |
27,874 |
Heart disease |
1.3 |
117,810 |
Hypertensive heart disease
|
1.76 |
5,662 |
Heart
failure
|
1.71 |
36,475 |
Ischemic heart disease
|
1.67 |
76,290 |
Other
heart diseases
|
1.17 |
54,538 |
Septicemia |
1.16 |
12,449 |
1Ratio of observed number of deaths with diabetes and selected cause to the expected number of deaths with the same causes if the causes were independent.
2Number of death with diabetes and selected cause mentioned on the death certificate.
SOURCE: National Vital Statistics System
Page Last Modified: November 20, 2008
Content Source: CDC: National Center for Health Statistics
National Center for Health
Statistics
3311 Toledo Road
Hyattsville, MD 20782
Phone:
1-800-232-4636
nchsquery@cdc.gov
Centers for Disease Control and Prevention, 1600 Clifton Rd, Atlanta, GA 30333, U.S.A
Tel: (404) 639-3311 / Public Inquiries: (404) 639-3534 / (800) 311-3435