Publication and Information Products
Aging Trends
No. 8
Trends in Influenza and Pneumonia Among Older Persons in the United States
by Yelena Gorina, Tanika Kelly, James Lubitz, and Zahiyah Hines, Office of Analysis and Epidemiology
PDF version 944 KB
Page Content
Highlights Introduction Influenza and Pneumonia Mortality
Health Care Utilization and Exposure for Influenza and Pneumonia
Influenza and Pneumococcal Vaccination About Data References Figures Tables
Highlights
-
In 2004, influenza and pneumonia ranked seventh among leading causes of death for persons 65 years of age and over, accounting for 3 percent of total deaths in that age group.
-
The death rate from influenza and pneumonia is nearly 130 times higher among persons 85 years of age and over than among persons 45-54 years of age. This increase in risk with age is substantially larger than that seen for heart disease, cancer, stroke, and other leading causes of death.
-
Between 1997 and 2006, the rate of persons aged 65 years and over with an annual influenza vaccination remained relatively stable and was 64 percent in 2006. The rate for lifetime pneummoccal vaccination increased from 43 percent in 1997 to 56 percent in 2002 and remained at 56 to 57 percent through 2006. Non-Hispanic black and Hispanic persons continue to have significantly lower vaccination rates than those of non-Hispanic white persons.
Introduction
For older adults aged 65 years and over, both influenza and pneumonia are diseases with serious consequences, including hospitalization, debilitating conditions, and death. Pneumonia is also a common complication of influenza, caused either by secondary bacterial infection or the influenza virus itself. Persons with certain chronic conditions are at an increased risk for complications from influenza and pneumonia, and older adults with heart or lung disease are at particularly high risk for complications from these diseases. Older adults with conditions such as diabetes, renal disease, stroke or dementia, or rheumatologic disease are also at increased risk for complications (1).
In 1900, influenza and pneumonia was the leading cause of death for the overall population, followed closely by tuberculosis and diarrhea (2). As living conditions, sanitation, nutrition, and medical care improved, chronic diseases replaced infectious diseases as the leading causes of death. Today, none of the five leading causes of death for the overall population are infectious diseases, but influenza and pneumonia still affect a significant portion of the population aged 65 years and over.
Age-adjustment of rates
Most of the rates presented in this report for the population aged 65 years and over are age adjusted to the U.S. standard population in 2000. The age-adjusted rates are calculated using age-specific rates for three age groups (65-74, 75-84, and 85 and over) for the data from the National Vital Statistics System, National Hospital Discharge Survey, and National Health Interview Survey estimates, and for two age groups (65-74 and 75 and over) for Behavioral Risk Factor Surveillance System estimates. Age-adjusted rates eliminate differences in observed rates that result from differences in age composition. They are used to compare rates across demographic groups and over time and should not be used to represent the actual vaccination coverage level in any particular population.
Influenza and Pneumonia Mortality
Age is an important risk factor for mortality because the death rate for influenza and pneumonia rises sharply with age (Table 1). In 2004, almost 60,000 deaths were caused by influenza and pneumonia, and more than 85 percent of those deaths were among persons 65 years of age and over. In the same year, influenza and pneumonia was the seventh leading cause of death for persons aged 65 years and over, accounting for 3 percent of all deaths in that age group. Although pneumonia was listed as the underlying cause of death for 98 percent of the deaths due to influenza and pneumonia in 2004, influenza often goes undiagnosed, and some deaths attributed to pneumonia may actually be due to influenza (3). In addition, pneumonia may be coded as the underlying cause of death when it is actually a complication of another unreported condition.
The trend in influenza and pneumonia death rates among those 65 years of age and over was stable between 1987 and 1998 and modestly decreased between 1999 and 2004, with some fluctuations from year to year (Table 2).
The apparent drop in the influenza and pneumonia death rate between 1998 and 1999 is due to changes in influenza and pneumonia mortality coding. From 1979 to 1998, ICD-9 codes were used for mortality data; however, since 1999, cause of death has been coded using the ICD-10 system. After adjusting for the change in classification systems by multiplying by the comparability ratio, the apparent decrease in influenza and pneumonia death rates is greatly reduced (4). The influenza and pneumonia death rate for 1998 is 173 deaths per 100,000 population after this adjustment.
The International Classification of Diseases (ICD)
The International Classification of Diseases (ICD) is used to code the medical conditions and injuries listed on death certificates. The regulations of the World Health Organization specify that member nations classify and code causes of death in accordance with the current revision of the ICD. The current version, ICD-10, which came into use in 1999, is more detailed than ICD-9 and also changed some of the coding rules and rules for selecting the underlying cause of death. Consequently, pneumonia death rates among the population aged 65 years and over in the United States dropped 30 percent in 1999, primarily because of the change to the ICD-10 rules for selecting the underlying cause of death. In the Trends in Health and Aging website mortality tables (use http://205.207.175.93/aging/download.htm version), one can see the ICD codes for a highlighted cause of death by clicking on the label button at the top of the table. In the latest tables, one can see ICD-9 codes for the years 1979-1998 and ICD-10 codes for 1999 onward. In the historical mortality tables (with data for 1968-1980), the codes shown are from ICD-8 for the years 1968-1978, and from ICD-9 for 1979-1980. The effect of changes in classification and coding rules is measured by comparability ratios. Visit NCHS website to learn about studies of the comparability among ICD revisions.
Death rates by race and ethnicity
No differences exist between the non-Hispanic black and non-Hispanic white populations' influenza and pneumonia mortality rates. But mortality data collected since 1984 indicate that Hispanic persons aged 65 years and over have lower influenza and pneumonia death rates than those of the non-Hispanic white and non-Hispanic black populations in the same age group. (Figure 1).
Race and Hispanic origin on the death certificate are reported by an informant or on the basis of observation, which may result in misreporting. Research has shown an underestimation of deaths and death rates among persons of Hispanic origin (5). However, a study based on patients with community-acquired pneumonia discharged from an acute care hospital in California found that the Hispanic population had a lower risk of death from community-acquired pneumonia than the white population in California (6).
Death rates by sex
Men 65 years of age and over have higher influenza and pneumonia age-adjusted death rates than those of women in the same age group. The disparity in rates dropped from 80 percent in 1982 to less than 40 percent in 2004 (Figure 2).
In 2004, influenza and pneumonia age-adjusted death rates among persons aged 65 years and over varied by state, from more than 180 deaths per 100,000 population in Tennessee, Massachusetts, and New York to less than 90 deaths per 100,000 in Washington and Florida (Table 3).
Multiple cause-of-death mortality
By considering not just the single underlying cause of death, but also the other accompanying health problems listed on the death certificate (the comorbid conditions, or associated causes of death), a much more complete picture of the cause of death is achieved. These associated causes play an important role in contributing to death.
Influenza and pneumonia comorbidity at the time of death
The death rates reported above are for influenza and pneumonia as an underlying cause of death. However, it is also important to consider any mention of influenza and pneumonia on the death certificate, especially for decedents aged 65 years and over.
In 2004, in addition to about 53,000 deaths with influenza or pneumonia as the underlying cause of death among older persons aged 65 years and over, there were about 123,000 deaths with influenza and pneumonia mentioned on the death certificate. Pneumonia may develop as a complication of another infection or malnourishment, especially among debilitated older persons. Complications from pneumonia, such as bacteremia, lung abcess, and meningitis, are also likely to occur in the older population.
Health Care Utilization and Exposure for Influenza and Pneumonia
Because of the high morbidity and mortality associated with influenza and pneumonia in the population 65 years of age and over, significant health care utilization and expenditures are associated with these diseases.
Trends in average length of hospital stay and hospital discharges rates
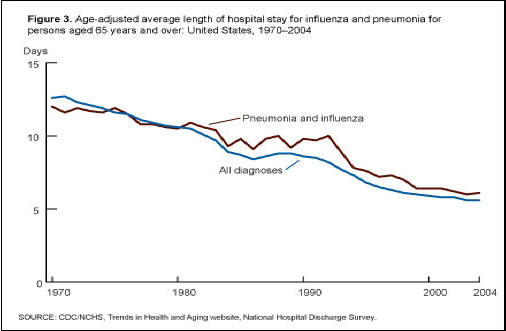
The average length of hospital stays for persons aged 65 years and over with influenza and pneumonia as the first listed diagnosis has decreased significantly in the last three decades, similar to most other diagnoses (Figure 3). The shorter hospital stays reflect improvements in hospital care, which increase options for postdischarge care and cost containment incentives (7,8).
From 1970 to 2004, hospital discharge rates among persons aged 65 years and over increased 80 percent for influenza and pneumonia, whereas the rates for all hospital discharges increased only 16 percent. From 1970 to 1997, the hospital discharge rates for influenza and pneumonia for those aged 85 years and over increased more rapidly than those for persons aged 65-84 years and then declined from 1997 to 2004 (Figure 4).
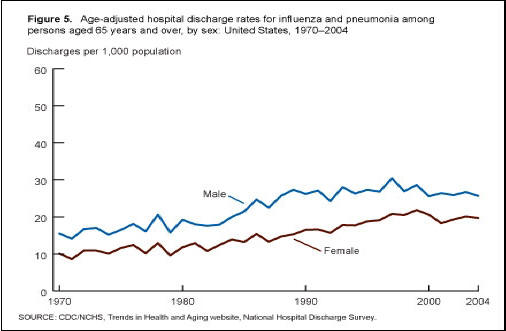
The discharge rates for influenza and pneumonia for older men aged 65 years and over were higher than those for older women from 1970 to 2004. In 2004, the discharge rate for older men was 25.7 per 1,000, which is 30 percent greater than the rate for older women (Figure 5). This difference is consistent with the higher influenza and pneumonia death rates reported for men.
First-listed diagnosis
The first-listed diagnosis is usually the main reason for the hospitalization and is the principal diagnosis on the face sheet or discharge summary of the medical record of the hospital patient. If no principal diagnosis is specified, the first diagnosis listed on the face sheet or discharge summary of the medical record is used. Since 1979, diagnoses and procedures in the hospital discharge records were coded using the International Classification of Diseases, Ninth Revision, Clinical Modification. From 1970 to 1978, the International Classification of Diseases Adapted for Use in the United States, Eighth Revision was used. For more about the ICD.
Health care expenditures for influenza and pneumonia
According to the Agency for Health Care Research and Quality, aggregated charges in 2000 to the Medicare program for hospital treatment of pneumonia were estimated to be over $10.1 billion; the Medicaid program paid for an additional $3.4 billion in hospital care for pneumonia that year. An average hospital stay for pneumonia care costs about $15,000 (9). In 2004, there were about 806,000 discharges among persons aged 65 years and over for pneumonia (including pneumonia with influenza) as a first-listed diagnosis, according to the National Hospital Discharge Survey.
Influenza and Pneumococcal Vaccination
Influenza vaccines can prevent illness from influenza in some persons aged 65 years and over. Although the influenza vaccine is not fully protective among the older population, it lessens the severity of illness, prevents complications, and reduces the risk of hospitalization and death (10). High rates of influenza vaccination of nursing home residents and staff prevent influenza outbreaks in nursing homes (11). The influenza vaccine is recommended to be given annually because influenza viruses change from year to year (influenza). The vaccine given in a particular year is protective only against the strain of influenza for that season.
Pneumococcal pneumonia is the most common clinical presentation of pneumococcal disease among adults. The pneumococcal vaccine prevents invasive pneumococcal disease (i.e., bateremia and meningitis) and is routinely recommended for adults 65 years of age and over. The pneumococcal vaccine is good for preventing severe disease, especially hospitalization and death from pneumococcal disease (click here to learn more about pneumococcal vaccine)
National and state vaccination rates
Influenza and pneumococcal vaccinations are recommended for all persons aged 65 years and over. In 2006, 64 percent of this population had received an influenza vaccination in the past year, and 57 percent had ever received a pneumococcal vaccination (12).
Survey estimates of influenza vaccination rates within the past year vary significantly by state, ranging from 76 percent of the noninstitutionalized population in Colorado and Minnesota to 57 percent in the District of Columbia and Nevada (Table 4). The percentage of persons aged 65 years and over who were ever vaccinated against pneumococcal disease ranges from 71 percent in Colorado, Oregon, Montana, and Wyoming to 52 percent in the District of Columbia (Table 5).
Multiyear annual average estimate
Some estimates presented in this report are based on annual averages of 2 or more years of survey data. Multiyear annual averages are used to improve the reliability of estimates by increasing the sample size on which estimates are based. For example, in Table 4, the 2004-2006 age-adjusted percentage of persons aged 65 years and over with influenza vaccination in the past 12 months in Colorado (76.5 percent) estimates influenza vaccination in the past 12 months for persons interviewed during the 3-year period from 2004-2006.
Nursing home vaccination rates
Despite their increased susceptibility to influenza and pneumonia, not all residents of nursing homes receive pneumococcal and influenza vaccinations. Medicare has fully covered immunization costs for influenza since 1993 and for pneumococcal since 1981 (13). In 2004, only 63.7 percent of residents had received the influenza vaccine in the previous year and only 46.4 percent had ever received the pneumococcal vaccine, according to the National Nursing Home Survey (14).
Trends in influenza and pneumococcal vaccination
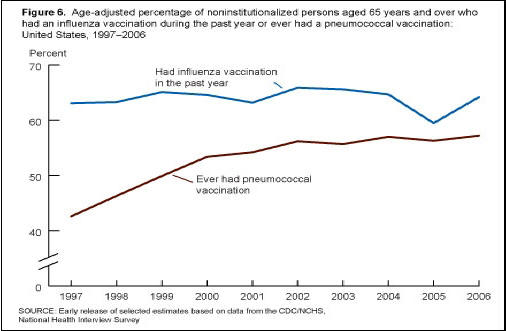
From 1997 to 2006, the age-adjusted percentage of noninstitutionalized persons aged 65 years and over receiving the influenza vaccination fluctuated between 60 percent and 67 percent. The age-adjusted percentage of this age group who had ever had pneumococcal vaccination increased from 43 percent in 1997 to 57 percent in 2006 (Figure 6).
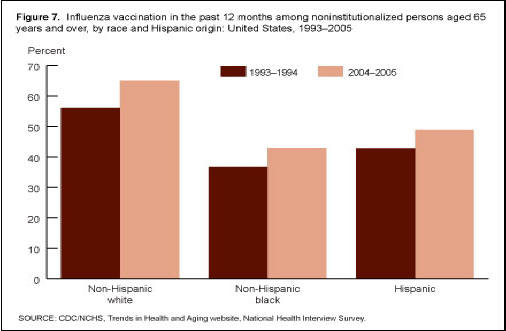
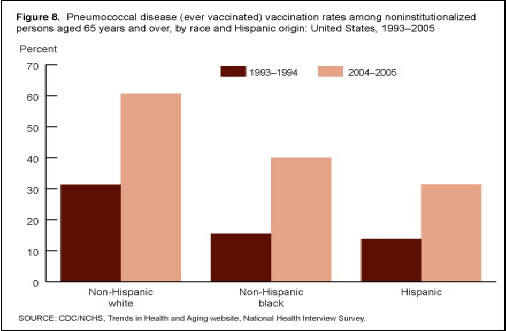
Between 1993-1994 and 2004-2005, the rates of vaccination among older persons aged 65 years and over increased significantly for all major race and Hispanic origin groups. However, in 2004-2005, older Hispanic and non-Hispanic black persons were less likely than older non-Hispanic white persons to report being vaccinated against influenza and pneumococcal disease (Figures 7 and 8).
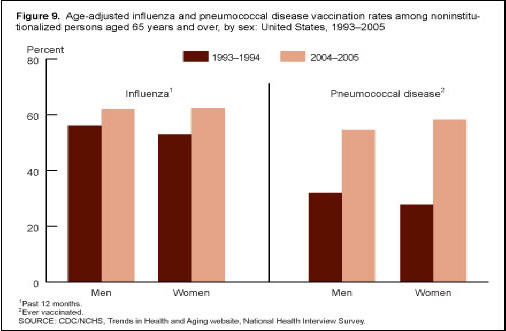
Since 1993-1994, the percentage of the population vaccinated for influenza and pneumococcal disease has increased for both men and women (Figure 9).
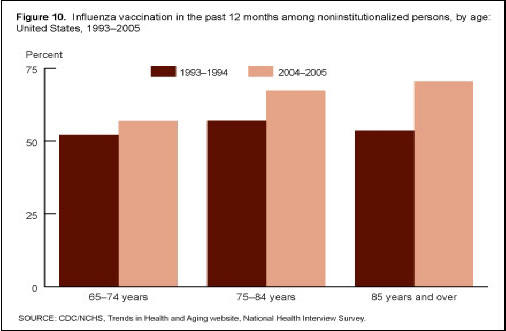
In the last decade, the percentage of the population vaccinated for influenza in the past 12 months and the percentage of the population ever vaccinated for pneumococcal disease increased for all older age groups: 65-74 years of age, 75-84 years of age, and 85 years of age and over (Figures 10 and 11).
The Healthy People 2010 objective is for 90 percent of persons aged 65 years and over to have received influenza and pneumococcal vaccination coverage (15).
About Data
Unless otherwise noted, data from this report came from initiatives and surveys conducted by the Centers for Disease Control and Prevention's (CDC) National Center for Health Statistics (NCHS) and the Behavior Risk Factor Surveillance System (BRFSS) conducted by CDC. Much of the data was taken from the Trends in Health and Aging website, which utilizes a variety of data sources. For this report, information originated from the National Vital Statistics System, the National Hospital Discharge Survey, the National Nursing Home Survey, the National Health Interview Survey, BRFSS, and the "Early Release of Selected Estimates Based on Data From the 2006 National Health Interview Survey" (12). Information from NCHS publications including Health, United States, 2006 (16), Older Americans Update 2006 (17), and Healthy People 2010 (15) are also used in this report. Finally, the Beyond 20/20 browser and statistical tests (18) were used to manipulate data and determine statistical significance.
References
1. Nichol KL, Wuorenma J, von Sternberg T. Benefits of influenza vaccination for low-, intermediate-, and high-risk senior citizens. Arch Intern Med 158(16):1769-76. 1998.
2. National Center for Health Statistics, National Vital Statistics System. Leading causes of death 1900-1998 [online]. Available from: http://www.cdc.gov/nchs/data/dvs/lead1900_98.pdf.
3. McCullers JA. Insights into the interaction between influenza virus and pneumococcus. Clin Microbiol Rev 19(3):571-82. 2006.
4. Anderson RN, Miniño AM, Hoyert DL, Rosenberg HM. Comparability of cause of death between ICD-9 and ICD-10: Preliminary estimates. National vital statistics reports; vol 49 no 2. Hyattsville, MD: National Center for Health Statistics. 2001.
5. Rosenberg HM, Maurer JD, Sorlie PD, Johnson NJ, et al. Quality of death rates by race and Hispanic origin: A summary of current research, 1999. National Center for Health Statistics. Vital Health Stat 2(128). 1999.
6. Haas JS, Dean ML, Hung Y, Rennie DJ. Differences in mortality among patients with community-acquired pneumonia in California by ethnicity and hospital characteristics. Am J Med 114(8):660-4. 2003.
7. Polanczyk CA, et al. Ten-year trends in hospital care for congestive heart failure. Arch Intern Med 160:325-32. 2000.
8. The Medicare Payment Advisory Commission (MedPAC). Report to the Congress: Medicare Payment Policy (March 2005), Section A. Hospital inpatient and outpatient services. Available from: http://www.medpac.gov/publications/congressional_reports/Mar05_Ch02a.pdf 2005.
9. Agency for Healthcare Research and Quality. Health care costs: Fact sheet. AHRQ Publication No. 02-P033. Rockville, MD: Agency for Healthcare Research and Quality. Available from: http://www.ahrq.gov/news/costsfact.htm 2002.
10. Nichol KL, et al. Effectiveness of influenza vaccine in the community-dwelling elderly. N Engl J Med 357:1373-81. 2007.
11. Shugarman LR, et al. The influence of staff and resident immunization rates on influenza-like illness outbreaks in nursing homes. J Am Med Dir Assoc 7(9):562-7. 2006.
12. National Center for Health Statistics. Early release of selected estimates based on data from the 2006 National Health Interview Survey [online]. Available from: http://www.cdc.gov/nchs/about/major/nhis/released200706.htm 2007.
13. Center for Medicare and Medicaid Services. Medicare Preventive Services. Adult immunization [online]. Available from: http://www.cms.hhs.gov/AdultImmunizations/2007.
14. National Center for Health Statistics. The National Nursing Home Survey [online]. Available from: http://www.cdc.gov/nchs/nnhs.htm 2007.
15. National Center for Health Statistics. Healthy People 2010 [online]. Available from: http://www.healthypeople.gov/Document/HTML/Volume1/14Immunization.htm 2000.
16. National Center for Health Statistics. Health, United States, 2006 [online]. Available from: http://www.cdc.gov/nchs/hus.htm 2006.
17. Federal Interagency Forum on Aging-Related Statistics. Older Americans Update 2006: Key indicators of well-being [online]. Available from: http://www.agingstats.gov/.htm 2006.
18. National Center for Health Statistics. Statistical tests [online]. Available from: http://www.cdc.gov/nchs/about/otheract/aging/stu.htm 2007.
Figures


Tables
SOURCE: CDC/NCHS, Trends in Health and Aging website, National Vital Statistics System.
1998 |
1999 |
2000 |
2001 |
2002 |
2003 |
2004 | |
|---|---|---|---|---|---|---|---|
Influenza and pneumonia
death rates1
|
247
|
167 |
167
|
155
|
161
|
155
|
139 |
1Per 100,000.
NOTE: The year 1998 was the final year of the International Classification of Diseases, Ninth Revision coding for influenza and pneumonia.
SOURCE: CDC/NCHS, Trends in Health and Aging website, National Vital Statistics System.
SOURCE: CDC/NCHS, Trends in Health and Aging website, National Vital Statistics System.
1Estimate is based on 2005-2006 data.
SOURCE: CDC/NCHS, Trends in Health and Aging website, Behavioral Risk Factor Surveillance System.
1Estimate is based on 2005-2006 data.
SOURCE: CDC/NCHS, Trends in Health and Aging website, Behavioral Risk Factor Surveillance System.
Page Last Modified: November 20, 2008
Content Source: CDC: National Center for Health Statistics
National Center for Health
Statistics
3311 Toledo Road
Hyattsville, MD 20782
Phone:
1-800-232-4636
nchsquery@cdc.gov
Centers for Disease Control and Prevention, 1600 Clifton Rd, Atlanta, GA 30333, U.S.A
Tel: (404) 639-3311 / Public Inquiries: (404) 639-3534 / (800) 311-3435