Appendix
B. Methodological and Technical Notes
A. County Definitions
Data from a number of different sources were used
in the generation of this report. We used the Federal Information Processing
Standard (FIPS) codes to link county definitions across datasets. For some
data, modifications mere made to county definitions in order to achieve comparability.
The standard definitions used were those in the Area Resource File (ARF).
In part this definition was used to enable the utilization of the ARF's contiguity
matrix when spatially smoothing death rates.
Modifications were limited to collapsing data from
various independent cities in several states ( Virignia,
Missouri), into surrounding counties in addition to reclassification
for several U.S. counties that no longer exist. For details
regarding the county definitions, refer to the Area Resource File User Documentation.
B. Data Sources
1.) Mortality Data
Death certificate data for the years 1985-1997 were obtained through the
National Vital Statistics System maintained by the National Center for Health Statistics. For
each cause-of-death used in this analysis, the underlying cause of death listed
on the death certificate was utilized. All causes of death were coded to according
to the International Classification of Disease–9th Revision (ICD-9).
For each decedent, underlying cause of death, age, race/ethnicity, gender,
and county of residence at the time of death were abstracted from computerized
death certificate data.
Rates for infant mortality were taken directly from the Area Resource File
(see below under Medical Care Resources).
2.) Hospitalization Data
Inpatient hospitalization for the year 2000 were obtained for 10 Appalachian
States through the Health Care Cost and Utilization Project (HCUP), sponsor
by the Agency for healthcare Research and Quality (AHRQ). This study used
the HCUP State Inpatient Datasets (SID), which consist of individual data
files from data organizations in 29 participating states. They are composed
of annual, state-specific files that share a common structure and many common
data elements, which represent the universe of inpatient discharge abstracts
in participating states. The data are provided for all patients regardless
of the payer, including persons covered by Medicare, Medicaid, private insurance,
and the uninsured. No personal information is provided, nor is it possible
to distinguish hospitalizations the may have been incurred by the same individual.
SID data for 6 of the ten Appalachian states used in this analysis (New York,
Maryland, West Virginia, Kentucky, North Carolina, South Carolina, were obtained
from the HCUP Central Distributor. Comparable data for the remaining 4 state
( Georgia , Tennessee,
Pennsylvania, and Virginia)
were obtained through hospital organizations in each respective state.
Data elements retained for analysis in this study included principal diagnoses
at discharge, age, gender, and either the county for ZIP code area of residence.
For some states ZIP codes were used to identify the patients area of residence
as opposed to the county. In these cases ZIP codes were collapsed into their
respective county. The file used to collapse ZIP codes into counties was provided
by the Appalachian Regional Commission. Because ZIP code areas often cross
county boundaries, the county that comprised the largest portion of the ZIP
code area was used to define the county of residence.
3. Socioeconomic and Population Data
Demographic and socioeconomic data for all U.S. counties were
obtained from the 1990 and 2000 decennial censuses. Population count data
for all U.S.
counties were obtained through the Bureau of Census for the years 1985-1997.
These intercensal estimates were calculated by the Bureau of Census through
extrapolation of linear trends in population growth and inter-county migration
patterns between census years.
4. Behavioral Risk Factor Data
Data on behavioral risks was obtained from the Behavioral Risk Factor Surveillance
System for the years 1993-1997. The BRFSS is a telephone survey administered
each year by state health departments across the country and is designed to
"collect uniform, state-specific data on preventive health practices and risk
behaviors that are linked to chronic disease, injuries, and preventable infectious
disease" . Although the BRFSS began in 1984, county identifiers were not universally
provided until 1993. Therefore, sub-state areas cannot be analyzed using data
prior to 1993. Beginning the 1998, county of residence for respondents is
not publicly released for counties which have fewer than 50 respondents. The
target population for the BRFSS survey is the adult (aged 18 and older) non-institutionalized
population of each state. A two-stage random-digit telephone sampling protocol
is used to contact households, and a third stage randomly selects a single
eligible adult from within each sampled household. The median response rate
for participating states was 70.4% in 1992. The format and content of specific
questions in the BRFSS surveys replicate questions asked in the National Health
Interview Survey and the National Health and Nutrition Examination Surveys
whenever possible.
5.) Medical Care Resource Data
Medical care resource data were obtained from the Area Resource File
(February 2001 release). The Area Resource File (ARF) represents a compilation
of health-related data abstracted from multiple data sources by the National Center for Health Workforce Information & Analysis,
Bureau of Health Professions, Health Resources and Services Administration,
and the Department of Health and Human Services .
A. Spatial Smoothing of Mortality Rates
1.) Spatial Smoothing Methods
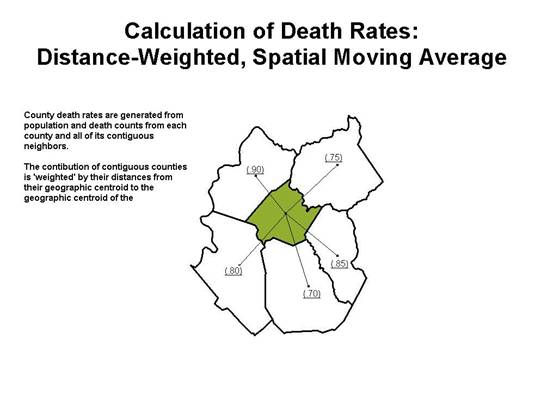
For each county, deaths (numerators) and population
counts (demonimators) for ten-year age groups (e.g.
35-44, 45-54, etc.) were summed for the eight-year
study period 1990-1997. County numerators and denominators
were then combined with death count numerators and
population count denominators for all neighbor counties
using a distance-weighted approach. Neighbors were
defined solely on the basis of contiguity. Distances
were calculated from the geographic centroid of each
county. These distances were then used to weight the
contrubution of each neighbor to the overall death
count numerators and population count denominators.
The schematic diagram below provides a graphic example
of the process.
This process produced spatially 'smoothed' age-specific death rates which
were then age-adjusted to the 2000 United States standard population for each
age group used in this study (35 to 64 and 65 and older). The process of spatially
smoothing death rates helps to minimize local variability that may result
from small populations. The spatial moving average used in this analysis was
adapted from a method used in two recent publications published by the Centers
for Disease Control and Prevention and West Virginia University: Heart
Disease in Women: An Atlas of Geographic Disparities and Heart Disease
in Men: An Atlas of Geographic Disparities. For this study we have added
the distance-weighted approach to partially deal with issues involving counties
of varying sizes and configurations.
A constraint was also applied to maximize the likelihood calculating stable
county death rates. For each demographic sub-group, a death rate was not calculated
for any county for which the total number of deaths in that county plus the
neighboring counties was fewer than 20 for the period 1990-1997.
A. Calculation of Hospitalization
Rates
For each county, hospitalizations (numerators) and population counts (demonimators)
for ten-year age groups (e.g. 35-44, 45-54, etc.) for the year 2000 were used
to generate age-specific hospitalization rates. Age-specific death rates were
then age-adjusted to the 2000 United States standard population for each age
group used in this study (35 to 64 and 65 and older).
A spatial smoother of the type used for mortality rates could not be used for
this analysis due to the lack of complete geographic coverage for hospitalization
data.
A constraint was also applied to maximize the likelihood
calculating stable county hospitalization rates. For each demographic sub-group,
a hospitalization rate was not calculated for any county for which the total
number of hospitalizations was fewer than 20 for the year 2000.
E. Mapping Procedures
All maps were generated in a manner which depicts less favorable conditions
in dark shades and more favorable conditions in lighter shades. For the maps
of death and hospitalization rates, the distribution of rates are represented
as quartiles with the addition of low and high outliers where they
are present. Outliers are counties that had statistically unusually low or
high rates relative to the majority of counties. Low outliers were identified
as counties with death rates lower than the 25th percentile minus
1.5 times the interquartile range (25th-75th percentile)
and high outliers were identified as counties with death rates higher then
the 75th percentile plus 1.5 times the interquartile range.
|