|
|
| |
|
|
|
|
|
|
|
|
|
|
|
| | |||||||||||
| |
|
|||||||||||
|
State
Estimates of Substance Use and Mental Health from the |
|
|

Tobacco is the second most commonly used substance in the United States next to alcohol. The National Survey on Drug Use and Health (NSDUH) includes a series of questions on the use of several tobacco products, including cigarettes, smokeless tobacco (chewing tobacco and snuff), cigars, and pipe tobacco. Using 2005 and 2006 NSDUH data, this chapter includes State estimates on past month use of tobacco, past month use of cigarettes, and the perceptions of risk of heavy use of cigarettes. Heavy use of cigarettes is defined as smoking one or more packs of cigarettes per day. Most tobacco users are cigarette smokers. However, differences in past month prevalence estimates for cigarettes and tobacco (around 4.5 percent nationally) represent persons who do not smoke cigarettes, but who use one of the other forms of tobacco (chewing tobacco, snuff, cigars, or pipe tobacco) (Table s B.13 and B.14). Nationally, both the percentage of tobacco use and the percentage of cigarette use in the past month were unchanged between 2004-2005 and 2005-2006 for the total population aged 12 or older (Table s C.13 and C.14). However, there were significant declines for both measures among youths aged 12 to 17 (from 13.8 to 13.0 percent for past month tobacco use; from 11.3 to 10.6 percent for past month cigarette use).
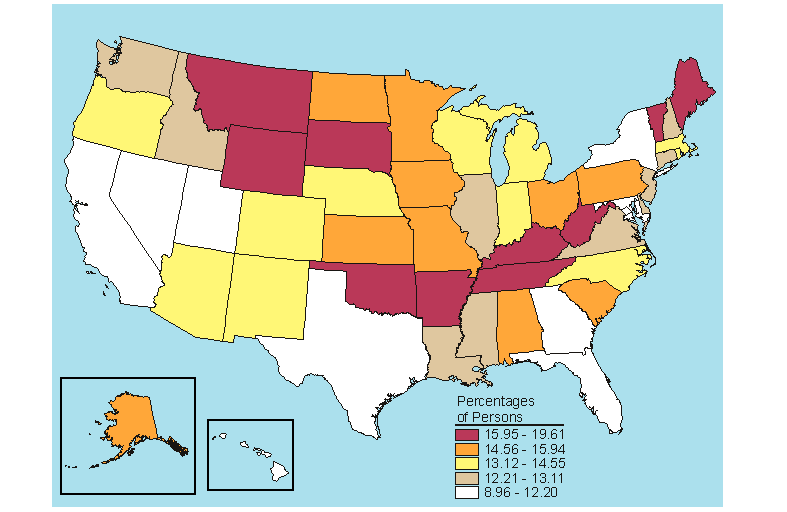
Nationally among persons aged 12 or older, the rate for past month use of tobacco in 2005-2006 was 29.5 percent (Table B.13). The State with the highest prevalence rate for tobacco use among persons aged 12 or older was West Virginia (40.6 percent). Utah had the lowest rate in the Nation for tobacco use among all persons aged 12 or older (22.1 percent). Arkansas, Kentucky, Tennessee, and West Virginia ranked in the highest fifth for all three age groups (12 to 17, 18 to 25, and 26 or older) and among all persons 12 or older (Figures 4.1 to 4.4).
Two States showed increases in past month tobacco use among persons 12 or older between 2004-2005 and 2005-2006: California (21.2 to 22.6 percent) and Oklahoma (33.7 to 36.9 percent) (Table C.13). Five States showed significant decreases in past month tobacco use among youths aged 12 to 17, contributing to the national decrease among youths: California, Connecticut, Missouri, North Carolina, and Wisconsin. Across the three age groups (12 to 17, 18 to 25, and 26 or older) and across all States, there were 10 significant changes in past month tobacco use between 2004-2005 and 2005-2006. Of those 10 changes, 3 were increases and 7 were decreases.
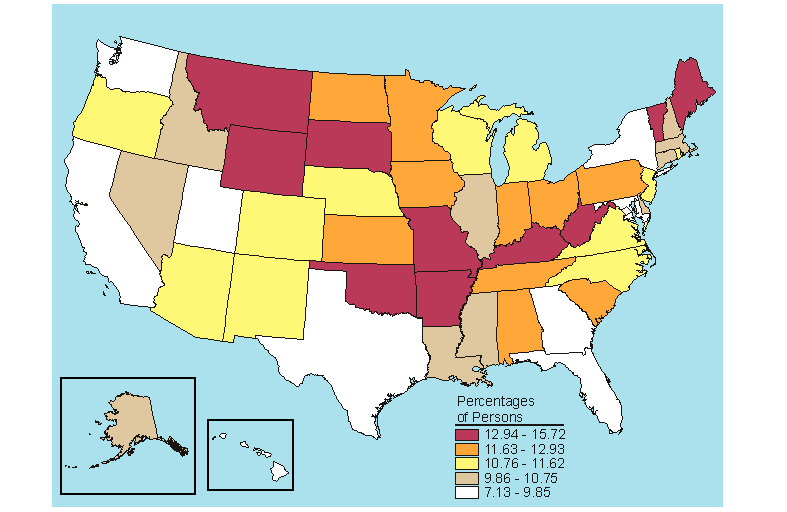
In 2005-2006, the national rate for past month use of cigarettes among persons aged 12 or older was 25.0 percent, which was similar to the national rate in 2004-2005 (24.9 percent) (Table C.14). Because cigarettes are the main tobacco product, States that ranked high for past month tobacco use also ranked high for past month cigarette use. In fact, 8 of the 10 States in the highest fifth for past month use of tobacco also were in the highest fifth for past month cigarette use among persons aged 12 or older (Figures 4.1 and 4.5). Similarly, 9 of the 10 States ranked in the lowest fifth were the same for both measures. As was the case for past month tobacco use, West Virginia had the highest rate of past month cigarette use in the Nation (32.5 percent), and Utah had the lowest rate (19.3 percent) for all persons aged 12 or older (Table B.14).
Although the national rate for past month use of cigarettes among persons aged 12 or older remained the same between 2004-2005 and 2005-2006, the rate of cigarette use in the 12 to 17 age group had a significant decline, from 11.3 to 10.6 percent (Table C.14). The national decrease in cigarette use among youths also was observed regionally in the Northeast (11.6 to 10.8 percent), Midwest (12.6 to 11.8 percent), and South (11.5 to 10.7 percent). Although there were a few declines in past month cigarette use among the other age groups, most of them occurred among youths aged 12 to 17. California, Connecticut, Missouri, New York, and North Carolina had significant decreases among youths. Across the three age groups (12 to 17, 18 to 25, and 26 or older) and across all States, there were four significant increases and eight significant decreases in cigarette use between 2004-2005 and 2005-2006.
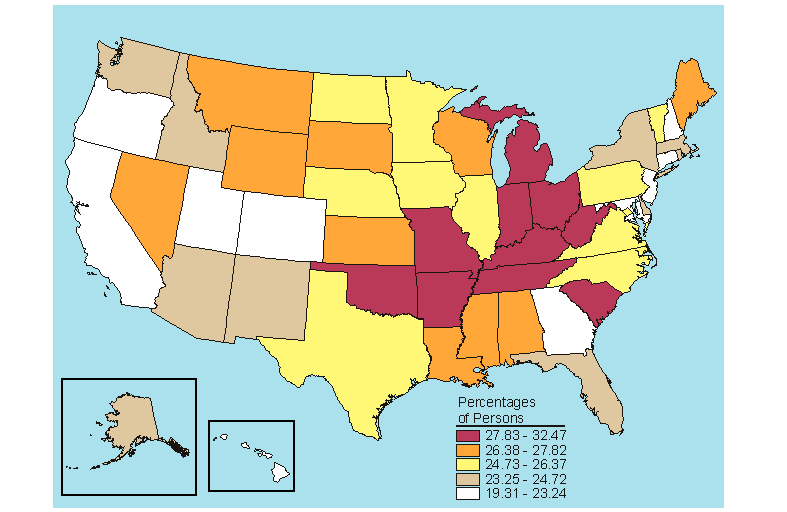
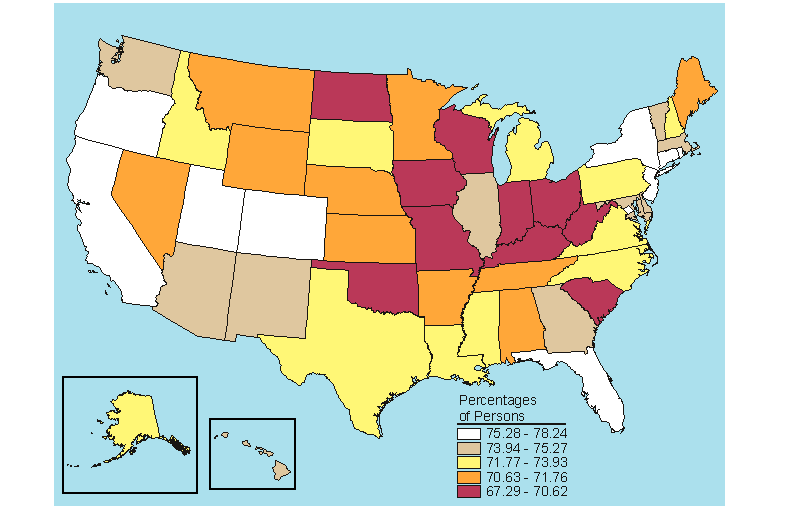
States with high prevalence rates for cigarette use tended to have low rates of perceived risk of heavy cigarette use (i.e., smoking one or more packs a day). Seven States (Indiana, Kentucky, Missouri, Ohio, Oklahoma, South Carolina, and West Virginia) that ranked in the lowest fifth for perceptions of great risk of smoking one or more packs of cigarettes a day also were ranked in the highest fifth for past month cigarette use among persons aged 12 or older (Figures 4.5 and 4.9). North Dakota had the lowest rate of perception of great risk for heavy cigarette use (67.3 percent), and Utah had the highest rate (78.2 percent) among persons aged 12 or older (Table B.15).
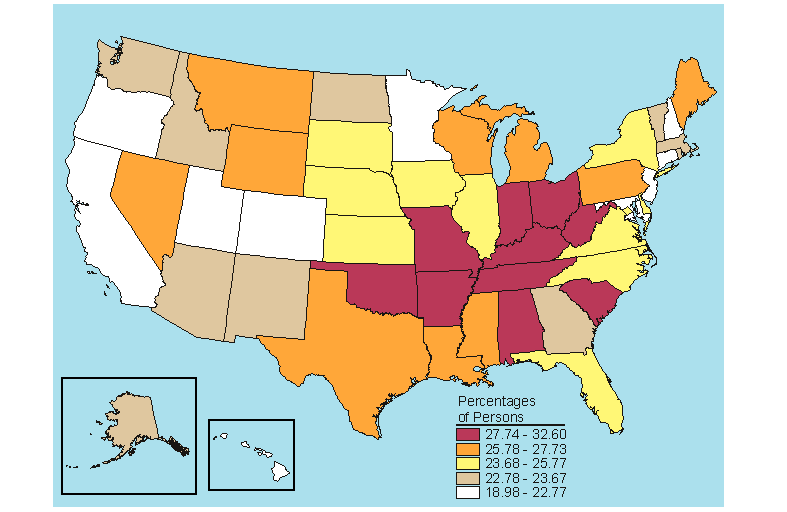
The rates of perception of great risk of smoking one or more packs of cigarettes a day remained almost the same from 74.4 percent in 2004-2005 to 74.1 percent in 2005-2006 among persons 12 or older (Table C.15). There were also no national changes in any of the three age groups. However, among youths aged 12 to 17 and young adults aged 18 to 25, there were significant increases in the perception of risk of smoking one or more packs of cigarettes a day in the Northeast. Those increases may have been fuelled by a significant increase in New York (among youths—from 68.3 to 70.6 percent) and an increase in New Jersey (among young adults—from 70.7 to 74.3 percent), respectively. There was one significant decrease in the perception of risk among persons 26 or older in Wisconsin (from 73.3 percent in 2004-2005 to 69.9 percent in 2005-2006).
Below is a map, click here for the text describing this map.

Source: SAMHSA, Office of Applied Studies, National Survey on Drug Use and Health, 2005 and 2006.
Below is a map, click here for the text describing this map.
Source: SAMHSA, Office of Applied Studies, National Survey on Drug Use and Health, 2005 and 2006.
Below is a map, click here for the text describing this map.

Source: SAMHSA, Office of Applied Studies, National Survey on Drug Use and Health, 2005 and 2006.
Below is a map, click here for the text describing this map.

Source: SAMHSA, Office of Applied Studies, National Survey on Drug Use and Health, 2005 and 2006.
Below is a map, click here for the text describing this map.
Source: SAMHSA, Office of Applied Studies, National Survey on Drug Use and Health, 2005 and 2006.
Below is a map, click here for the text describing this map.
Source: SAMHSA, Office of Applied Studies, National Survey on Drug Use and Health, 2005 and 2006.
Below is a map, click here for the text describing this map.

Source: SAMHSA, Office of Applied Studies, National Survey on Drug Use and Health, 2005 and 2006.
Below is a map, click here for the text describing this map.
Source: SAMHSA, Office of Applied Studies, National Survey on Drug Use and Health, 2005 and 2006.
Below is a map, click here for the text describing this map.
Source: SAMHSA, Office of Applied Studies, National Survey on Drug Use and Health, 2005 and 2006.
Below is a map, click here for the text describing this map.

Source: SAMHSA, Office of Applied Studies, National Survey on Drug Use and Health, 2005 and 2006.
Below is a map, click here for the text describing this map.

Source: SAMHSA, Office of Applied Studies, National Survey on Drug Use and Health, 2005 and 2006.
Below is a map, click here for the text describing this map.

Source: SAMHSA, Office of Applied Studies, National Survey on Drug Use and Health, 2005 and 2006.

|
This page was last updated on December 30, 2008. |
* Adobe™ PDF and MS Office™ formatted files require software viewer programs to properly read them.
Click here to download these FREE programs now
| Highlights | Topics | Data | Drugs | Pubs | Short Reports | Treatment | Help | OAS |
