IncidentNews Home >> Incident >> Entry
Tarballs 98
Bodega Bay, CA| Subject | Map - Trajectory |
|---|---|
| Posting Date | 1998-Jan-23 |
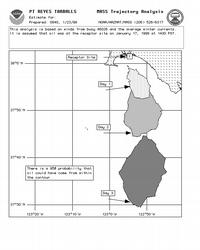
Analysis of trajectory and winds for mystery tarballs that came shore in Drake's Bay on
Jan. 17, 1998.  Attachments are bitmaps of OSSM receptor mode run, and a stick plot of the
winds from Jan. 14 through Jan. 17.  Below is the summarized hourly winds for the same
period.


----------HOURLY WIND SUMMARY --------------

NOAA BUOY 46026

LAT 37  45.0  LONG 122  49.2 :  Total number of data points =      89
WIND DIRECTION vs SPEED from raw station data


JAN 14, 1998 00:00 PST THROUGH JAN 17, 1998 18:00 PST

      |                                   SPEED (KNOTS)                            |
TOTAL|MEAN

16 PT.| 1 - 3| 4 - 6|  7-10| 11-16| 17-21| 22-27| 28-33| 34-40| 41-47| 48-55|
>=56|PERCNT|WIND

 DIR. |      |      |      |      |      |      |      |      |      |      |      |
|SPEED


    N    1.1     .0     .0     .0     .0     .0     .0     .0     .0     .0     .0    1.1
2.0

  NNE     .0     .0     .0     .0     .0     .0     .0     .0     .0     .0     .0     .0
.0

   NE     .0     .0     .0     .0     .0     .0     .0     .0     .0     .0     .0     .0
.0

  ENE     .0     .0     .0     .0     .0     .0     .0     .0     .0     .0     .0     .0
.0

    E     .0     .0     .0     .0     .0     .0     .0     .0     .0     .0     .0     .0
.0

  ESE     .0     .0     .0     .0     .0     .0     .0     .0     .0     .0     .0     .0
.0

   SE     .0     .0     .0     .0    1.1     .0     .0     .0     .0     .0     .0    1.1
18.0

  SSE     .0    1.1    1.1    6.7    9.0   11.2     .0     .0     .0     .0     .0   29.2
18.8

    S     .0    7.9   11.2   10.1     .0     .0     .0     .0     .0     .0     .0   29.2
9.7

  SSW    1.1    1.1    3.4    3.4     .0     .0     .0     .0     .0     .0     .0    9.0
8.5

   SW     .0     .0    1.1    5.6    2.2     .0     .0     .0     .0     .0     .0    9.0
14.8

  WSW     .0    2.2    1.1    2.2    3.4     .0     .0     .0     .0     .0     .0    9.0
12.7

    W     .0    1.1    2.2    2.2     .0     .0     .0     .0     .0     .0     .0    5.6
10.8

  WNW     .0    3.4     .0     .0     .0     .0     .0     .0     .0     .0     .0    3.4
4.7

   NW    1.1    1.1     .0     .0     .0     .0     .0     .0     .0     .0     .0    2.2
3.0

  NNW     .0    1.1     .0     .0     .0     .0     .0     .0     .0     .0     .0    1.1
6.0

  VAR      0      0      0      0      0      0      0      0      0      0      0      0
0

  CLM      0      0      0      0      0      0      0      0      0      0      0     .0
0

  ALL    3.4   19.1   20.2   30.3   15.7   11.2     .0     .0     .0     .0     .0  100.0
12.7
Attachment:

 This page is maintained by the