Comparing Fahrenheit and Celsius Temperatures
Wednesday, October 22nd, 2008I try to write this blog to inform, rather than to express opinion, but I have to admit that I love the metric system. Perhaps it’s because I still remember how hard it was to learn how to convert things from one set of units to another in the British system we still follow here in the United States. Ounces to pounds, feet to yards to rods, square feet to square yards to acres. And so on. While in the metric system, it’s often simply a question of multiplying or dividing by 10, 100, and so on.
So, when my children were little, I taught them to think in metric, at least for some units. I succeeded with centimeters and inches, but kilometers and miles were harder, and temperature was the hardest of all. So today I’m writing about temperature.
In using the two sets of units, it’s useful to have some mileposts (kilometer-posts?). For example:
- 0 degrees Celsius (or 32 degrees Fahrenheit), the temperature at which water freezes
and
- 100 degrees Celsius (or 212 degrees Fahrenheit), the temperature at which water boils at sea-level pressure (about 1013 millibars).
But there are some other “kilometer-posts:”
- – 40 degrees Celsius, where Fahrenheit and Celsius degrees are the same
And human body temperature:
- 37 degrees Celsius or around 98.6 degrees Fahrenheit.
And “comfortable” room temperature:
- 20 degrees Celsius or 68 degrees Fahrenheit
And, my favorite one:
- 10 degrees Celsius (or 50 degrees Fahrenheit), above which insects become active.
Since this my favorite milepost and this might not be familiar to you, I’ll fill you in on some details.
When I did my cricket blog, I couldn’t get any data points below about 10 degrees Celsius, because the crickets weren’t chirping. You can see this from the graph in Figure 1. Well, that’s not quite true. The thermometer temperature showed below 10 degrees Celsius when I heard crickets once, but the cricket was “reporting” a temperature above 10 degrees Celsius with his chirps. Not really surprising — the temperature varies a lot from place to place at night, when you hear crickets chirp. In fact, before dawn on 6 October 2008 I heard a cricket when the thermometer temperature measured 46 degrees Fahrenheit (~8 degrees Celsius), but I didn’t count the chirps.
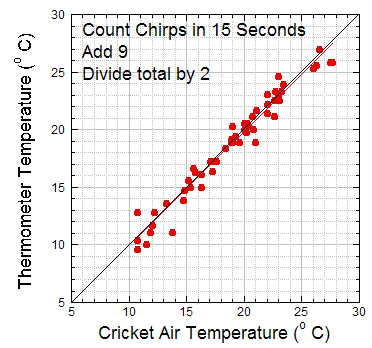
Figure 1. Using Crickets to estimate temperature. Notice the lack of data for temperature below 10 degrees Celsius. From cricket blog at http://www.globe.gov.
I knew about this temperature cut-off before observing crickets, from radar meteorologists. They see strong “clear-air” echoes when insects are flying. Figure 2 shows an example of insect echoes from a downward-looking radar used for research. The radar was mounted on a King-Air aircraft operated by the University of Wyoming. The data were collected while flying along a north-south track. So this is a north-south “picture” of insect plumes. It was 29 May 2002, and the air was quite warm — with temperatures well above 10 degrees Celsius.
Figure 2. Wyoming Cloud Radar image of “insect plumes” rising from the ground. 29 May 2002, on a north-south track over the Oklahoma panhandle (about 106 degrees West longitude). AGL means “above ground level.” Figure from Dr. Bart Geerts at the University of Wyoming.
Dr. Bart Geerts and his then graduate student Dr. Qun Miao found that the air was moving upward in the red and orange insect plumes, and that the air was moving down between them. They could see this because there were instruments on the King Air measuring the up-and-down air movement. I could feel the motion while I was on the plane: the airplane would get carried up when we crossed the “red” areas, and down in between. It was very “bumpy” where there were a lot of insect plumes.
You might think that the insects should be everywhere — after all, wouldn’t the insects be carried up by the upward-moving air and then back downward by the air between? Geerts and Miao found that the insects fly down in the updrafts, working hard to stay near the ground. This keeps the insects mainly in the rising air. Geerts and Miao even found that they could “measure” the updrafts and downdrafts by the radar alone by subtracting out the insect speed.
Here is another example of insect echoes, taken from weather radar in the southeast United States. The west-northwest to east-southeast-oriented light and darker blue patches are probably the “clear-air” (insect) echoes or small clouds; the yellows and reds are probably small rain showers.
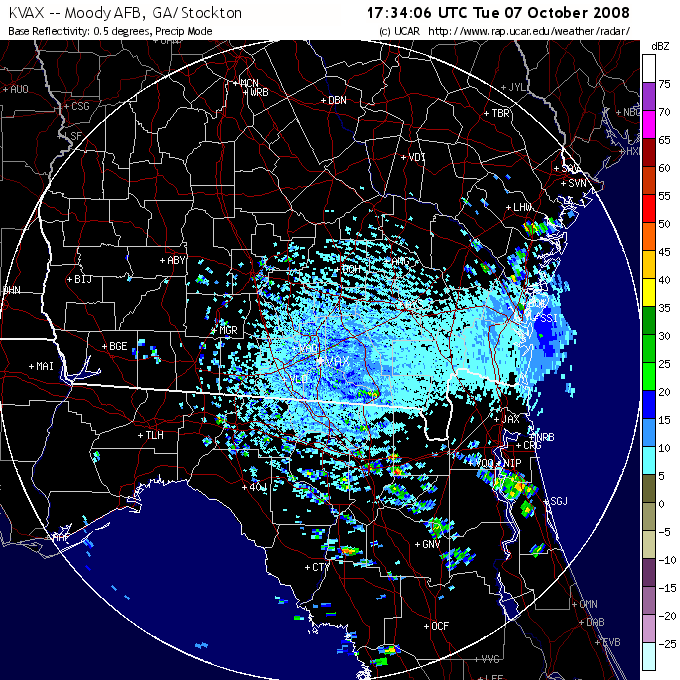
Figure 3. Fair-weather echoes over southeast Georgia and Northern Florida in the SW United States.
Let’s summarize all these data in a table and a plot. First, the data. Plot this yourself, and see if you can think of any more “mileposts.” Or do some research to find some interesting temperatures, like the record high or record low temperature where you live. Or look at the FLEXE web site to see how hot it is near hydrothermal vents at the bottom of the ocean. You can use the graph to convert to the other units, or use the formula to convert back and forth (at the end of this blog).
Temperatures in Celsius and Fahrenheit
| Degrees Fahrenheit |
Degrees Celsius |
Comments |
|---|---|---|
| -40.0 | -40.0 | Temperatures the same |
| 32.0 | 0.0 | Freezing point of water |
| 50.0 | 10.0 | Insects become active |
| 68.0 | 20.0 | Room temperature |
| 98.6 | 37.0 | Healthy human temperature measured by mouth |
| 212.0 | 100.0 | Boiling temperature for water at sea level pressure |
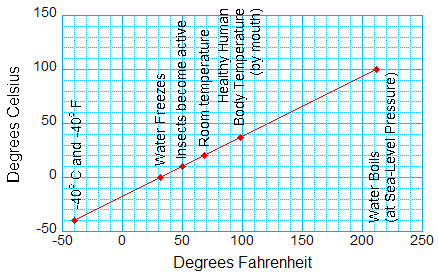
Figure 4. “Milestone” temperatures, in Fahrenheit and Celsius.
Methods of converting
You can use the table to make sure you are doing it right.
To convert Fahrenheit to Celsius:
Subtract 32 (notice you are subtracting Fahrenheit from Fahrenheit)
Then multiply by 5/9.
Or, if you prefer a formula, C = (F-32) x 5/9, where F is the Fahrenheit temperature and C is the Celsius temperature.
To convert Celsius to Fahrenheit:
Multiply by 1.8
Add 32
Or, in a formula: F = 1.8C + 32