Archive for October, 2007

Looking at the fall colors in a different way

Thursday, October 18th, 2007

[This blog reflects the help of many friends and colleagues. The story of how it developed shows how science research often works. The idea for this blog came from Professor Peter Blanken of the University of Colorado, who took advantage of a beautiful autumn day to take his biometeorology class outside so that the students could measure and compare the temperatures of yellow leaves and green leaves. I found out about Professor Blanken’s field trip from Joe Alfieri. Joe, a graduate student from Purdue University, was visiting me for a few weeks. Joe and I decided to have our own field trip, using the infrared thermometers we used to measure puddle temperatures. When Joe and I told a colleague here at NCAR, Jielun Sun, what we were doing, she suggested we borrow an infrared digital imager from Janice Coen, an NCAR scientist who uses it to look at forest fires. Sean Burns of NCAR and Jielun showed us how to use the camera. Joe processed the images and produced the figures. They are all gratefully acknowledged.]

What happens to leaves when they change color? Leaves are green because of chlorophyll, which is involved in photosynthesis. In photosynthesis, sunlight, carbon dioxide, and water are turned into glucose, which is used by the plant. In the autumn, as the days get shorter, photosynthesis stops and the chlorophyll disappears, leaving behind other materials that give the leaves their color.

As noted in a previous blog, shutting down of photosynthesis in the Northern Hemisphere autumn actually shows up as an increase in the carbon dioxide in our atmosphere (Remember – there is more land – and trees – in the Northern Hemisphere). GLOBE’s Seasons and Biomes Project and Carbon Cycle Project (found under the “Projects” drop-down menu at www.globe.gov) are both interested in the seasons and how they affect the earth system.

Green leaves also give off water vapor in a process called transpiration, which is a fancy name for evaporation from plants (mostly from leaves). When leaves open their “pores” (stomata) to allow carbon dioxide to enter for photosynthesis, water evaporates. Yellow leaves don’t transpire. Does this mean that the temperatures of green leaves and yellow leaves are different?

Blanken thought that the color of the leaves would affect their temperature. Joe Alfieri and I thought so too. But how much? We decided to go outside and measure leaf temperatures ourselves.

We still had the infrared temperature sensor from when we measured puddles. We used the sensors to measure leaf temperature. We found trees near the office with both yellow and green leaves, and measured the temperatures of individual leaves. We measured leaves in pairs – one yellow leaf and one green leaf for each tree. We measured leaves on “weeds” as well.

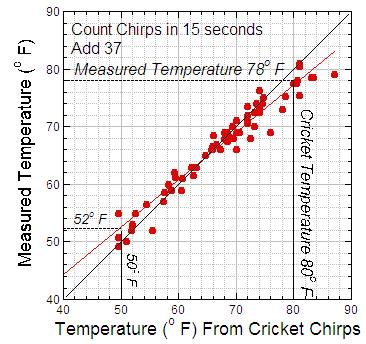
The GLOBE infrared thermometer wasn’t working, so we used another one. (More information on the GLOBE infrared temperature (”surface temperature“) protocol can be found at www.globe.gov in the “Teachers Guide”, in the drop-down menu for “Teachers”). We had compared it to the GLOBE instrument earlier and found the temperatures were off – but the temperature differences were the same for both instruments. So I will discuss temperature differences rather than actual temperatures. From the weather station at our building, the temperatures on all three days were between 20 and 25 degrees Celsius. We took data for red and brown leaves as well, but there were so few I am including only the yellow and green ones. Measurements were made during the last two weeks of September.

The first day, it was sunny. We knew that leaves in full sunlight would be warmer than leaves in shadow, so we tried to compare leaves that were either both in shade, or both in full sunlight. On this day, the yellow leaves were on average 1.6 Celsius degrees warmer than the green ones.

The second day was mostly cloudy with low clouds blocking the sun, making it easier to get leaves exposed to a similar amount of sunlight. On this day, the yellows were on average 1.2 Celsius degrees warmer than the green ones.

The third day was cool and windy. We found we had to hold the end of a leaf to measure it. Otherwise, the leaf would blow around and we couldn’t get a good reading. The yellow leaves were on average 1.3 Celsius degrees warmer than the green ones.

The measurements varied a lot for all three days. Differences varied from -0.2 Celsius degrees (green leaf warmer) to 7 Celsius degrees. Part of the reason for this variation is that some of the leaves were more shaded than others. Also, leaves directly facing the sun tend to be warmer. (If a leaf is oriented so its edge faces the sun, it will be cooler. I had a friend who really really liked to sunbathe. He found out that he could stay outside in cooler temperatures by tilting himself so that his body was directly facing the sun). Wind might make the temperature differences smaller. In spite of these factors, the yellow leaves were between 1 and 2 Celsius degrees warmer than the green ones.

The figures below show the same leaves photographed with an ordinary digital camera and an infrared camera (more properly, infrared imager) that scientists use to measure the temperatures of fires, trees, and surfaces. In the figures, the blue colors mean cooler temperatures than the yellow ones, which are cooler than the reds. Like our measurements, the infrared camera is “seeingâ€? yellow leaves as warmer as well. Notice that the stems are warmer, too, especially the thicker ones. We didn’t calibrate the camera exactly, but estimate the temperature difference between the yellow and green leaves to be about the same as we observed.

Poplar leaves photographed using a digital camera

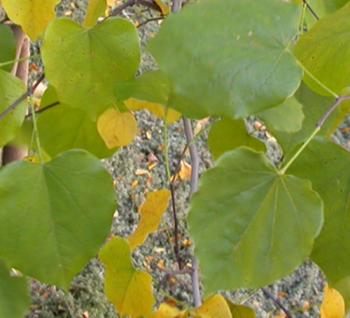
Figure 1. Poplar leaves photographed using a digital camera.

Same leaves, photographed using the infrared imager

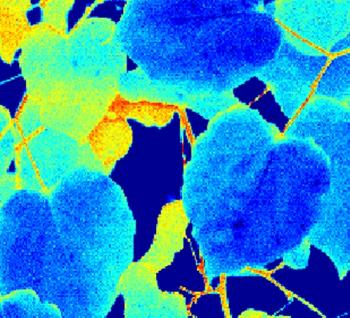
Figure 2. Same leaves, photographed using the infrared imager.

Why are the yellow leaves warmer? Remember that leaves lose water during transpiration. This means that the water turns from a liquid to a gas – it evaporates. Just as perspiration evaporating from our bodies keeps us cool, the water escaping from the leaf cools it off a little bit. It takes energy for molecules to escape a liquid to become part of a gas – and this energy loss is what cools the leaf. The same thing happens to you getting out of a swimming pool or shower – you are cooled off as the water on your skin evaporates.

POSTSCRIPT. If the leaves are cooler because of transpiration from open stomata, Sun hypothesized that yellow and green leaves should have the same temperature in the early morning, before the stomata open up. To test this, Blanken took leaf-temperature measurements at 7 a.m. Local Standard Time, 50 minutes after sunrise (6:10 a.m. Local Standard Time), on 15 October 2007, when the temperature was 4.5 Celsius degrees, relative humidity ~90+%. He found that the yellow leaves and the green leaves had about the same temperatures. This could be because the stomata are closed. However, the low temperature and high relative humidity that morning would reduce the evaporation rate, so even if the stomata were open, the leaf-temperature differences would still be small. In either case, the lack of temperature difference is related to little or no evaporation.

Measuring temperature using crickets

Friday, October 5th, 2007

Did you know that you could count cricket chirps to estimate temperature? I heard this a number of years ago, but never thought much about it until I heard it mentioned on television this summer. Was this true, or just an urban myth? I decided to go outside and see for myself. Starting in August, I started listening to crickets. I estimated the “cricket temperature” from the first formula I found on the Web:

Cricket temperature in degrees Fahrenheit = number of chirps in 15 seconds + 37.

I measured the actual temperature by taking the average from two thermometers. One is mounted on the house at about eye level (1.5 m) beneath the overhang where we park our car. The second lies on the table on our deck, at about 1.5 m above the ground. A louvered sun-roof on the deck keeps the thermometer from cooling too much. In both places, there is enough wind for ventilation. But I had to ignore the house-mounted thermometer if our car was warm (i.e., recently driven). Though I did not have a GLOBE instrument shelter, the height matches that for the GLOBE air temperature protocol.

It took me a week or two to figure out how to count cricket chirps. 15 seconds was too short a time — I kept ending up with numbers like 30-and-a-half chirps. Or I would lose track or start too early or too late. So I tried 30 seconds. That way if I was between 60 and 61 chirps, the resulting error would be divided by two.

Then I discovered that the crickets didn’t always chirp together (CHIRP CHIRP CHIRP) but sometimes got out of synch (chir-rurp chir-rurp chir-rurp). In this case, I would count the chirps when they were in unison, and try to maintain the beat until they got back in unison again. To make things more accurate, I’d count chirps for five 30-second periods, average the number, and then divide the average by two. If there were two sets of crickets that weren’t always chirping at the same time (say an “alto” group and a “soprano” group), I’d count the alto chirps for one 30-second period and then count the soprano chirps for the next 30-second period.

I ended up with a lot of data for temperatures above 70 degrees. But getting numbers at the cooler temperatures was harder.

Since temperatures are the coolest around sunrise, I had to start getting up around 2:00-3:00 a.m. and 5:00 a.m. to get data for the cooler temperatures.
How well did the formula work? You can see from the first graph, in Figure 1. If everything (the formula, my counting, the thermometers) worked perfectly, all the red dots would fall on the black line. That is — along the black line the “cricket temperature” is equal to the measured air temperature.

Air temperature measured from cricket chirps

Figure 1. Air temperature measured from cricket chirps. For this graph, the number of chirps during 15 seconds is added to 37 to get the air temperature. The highlighted temperature readings are for the red “best-fit” line.

In the graph, the data are close to the black line, but not always on it. The red line is the straight line that best fits the data. Notice that the red line drops below the black line for high temperatures. Thus from the red line, for a “cricket temperature” of 80 degrees Fahrenheit, the measured air temperature is only 78 degrees Fahrenheit. Similarly, from the red line, a cricket temperature of 50 degrees Fahrenheit corresponds to a measured temperature of 52 degrees Fahrenheit — not exactly right.

So I plotted cricket chirps against air temperature to get a better method: Count cricket chirps for 13 seconds, and then add 40 degrees. Using this method, the points (and the red line) are much closer to the black line.

Air temperature measured using cricket chirps

Figure 2. Air temperature measured using cricket chirps. For this graph, the number of chirps during 13 seconds is added to 40.4 to get the air temperature. As in Figure 1, the black line is where the points would fall if the method was perfect, and the red line is the line that best fits the data.

Clearly the approach in Figure 2 works slightly better. The red “best-fit” line through the data lies almost on top of the “perfect fit” black line. I later found this method was also on the Web.

If you find it hard to count chirps for 13 seconds, count chirps for a longer period (say 30 seconds) and then multiply by 13/30 to get the chirps in 13 seconds. Or if you are really patient, count chirps for a full minute and multiply by 13/60.

Notice that both the “cricket temperature” and the measured temperature stay above 50 degrees Fahrenheit. Both my husband (who helped collect data when I was gone) and I heard no cricket chirps at all when the measured temperature was 49 degrees Fahrenheit or lower. This suggests that 50 degrees Fahrenheit is at about the lower limit for when crickets chirp.

I had suspected that the lowest temperature for chirping crickets would be 50 degrees Fahrenheit or less. Why? Because meteorologists who study winds using radar have noticed that insects stop flying (and producing radar echoes) at 50 degrees Fahrenheit (or 10 degrees Celsius). I reasoned that it would take about the same energy — or less — to chirp than to fly, since chirps are produced by crickets rubbing their wings together, which should consume less energy than flying.

For comparison, a posted article from Dartmouth College lists 55 degrees as the minimum temperature for cricket chirps. Both my husband and I noticed fewer crickets (one or two) were chirping when the temperatures were in the lower 50s, so some crickets probably did stop chirping at that temperature, but not all.

Finally, let’s plot the data to show the relationship between cricket chirps and the temperature in Celsius degrees. Figure 3 shows this relationship. Again, the “best-fit” red line and the data are close to the “perfect fit” black line.

Relationship between cricket chirps and the temperature in degrees Celsius

Figure 3. Relationship between cricket chirps and the temperature in degrees Celsius. As in Figures 1 and 2, the black line is where the points would fall if the method was perfect, and the red line is the line that best fits the data.

You can find several approaches on the Web, but it is not certain where they came from, and the raw data aren’t available, so you don’t know how many measurements were taken to determine the approach. Here I provide the data set so that you can play with it — or add your own observations. Have fun! It will be interesting to see whether chirps from crickets in the other parts of the U.S. and world relate to temperature in the same way.

Cricket Chirp Data – Boulder Colorado, USA. All dates 2007

Date Time (MDT) Chirps/15s Chirps/13s Temp (F) Temp(C)
21 Aug 2030 44.000 38.133 80.500 26.944
21 Aug 2100 46.400 40.213 78.500 25.833
21 Aug 2200 43.600 37.787 78.000 25.556
24 Aug 1945 35.000 30.333 73.500 23.056
24 Aug 2015 35.000 30.333 70.500 21.389
24 Aug 2100 32.600 28.253 68.000 20.000
24 Aug 2200 28.900 25.047 66.000 18.889
24 Aug 2230 27.700 24.007 65.000 18.333
25 Aug 0030 25.500 22.100 61.500 16.389
25 Aug 0330 20.375 17.658 57.000 13.889
25 Aug 0500 12.500 10.833 55.000 12.778
25 Aug 2000 37.000 32.067 76.250 24.583
25 Aug 2030 37.500 32.500 74.000 23.333
25 Aug 2100 36.500 31.633 74.000 23.333
25 Aug 2200 36.200 31.373 72.500 22.500
26 Aug 0530 33.000 28.600 66.000 18.889
26 Aug 2030 43.000 37.267 77.500 25.278
26 Aug 2200 46.000 39.867 78.500 25.833
27 Aug 2000 29.000 25.133 68.500 20.278
27 Aug 2030 31.700 27.473 68.500 20.278
27 Aug 2100 31.000 26.867 68.000 20.000
27 Aug 2200 28.750 24.917 66.000 18.889
28 Aug 0240 23.500 20.367 59.000 15.000
28 Aug 2010 32.400 28.080 70.000 21.111
28 Aug 2050 31.000 26.867 69.000 20.556
28 Aug 2200 29.500 25.567 67.000 19.444
29 Aug 0240 22.500 19.500 61.250 16.250
29 Aug 0440 20.600 17.853 58.500 14.722
29 Aug 2000 35.000 30.333 72.000 22.222
29 Aug 2050 33.100 28.687 71.000 21.667
29 Aug 2200 31.500 27.300 69.000 20.556
29 Aug 2330 28.800 24.960 66.500 19.167
30 Aug 0330 21.300 18.460 60.000 15.556
30 Aug 2000 37.800 32.760 75.000 23.889
30 Aug 2055 37.000 32.067 73.250 22.917
30 Aug 2200 37.100 32.153 72.500 22.500
1 Sep 2200 36.200 31.373 70.000 21.111
2 Sep 0330 31.400 27.213 67.500 19.722
2 Sep 0600 30.200 26.173 66.000 18.889
4 Sep 0240 31.300 27.127 69.000 20.556
4 Sep 0505 26.100 22.620 63.000 17.222
5 Sep 0500 25.200 21.840 63.000 17.222
6 Sep 0600 23.660 20.505 61.000 16.111
7 Sep 0215 22.250 19.283 62.000 16.667
7 Sep 0525 17.500 15.167 56.500 13.611
9 Sep 2010 15.500 13.433 55.000 12.778
9 Sep 2110 14.750 12.783 52.000 11.111
10 Sep 2115 15.000 13.000 53.000 11.667
10 Sep 2210 14.000 12.133 50.000 10.000
11 Sep 0315 18.500 16.033 52.000 11.111
16 Sep 2100 27.700 24.007 65.000 18.333
17 Sep 2200 26.000 22.533 63.000 17.222
18 Sep 0130 21.700 18.807 59.000 15.000
19 Sep 0415 12.500 10.833 50.750 10.417
19 Sep 0435 12.500 10.833 49.250 9.5833