Archive for November, 2008

Changes in carbon dioxide in the air

Monday, November 17th, 2008

I’m going to write a little bit more about a “climate misconception” to follow up on the blog I did a few weeks ago. This relates to how our cutting back on carbon production affects the amount of carbon dioxide in the atmosphere. In the earlier blog, I stressed the long lifetime that carbon dioxide has in the atmosphere as being an important reason why it will take a long time to reduce the amount of carbon dioxide in our atmosphere.

But I missed an important misconception: many think that simply keeping the amount of carbon dioxide we release the same will keep the carbon dioxide in the atmosphere the same. Similarly, many think that reducing the amount of carbon dioxide we release will reduce the amount of carbon dioxide in the atmosphere.

As recently discussed in a recent article in Science, there is a fundamental misconception. We forget that the total amount of carbon dioxide in the atmosphere relates to how much we release and how much nature (or, if you prefer, the Earth system) can absorb.

The article describes a question asked of students at the Massachusetts Institute of Technology – a very smart bunch of people. The question went something like this:

Suppose we put twice as much carbon dioxide into the atmosphere as the earth system can absorb. How will the carbon dioxide in the atmosphere change if we keep producing the same amount of carbon dioxide?

A surprisingly large number thought that the carbon dioxide in the atmosphere would stay the same if we didn’t change our habits at all.

Does that seem right to you? Perhaps it does, because we have seen reports of increased amounts of carbon dioxide put into the atmosphere by humans, and an increase of carbon dioxide in the atmosphere. So we might be led to think that if we keep putting in the same amount of carbon dioxide, then the amount of carbon dioxide in the air will stay the same. And we can reduce the amount of carbon dioxide in the air simply by reducing the amount we put into the air.

But let’s stop and think a minute. The question states that the earth system can absorb just half of what we are putting in.

Suppose we have a bathtub. We turn on the water faucet full blast and leave the drain open, so that the amount of water going into the bathtub is twice what is draining out.

Do you think that the level of water in the bathtub will remain the same? Or are you worried that the bathtub will overflow?

Let’s go through the bathtub problem step by step.

Start with an empty bathtub.

In one minute –10 liters of water comes out of the faucet, and we drain out five. (At least this is what happened when I did it.)

At the end of one minute, how much water is in the bathtub – five liters!

bathtub1.jpg

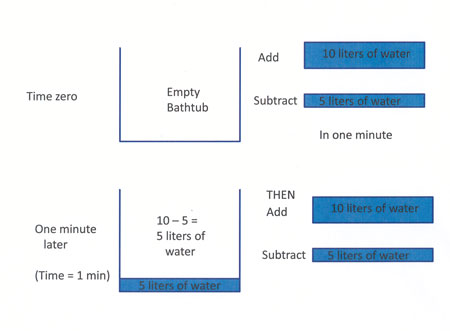
Figure 1. Putting water in a bathtub (well, a funny-looking bathtub) and draining it out.

And the end of the second minute, another 10 liters of water has come out of the faucet, and five have drained out.

How much water is in the bathtub? Five liters, plus the ten liters from the faucet, minus five liters that drained out – that’s 10 liters.

bathtub2.jpg

Figure 2. Filling up the same bathtub, after two and three minutes.

At the end of the third minute, another 10 liters of water has come out of the faucet, and five have drained out. How much water is in the bathtub now? Ten liters already there, plus the ten liters from the faucet, minus five liters that drained out … 15 liters!

I could continue on, but I think you have the idea – the bathtub is filling at the rate of 5 liters a minute.

Now let’s go back to the carbon dioxide? What do you think now? If you think that the amount of carbon dioxide in the atmosphere will increase with time, even if we release the same amount into the atmosphere, you have the right answer!

Of course, our atmosphere (and people) are much more complicated than that. Different parts of the earth system – trees, grasses, the ocean – take carbon dioxide out of the atmosphere in different ways. And there could be other natural sources of carbon dioxide. We have a good idea about how things work, and what possibilities there are, but there is still much we don’t know. Thinking about the bathtub again, the drain might clog up a little bit or drain better, or water could be flowing from a second faucet.

This blog was inspired by the Policy Forum, by John D. Sterman in the 24 October 2008 issue of Science.

Measuring Rain

Tuesday, November 4th, 2008

For years, I have been measuring the rain in our back yard using a standard rain gauge similar to the ones used by the U.S. National Weather Service (Figure 1). Like the gauge used by GLOBE students, rain goes through a funnel into a tube whose horizontal cross-sectional area is one-tenth that of the outer gauge, so that the measured rain is ten times the actual amount of rainfall. This year, I took a GLOBE-approved plastic gauge home. We put this one on a fence along the east side of our yard (Figure 2).

figure_1metal_gauge.JPG

Figure 1. Rain gauge used for observations in my backyard. Normally, there is a funnel and small tube inside, but it doesn’t fit very well, so we pour the rain into the small tube after each rain event. This gauge is similar to those used by the U.S. National Weather Service. This gauge is about 25 cm in diameter.

figure_2plastic_gage.jpg

Figure 2. Plastic raingauge matching GLOBE specs. This gauge is about 12 cm in diameter. Note the tall tree in the background.

Neither gauge is in an ideal location. In both cases, there are nearby trees (Fig. 2, map) which might impact the measuring of the rain. This is a problem a lot of schools have: there is just no ideal place to put a rain gauge. We were particularly worried about the plastic gauge, which was closer to trees than the metal gauge.

Why do we have two gauges? The metal gauge was hard to use: its funnel didn’t fit easily into the gauge, so we had to pour the rain from the large gauge into the small tube after every rainfall event. We got the plastic gauge to replace the metal one. We put the gauge on the fence because it was well-secured. But the first six months we used the new gauge, the rainfall seemed too low compared to totals in other parts of Boulder. So, I put the metal gauge back outside and started comparing rainfall data.

figure_3backyard_map.jpg

Figure 3. Map of our backyard. Left to right (west to east), the yard is about 22 meters across. The brown rectangular shape is our house; the circles represent trees and bushes. The numbers denote the height of the trees and bushes. The 10-m tree is an evergreen; the remaining trees and bushes are deciduous. The southeast corner of the house is about 3 m high.

How did the gauges compare?

Starting this summer, I started taking data from both gauges. Unfortunately, it didn’t rain much. And sometimes, we were away from home: so this is not a complete record. But I don’t need a complete record to compare the rain gauges.

Table: Rain measurements from the two rain gauges

table.jpg

The results (in the table, also plotted in Figure 4) look pretty good. With the exception of the one “wild” point on 6 October 2008, the measurements are close to one another. We think that the plastic gauge was filled when the garden or lawn next door was watered. This would not be surprising: we have found rain in the plastic gauge when there was no rain at all.

I learned after writing this blog that Nolan Doeskin of CoCoRaHS (www.cocorahs.org) has compared these two types of gauges for 12 years, finding that the plastic gauge measures slightly more rain (1 cm out of 38 cm per year, or about 2.6%).

figure_4rain.jpg

Figure 4. Comparison of rainfall from the two rain gauges in our back yard. Points fall on the diagonal line for perfect agreement.

I learned two things from this exercise.

First, I probably should have used the two gauges before I stopped using the metal one. That way, my rainfall record wouldn’t be interrupted if the new gauge was totally wrong. (I was worried that the trees were keeping some rain from falling into the gauge. This would have led to the plastic gauge having less rainfall than the metal gauge. And, since the blockage by the trees would depend on wind direction and time of year, I wouldn’t have been able to simply add a correction to the readings.) Fortunately, the new and old gauges agreed.

In the same way, if you want to replace an old thermometer with a new one, it’s good to take measurements with both for awhile, preferably in the same shelter. Suppose the new thermometer gives higher temperatures than the old one. If you want to know the temperature trend, you can correct the temperatures for one of the two so that the readings are consistent.

The second thing I learned is that it is o.k. to reject data if there is a good reason (such as people watering their lawns). It’s also important to note things going wrong – like my spilling a little bit of water on 15 August. If you keep track of things going slightly wrong (or neighbors watering the lawn), you can often figure out why numbers don’t fit the pattern.

I will continue to compare records for awhile, to see whether the readings are close to one another on windy days. If they continue to be similar, I will be able to try a method to keep birds away from the rain gauge that was developed by a GLOBE teacher – Sister Shirley Boucher in Alabama. Keep posted!