Archive for April, 2008

Puddles and the GLOBE inquiry model

Friday, April 25th, 2008

As the last (I promise!) blog on the Missouri puddle, I describe the informal puddle investigation in terms of the GLOBE Inquiry Model.

The GLOBE Inquiry Model is a simple way to describe how scientists investigate questions. It’s easier to deal with the inquiry process in the classroom if the steps are described. In reality, the way scientists “do” inquiry is much messier, and different scientists have different ways of doing their research. But, in the end, they have to do all the same things that will be described here. Often, scientists return to each step a number of times while they are learning about the question they are investigating. This was illustrated a little bit in the puddle blog.

To summarize, here are the steps

  1. Observe natural phenomenon
  2. Explore, extend, and refine observations
  3. Develop investigation plan
  4. Conduct investigation
  5. Analyze data
  6. Summarize findings and conclusions
  7. Share findings and conclusions
  8. Identify new research questions

This is but one summary. There are many other ways of summarizing the inquiry process. For example, “Form a hypothesis” is often a listed step (in fact, is an option under “Explore, extend, and refine observations.”) Also, “Conduct Investigation” includes making observations, but they are now more systematic.

Note that not all scientific investigations start with a hypothesis. In some investigations, a question is narrowed down until an answer seems possible given the time and resources available for the investigation. For example, it is quite legitimate to ask “Has snowfall decreased in my hometown in the last 50 years?” Sometimes scientists start investigations with a question and develop a hypothesis in the course of the study. Other times, scientists alter their hypotheses as they discover new things.

Okay, let’s get started.

1. Observe the natural phenomenon
The way I work is that I look for surprises – something I can’t easily explain. Maybe if I don’t understand it, other people don’t either.
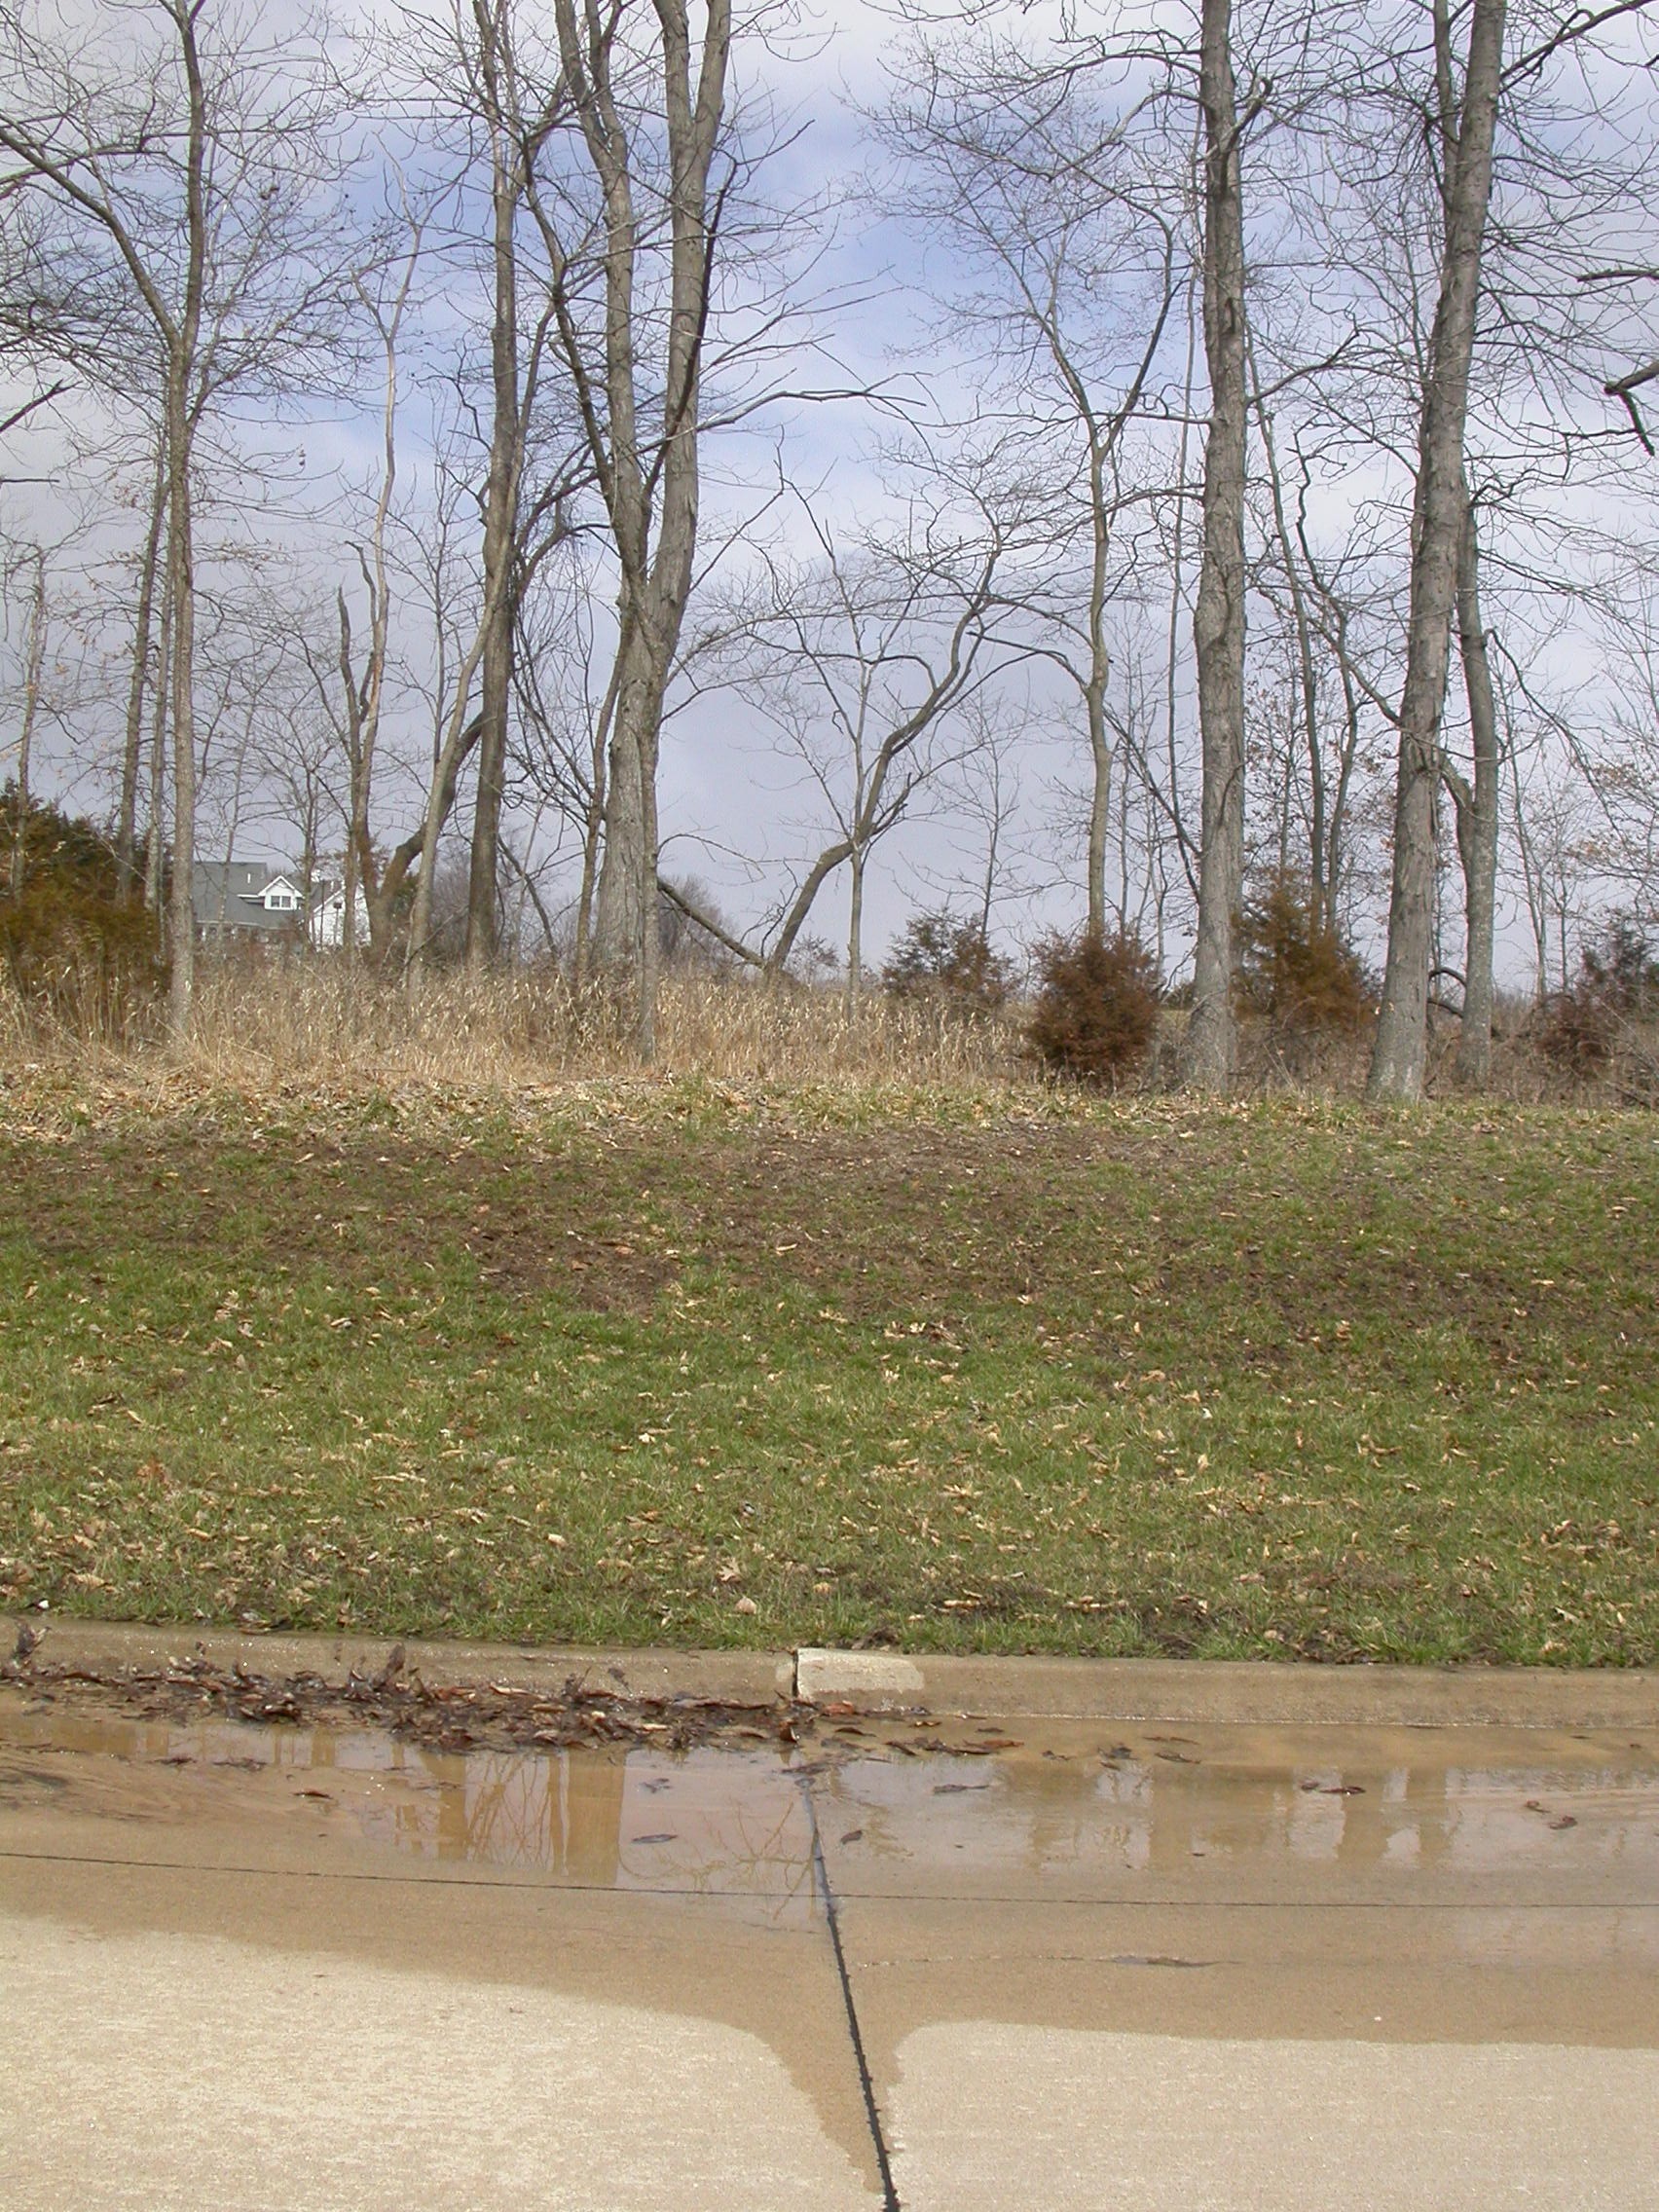
In this case, I saw a puddle that remained large (and possibly even grew) even though it had not rained or snowed for several days. Also, the puddle remained liquid, which seemed surprising given subfreezing temperatures for several days. This didn’t make sense to me. So I started to watch the puddle.

2. Explore, extend, and refine questions
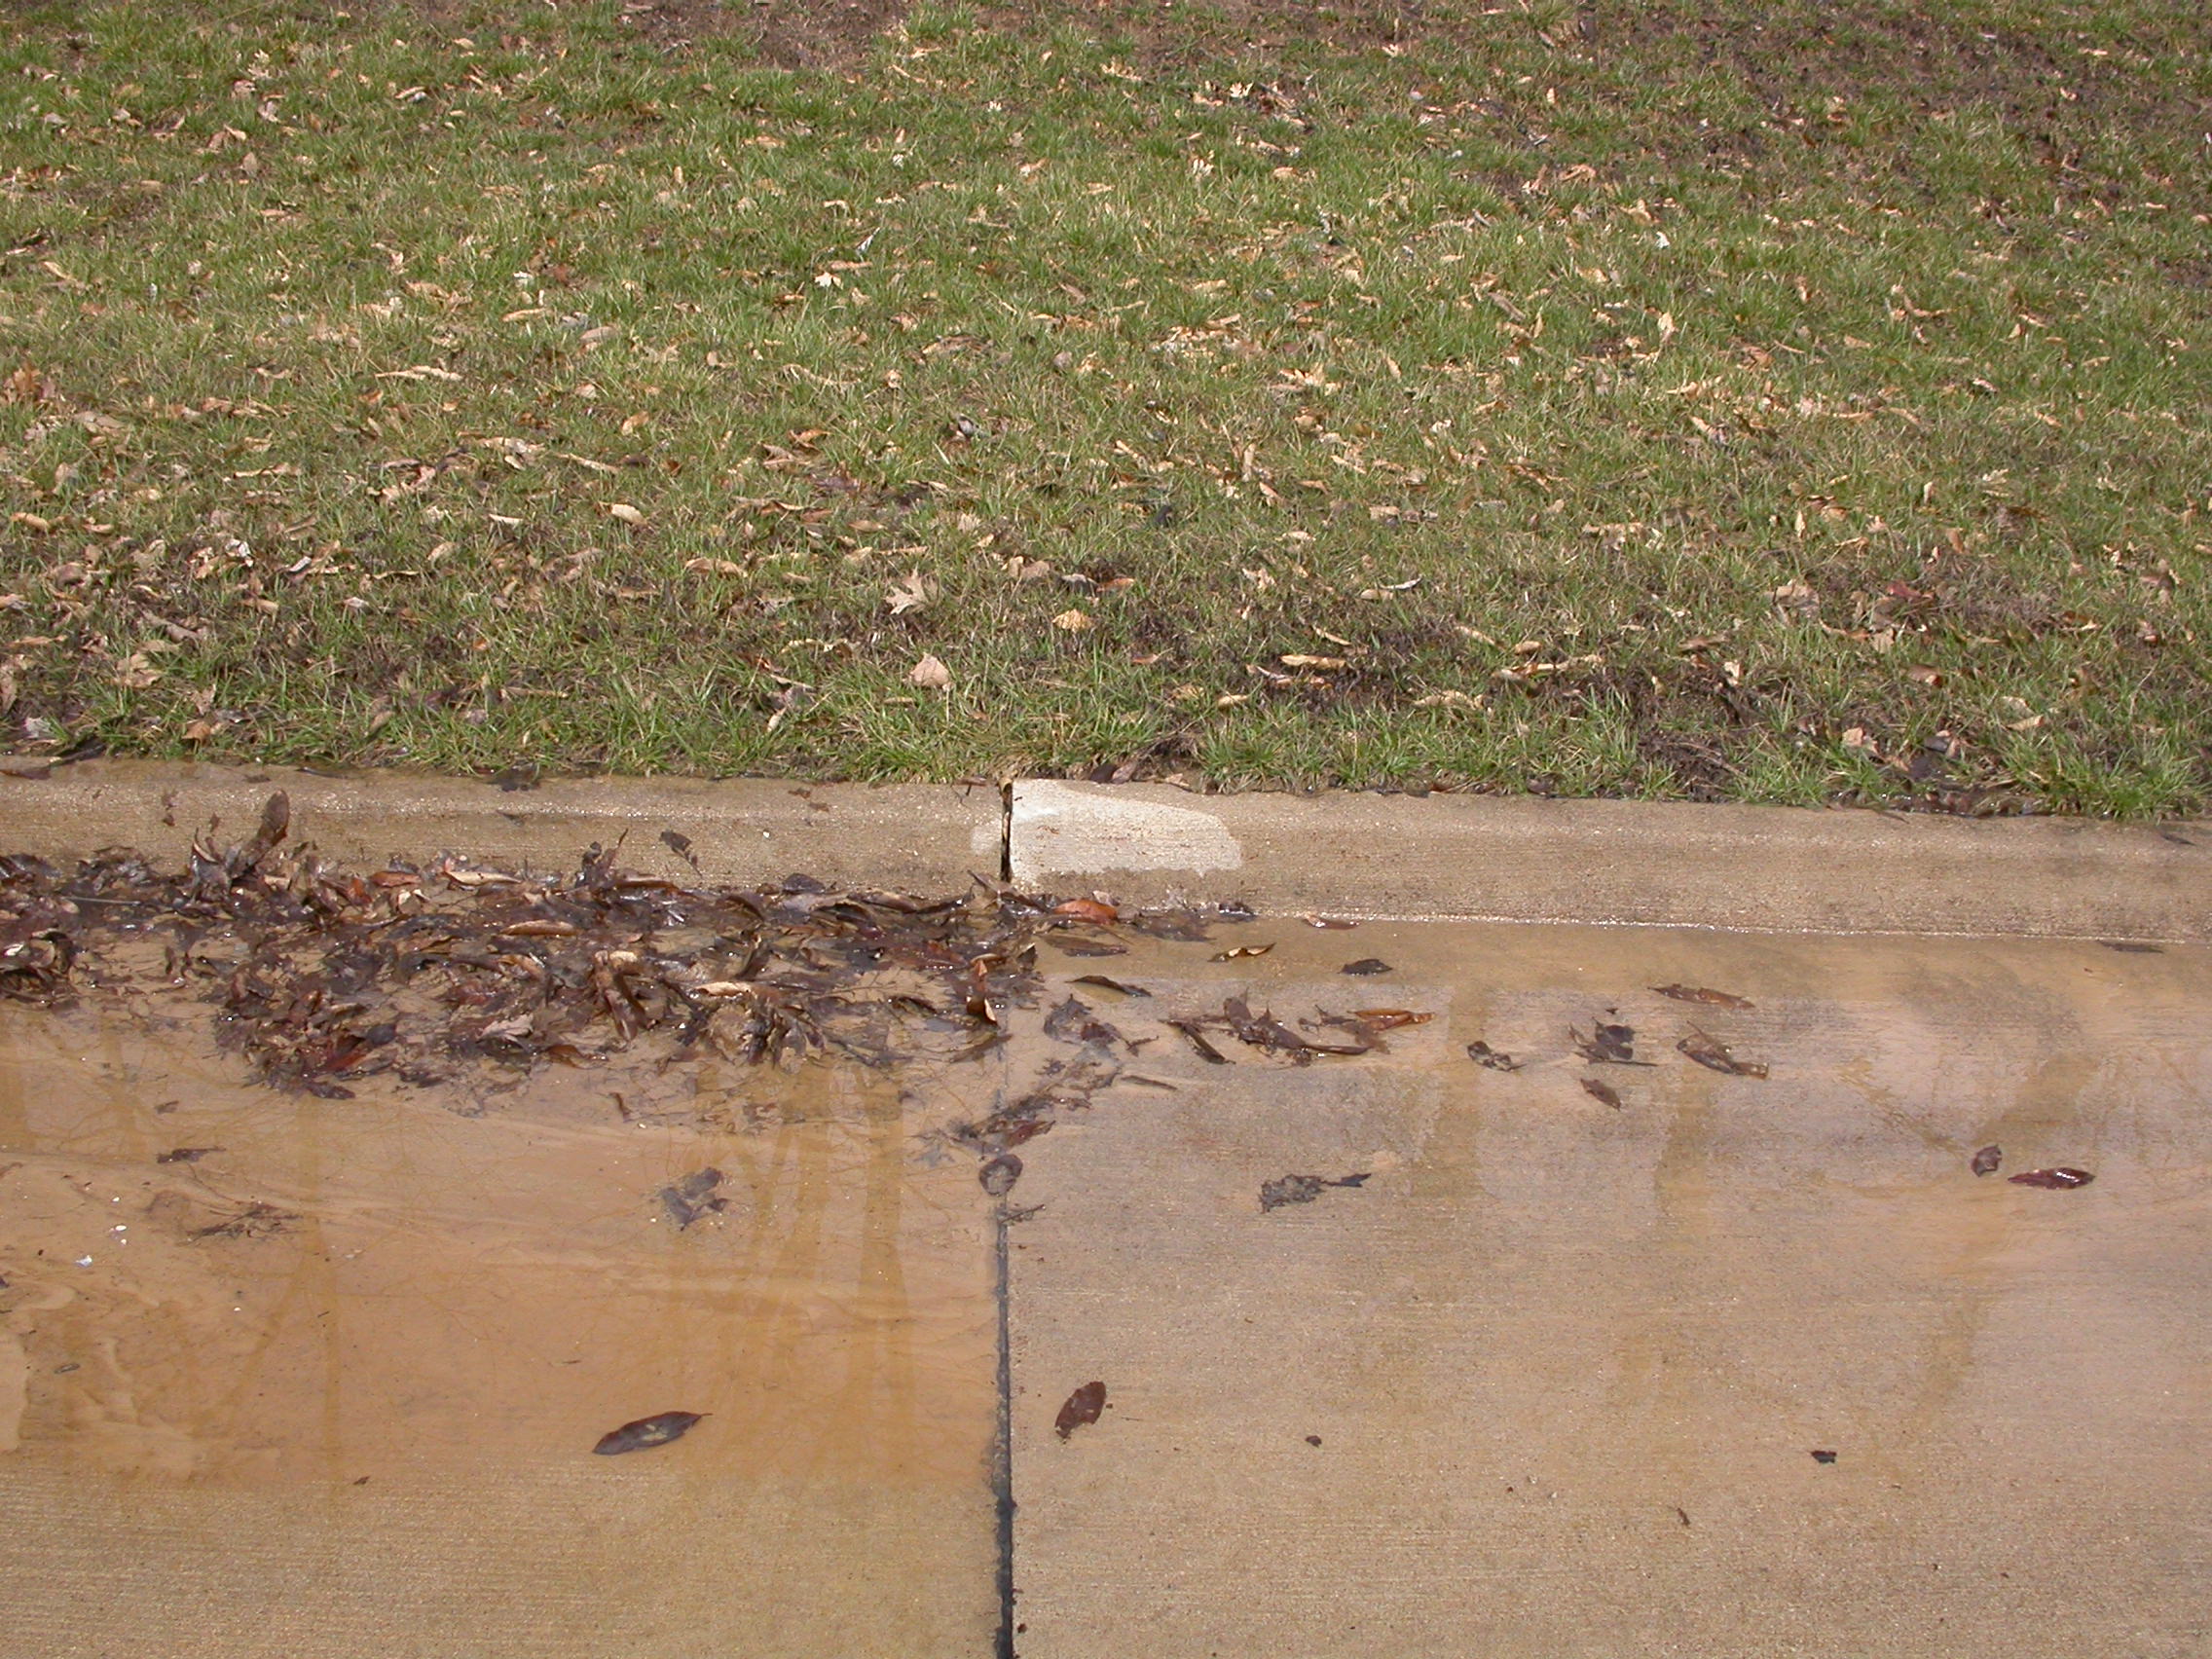
In February, I walked to the puddle several times in a few days, to see what was happening to it. The fact that it was still there intrigued me. Also, I discovered a line of fire hydrants on the same side of the road as the puddle, which meant that there was an underwater pipe. (Was the pipe broken?) Finally, I noticed salt crystals on the road one morning; with newly fallen snow melting around the salt crystals. (Could the salt be keeping the water from freezing?)

3. Develop investigation plan
Given the observations I had made – no rain, possible broken underground pipe, very cold weather, I had two hypotheses regarding the origin of the puddle, namely:

  1. The puddle was the result of a break in the pipe connecting the fire hydrants.
  2. The puddle was fed by water running downhill beneath the surface (it was frozen at the surface).

I also had two hypotheses why the puddle was liquid.

  1. The puddle was supplied by underground water that was warm enough to be liquid
  2. The puddle didn’t freeze because of the salt on the road.

To see whether a leaky pipe caused the puddle:

  1. In February, I decided to interview people who knew about the road.
  2. In March, I decided to check to see if the puddle was there after several warm and dry days. If there was a leaky pipe, I would have expected to see a puddle.

To see whether the puddle came from water below the frozen ground:

  1. In February, I decided to look for data showing it was possible for the soil (and water) below the surface to be warmer than freezing during short (week-long) periods with air below freezing. (It would have been ideal to take measurements near the puddle, but I did not have the proper equipment).
  2. In February, I also decided it was important to check to see whether there was water on the surface, even thought it was quite cold.
  3. In March, I decided to check to find how underground water could flow onto the street.

Notice that this was not all done at once. I went back and refined my investigation plan, when I found out I had the opportunity to check further.

4. Conduct Investigation

To investigate whether the puddle was supplied by underground water:

  1. I continued to observe the puddle to see whether it was changing in size (February).
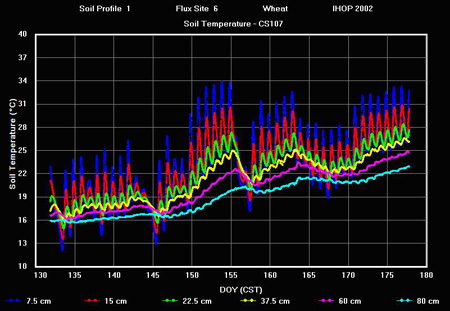
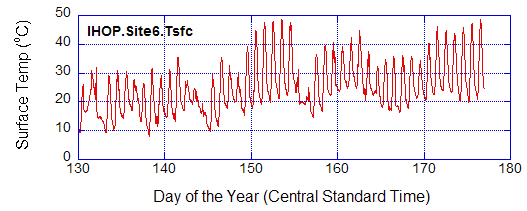
  2. I obtained wintertime data from Smileyberg, Kansas, and Bondville, Illinois, to see how soil temperature behaved during ~week-long periods when temperatures were much colder than normal (and also below freezing). I plotted the air temperature and soil temperature during the cold periods, to confirm that the soil temperature could be above freezing (February).
  3. I looked for openings in the street and curb for underground water to flow through to supply the puddle.

To investigate the broken-pipe hypothesis:

  1. I asked my nephew about whether the pipe could be broken. He thought it unlikely because the pipes were very new.
  2. I checked the puddle location a month later, when warm weather dried the ground. There was no puddle, which made me think that the pipe was probably o.k.
  3. Also, I knew from my family and the appearance of the ground that the pipe had not been repaired.

To investigate the salt hypothesis:

  1. I looked for evidence of salt on the road (salt crystals, melting around the crystals, and white stain on the road where salty water had dried up).
  2. I interviewed a colleague who had been involved in studying arctic ice.

5. Analysis of the data

  1. I compared the puddle sizes (from memory and photographs).
  2. I plotted the air temperature and soil temperature at several levels to confirm that the soil could remain above freezing even when the air got quite cold.
  3. I compiled evidence of salt (the crystals, the stain the road where the puddle had been, Even the slushy appearance of the water was associated with it being cold and salty).
  4. I compiled evidence that the pipes were not leaking (the pipes were new, the contractor had a good reputation, there was no puddle after a dry spell, and it was obvious no one had repaired the pipe between my visits to the site).

6 and 7. Summarizing findings and conclusion and sharing findings

By doing my blog, I was working on this part even before I had finished the investigation. Were I to write this as a report, I would summarize the hypothesis, methods, and results as if they were done in an orderly manner. The timing of a result – be it before or after I was working on hypotheses, doesn’t really matter in the final report.

Were I not doing a blog, I would have recorded similar information in my laboratory notebook, so that I could be reminded of the details when I wrote the final report. (Here is a sample final report.)

8. Identify new research questions

It is rare that someone finishes up a research project without thinking of more questions. I was thinking of them the entire time. I was so excited about the possibility of underground water causing a liquid puddle when the air temperature was well below freezing, I didn’t think of the effects of salt. That is, until the next day when I saw the snow melting around the salt crystals. Now, I’m wondering if the cars disturbing the puddle kept it from freezing as well. And tomorrow I might think of other ideas.

It is not easy to decide when to finish a study. If you are a student, you have a due date that forces you to stop. If you are scientist, and are being paid to finish a project by a deadline, you also have to stop – at least until you can find someone to pay you to answer your next question.

In fact, scientists I know usually find that their investigations often lead to more questions than answers.

In the same way, thinking about the evidence kept giving me new ideas for what to look for. So, instead of a few tasks done one by one, I was sometimes doing several at once.

Part 5. Postscript to Missouri Puddles Blog

Tuesday, April 15th, 2008

(If you are interested in the Pole to Pole videoconference, just scroll down – it’s just below this one. I’m finishing up the puddles blog so that I can write a blog or two on inquiry, using the puddles as my example).

As I was proofreading the puddles blog upon returning to Colorado, I started wondering if the puddle simply had been left behind from the previous week’s rains, and that salt may have kept the puddle from freezing.

I had the opportunity to check this last week, on a second trip to Missouri. Again, there had been rain a few days before I arrived. And again, there was a puddle in the same place. But this time I could see clearly that water was flowing into the puddle (and other places along the road) from gaps in the curb as well as some in the street. You can see this in Figures 11 and 12.

puddle19mar08curb.jpg

Figure 11. A new puddle (photographed 19 March) at the same location of the one photographed in February, in Columbia, Missouri. Note that water is leaking through a gap in the curb as well as part of the crack.

I also discovered that the puddle was not in a dip in the road, as I had suspected earlier, but it was located in a place the road was nearly horizontal (okay, maybe a very shallow drip): There was actually some flow downhill toward the lowest spot, where water drained into a sewer. Finally, I discovered that the puddle is only about 2 meters (6.6 feet) above the lake.

puddlecloseup19mar08.JPG

Figure 12. Closeup of the puddle.

There were other puddles along the road, formed from drainage through gaps in the curb and sometimes gaps in the pavement of the road (most of the cracks in the roadbed are sealed with tar).

After a few days with temperatures rising to around 15 degrees Celsius (59 degrees Fahrenheit, the puddle finally disappeared. Where the water was, a white stain on the road revealed that salt had collected there; and there was drier soil carried along with the water feeding the puddle.

Another day with no puddles convinced me that the pipe connecting the fire hydrants (see earlier parts of this blog) was not leaking.

So, with a little extra data I was able to confirm the hypothesis that the puddle was being fed by subsurface water flowing at least through a gap in the curb (which is ~15 centimeters or 6 inches high) and possibly the crack in the road. Salt clearly also played a role in keeping the water from freezing.

I also found out something else. My brother and sister-in-law’s house was heated and cooled by pumping groundwater up to the house. Remember, the temperature 30 meters (100 feet) down – or even 10 meters (30 feet) down – is close to the average temperature for the whole year (in Columbia, about 13 degrees Celsius or 55 degrees Fahrenheit). So the water pumped up to the surface in the summer will be much cooler than the air temperature, and thus can be used to cool the house. In the winter, the ground water is almost always warmer than the house, so it can be pumped up to warm the house.

But remember – the temperature of the ground water – and the average temperature – is about 13 degrees Celsius (55 degrees Fahrenheit). That’s not warm enough to heat the house in winter, so another method is needed to bring the temperature up from 13 degrees to a more comfortable 20 degrees Celsius (68 degrees Fahrenheit) or so.

Next time: how the investigation of this puddle illustrates the inquiry process – or the “scientific method.”

2008 IPY Pole-to-Pole Videoconference

Thursday, April 10th, 2008

I’m going to interrupt blogging about surprising liquid puddles and soil temperature to talk about the Second Pole-to-Pole Videoconference, which took place yesterday (8 April 2008). Several scientists participated, as did five schools: in Ushuaia, Argentina, the Escuela Provincial No. 38 Julio Argentina Roca; and in Alaska, the Randy Smith Middle School (Fairbanks), Moosewood Farm Home School (Fairbanks), Wasilla High School (Wasilla), and Innoko River School (Shageluk). The Web Conference was hosted by the GLOBE Seasons and Biomes Earth System Science team, at the University of Alaska at Fairbanks.

ak_globe_schools1-17-06_web.gif

Figure 1. Locations of the schools in Alaska. Courtesy Dr. Elena Sparrow

ushuaia.jpg

Flgure 2. Location of Ushuaia, which is near the southern tip of South America. Part of Antarctica appears on the southern part of the map.

The focus was on climate change, in particular:

  1. The most important seasonal indicators (things that change with season)
  2. Whether they are being impacted by climate change (if so, how?)
  3. How students could study these indicators to see if they are impacted by climate change.

As was the case last year, the students had an opportunity to ask questions of the students at the other schools as well as the scientists, but the conversation was more structured. We organized the conversations into three rounds. In Round 1, the Alaskan and Argentinean students were to ask each other about signs of seasonal change or share their own observations. In Round 2, the focus was on how to narrow questions down enough so that students could investigate them. And in Round 3, we were supposed to discuss the ways the investigations could be done.

The questions in Round 1 were wide-ranging. Why do leaves change color? Why is the soil frozen when the air is warm? Does the melting of permafrost cause damage to buildings and trees? Are glaciers disappearing? Do scientists use Native knowledge in their research? How does climate change affect plants and animals?

We learned that soil below ground warms and cools with the seasons more slowly than the air, and – the farther you go down, the less the temperature changes (this is also discussed in the previous few blogs). We also learned that the changes in the lower layers of the soil took place after the changes higher up (in scientific terms, the changes in the lower layers lags the changes in the upper layers). So a student was able to guess that late summer is the best time to test for permafrost, rather than the height of summer, when the sun angle is the highest.

We discovered that scientists are using Native knowledge in their research in many parts of the world, including not only Alaska and Canada, but also in Australia. We learned that magpies are coming farther north to Shageluk, and there are more pine grosbeaks than there used to be, although a student in Fairbanks didn’t notice any changes. We also learned that tree line is moving up in the mountains near Ushuaia.

In Round 2, questions focused on some fascinating things to investigate, including changes in the snowboarding season (of interest to students in both hemispheres), changes in temperature and precipitation, and succession of species after wildland fires. In fact, the students at Shageluk are already investigating the succession of species of some land recovering from a forest fire (see pictures at the Shageluk web site). The discussion of temperatures taught us the difference between maritime (Ushuaia and Wasilla) and continental (Fairbanks and Shageluk) climates: Ushuaia rarely gets below freezing, but Fairbanks has temperatures as low as -40 (same in Fahrenheit and Celsius), although such cold temperatures aren’t as common and persistent as they used to be). The discussion of snowboarding led to suggestions of investigating how long ski areas remain open, interviewing someone at a ski area about what conditions are good for snowboarding, thinking about what makes snow last (amount of precipitation, timing of precipitation, temperature). Two intriguing observations were that there were both more cumulus clouds in Ushuaia than there used to be, and more heavy rains.

With so many ideas generated in Round 2, some investigations were already outlined in some detail by the time we got to Round 3 – especially related to snowboarding. But snowboarding ideas continued to come up. A ski area had closed in Ushuaia, because its elevation was too low in the warming climate; and students in both hemispheres thought snowboarding might be an interesting thing to investigate together. Since the seasons are opposite, the study could be continuous.

Some new ideas also emerged about items to investigate. How about looking at when people take off or put on snow tires? Is that a good indicator of climate change? What about using frost tubes to monitor freezing and thawing in the soil in Ushuaia as well as Alaska? And how would frost-tube measurements relate to air temperature or the times that lakes and rivers freeze? And one could investigate the long-term seasonal geographic changes in diseases (mosquito-borne diseases, corn diseases).

It was pointed out to us that using a simple variable like temperature could yield some fascinating results beyond averages and simple trends. Is there a trend in how many days that the temperature stays above freezing? How about for the number of days when temperatures stay below freezing? How does this relate to precipitation? Clouds?

Also, we were reminded that not all changes we see are due to climate change – we humans are changing our environments in many other ways, such as destroying wilderness areas. And that trends we see in a few years can be quite different from the long-term trend. (That is, one cold winter doesn’t mean that it is getting colder on the long term.)

Through this rich mix of ideas for research topics and data to look at, the students continuously asked about each others’ lives. One of the most fascinating exchanges took place toward the end of the videoconference, when a student from Alaska asked the students in Ushuaia what kind animals they had and what kind of wildlife they ate. The Ushuaia students listed foxes, llamas, beaver, rabbit, birds, and penguins as the animals they had; and said that they ate rabbits, fish, and some beavers (but mostly tourists ate beavers). The beavers were apparently introduced to the region in 1946, and there are no natural enemies, so people are being encouraged to eat them.

A student from Shugaluk closed the discussion section of the conference by putting things in perspective. Yes, skate boarding and dog mushing are interesting, but for the Native peoples of the far North, their very way of life is being threatened. Earlier, a student in Ushuaia said that a glacier that was supplying water to the city was melting and would be gone in a few decades, leading to a shortage of drinking water. As one of the scientists said earlier, like the canary in the coal mine that warned of dangerous gases in a mine– the people in the Polar regions are the first to see the real danger in climate change. We need to remember this as we begin to take steps to try to slow down climate change and its impacts.

NOTES IN CLOSING:

There will be a web chat and web forum April 10-11. The purpose is to help students develop research ideas and projects, and interact with scientists. Links to the chat and forum can be found on the Pole-to-Pole Videoconference page of GLOBE Web site.

Three PowerPoint presentations describe the science and people of Ushuaia. They are also available on the Videoconference page at the above link.

Finally, I recall promising a student from Fairbanks that we would return to the topic of leaves changing color. Since we didn’t follow up on this question, I thought I would include a discussion here. The leaves change color because the chlorophyll, which gives the leaves their green color, disappears in the fall, so that other chemicals in the leaves give them their color. The chlorophyll, of course, is involved in photosynthesis, which provides plants the energy to grow. Different types of trees change different colors. For example, some maple trees turn bright red, while aspen trees turn yellow in the autumn. The weather actually affects how bright the colors are in the fall. In long term, the climate also affects the trees that can stay healthy in a given place. Thus the mix of trees, and hence the colors could change over many decades.

More information is available about leaf color under the Seasons and Phenology Learning Activities, Activity P5 “Investigating Leaf Pigments” in the Earth as a System Chapter of the GLOBE Teachers’ Guide.

The seasons and Biomes project is an effort to engage students in Earth system science studies as a way of learning science. It is a timely project for this fourth International Polar Year with many and intense collaborative research efforts on the physical, biological, and social components and their interactions. Changes in the Polar Regions affect the rest of the world and vice versa, since we are all connected in the earth system. I encourage students to conduct their own inquiry whether collectively as a class or in small groups, or individually. Students can use the many already-established GLOBE measurements in the areas of atmosphere/weather. soils/land cover/biology, hydrology, and plant phenology in their local areas (You can access the protocols by clicking on “For Teachers” on the menu bar at the top of the GLOBE homepage.) Soon there will be new measurement protocols such as fresh-water ice freeze-up and break-up protocols and a frost-tube protocol that will be posted on the GLOBE web site. Students can conduct a study on things that interest them as part of the upcoming GLOBE Student Research campaign.

Puddles and Soil Temperature, Part 4: Cool soil in the summertime

Monday, April 7th, 2008

During the summer, abundant sunshine during the long days heats up the ground near the surface. I’ve seen surface temperatures on dry ground up to 50°C in the south-central Great Plains of the United States. If you’ve dug a hole in the ground, have you noticed how cool the soil is? Last fall, when I was digging a hole for a dinosaur dig, I sat in the hole to cool off! (Figure 8).

peggyinhole.jpg

Figure 8. Me enjoying the relatively cool temperatures in a hole. The shade helped, too! Photo by Lorrie McWhinny.

Figure 9 shows how the temperature varied beneath a winter wheat field in south-central Kansas during the late spring-early summer of 2002. The temperature 7.5 centimeters below the surface (blue curve) reaches a maximum in the early afternoon, with the peaks slightly later as you go to lower levels. Note that the daytime temperature at 7.5 centimeters below the surface is warmer than that at 15 centimeters, and so on, with the coolest temperatures at 80 centimeters below the surface.

sciblogpuddle-soiltempcs107.jpg

Figure 9. Soil temperature as a function of day of year for a winter-wheat site in south-central Kansas. The distances in cm (centimeters) indicate how far below the ground surface the measurement is being taken. Day 138 is 18 May, Day 150 is 30 May, Day 180 is 29 June. All data for 2002. Date collected and processed by Professor Richard Cuenca, Oregon State University. The maxima in the blue curve occur in the early afternoon.

These data, which are fairly typical, are consistent with our impression that the soil is usually cooler than the surface for most of the day during summertime. (The cooler surface temperatures on some days appear to be related to rainfall.)

The surface temperature for the same site appears in figure 10. Notice how the surface temperature peaks during the day about five degrees higher than at 7.5 centimeters during the first part of the data record, and then 10-15 degrees higher than the temperature at 7.5 centimeters late in the record. The change is related to cooling of the winter wheat (the sensor is measuring the temperature of the winter wheat) due to evapotranspiration during the first part of the record. Once the winter wheat stops growing and becomes golden, transpiration is no longer happening and the dry wheat and then the wheat stubble and ground surface are strongly heated by the sun.

site6sfctemp.JPG

Figure 10. For same site as Figure 4, except for surface temperature. Note that the wheat becomes golden (senescent, stops growing, is almost ready to harvest) around Day 150 (30 May).

The same happens to the bare ground at other sites – the surface is much warmer than the temperature 7.5 cm below the surface.
Have you been in a cave in the summertime? Caves, being farther from the surface, are even cooler. At the Devil’s Icebox, a cave not far from where I am writing this blog in Columbia, Missouri, the temperature stays at about 56°F (13°C) all year, even though the average summertime high temperature in Columbia is in the upper eighties (around 30° Celsius) and the average wintertime low temperature here is in the mid-teens (around -8° C).

So in the summer, the ground gets cooler as you dig down, — at least through the upper few meters. In the winter, the ground gets warmer farther down. And in caves, the temperature doesn’t change much at all. In fact, I once read that a cave temperature is a good first guess of the average above-ground air temperature at the cave’s location.

Similarly, people in many countries take advantage of the cool below-ground temperatures too store food during the hot summer. Also, some people take advantage of the temperature several feet below the surface to heat their homes in the winter and cool their homes in the summer.