Surface Temperature Field Campaign - Day 25
Friday, December 21st, 200721 December 2007
It is the last official day of the 2007 surface temperature field campaign. Although we will not know for several weeks the total number of schools that have participated and the total number of observations taken, it was a great success. It has been a lot of fun watching the observations come in and to post blogs a couple times a week. Of course, if you want to keep taking measurements into the new year, please do. I know of a couple schools that are going to do that.
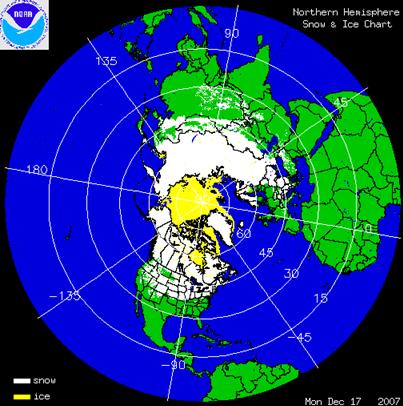
Here is an update on the snow situation. In North America, the snow has been melting back a bit in the center and eastern parts of the United States (Figure 1). You will also notice that there is a little more snow coverage in Eastern Europe. That is a common occurrence in the winter for cold air to move back a forth from the Eastern to the Western Hemisphere. When the cold weather was affecting the United States, Eastern Europe was warm. Now, it has flipped a little.
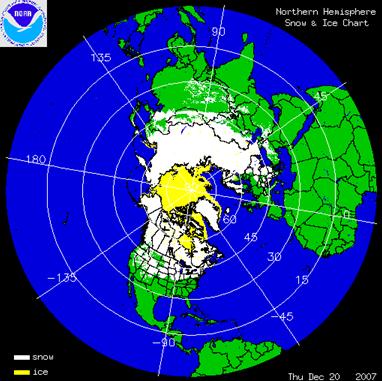
Figure 1. Snow extent in the Northern Hemisphere from 20 December 2007.
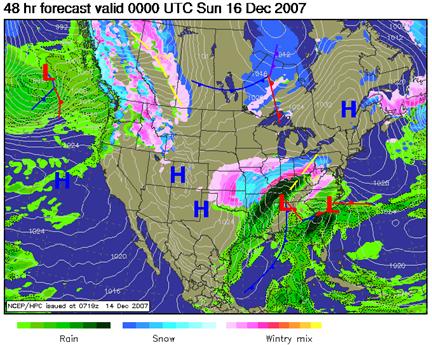
In the Western Hemisphere, there has been a fundamental change in the atmospheric flow. When it was cold and there were several major snow storms in the United States, the flow was out of Canada which is a source of cold air in the winter (Figure 2). This type of flow is called meridional. The upper level flow is at around 5500 meters above sea level. It steers the weather systems. This week, the pattern has changed and the upper level flow is sending weather systems from the Pacific Ocean into the west coast of the United States. Then the systems track across the United States. This type of flow is called zonal. This is bringing in warmer and moister air and is one of the reasons that the temperatures across much of the central part of the United States have gone above freezing.
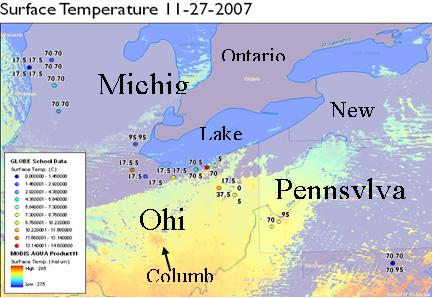
This shift in weather patterns is evident in the surface temperature observations that were recorded. On 17 December 2007, Rockhill Elementary School in Alliance, Ohio recorded a surface temperature 3.0° C where there was no snow in the parking lot to –5.4° C on their grassy field where there was 78 mm of snow. On 20 December 2007, the students at Rockhill Elementary School measured 4.5° C on the parking lot and 0.4° C on the snow covered field with 80 mm of snow. As you can see, the temperature of the snow pack warmed up to right around freezing.
It is the last official day of the 2007 surface temperature field campaign. Although we will not know for several weeks the total number of schools that have participated and the total number of observations taken, it was a great success. It has been a lot of fun watching the observations come in and to post blogs a couple times a week. Of course, if you want to keep taking measurements into the new year, please do. I know of a couple schools that are going to do that.
Here is an update on the snow situation. In North America, the snow has been melting back a bit in the center and eastern parts of the United States (Figure 1). You will also notice that there is a little more snow coverage in Eastern Europe. That is a common occurrence in the winter for cold air to move back a forth from the Eastern to the Western Hemisphere. When the cold weather was affecting the United States, Eastern Europe was warm. Now, it has flipped a little.
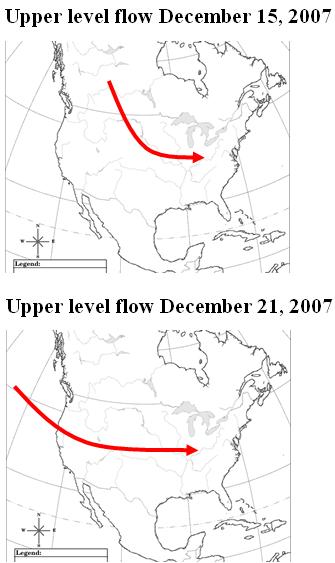
Figure 2. Upper level flow on 15 December 2007 (top) and 21 December 2007 (bottom).
In general, all of the measurements in the United States showed a warming from 17 December to 20 December. The warmest temperature for this past week was 12.4° C and was measured 20 December 2007 at Waynesboro High School in Waynesboro, Pennsylvania on their dry parking lot while the coldest temperature was measured at Eastwood Middle School, Pemberville, Ohio of –11.0° C where there was 83 mm of snow. If the students at Moosewood Farm Home School in Fairbanks, Alaska had reported this week, they would have reported the coldest temperature by far. The air temperature hovered between –35° C and –40° C. But, they did not report any temperatures. It was probably too cold for the students to go outside.
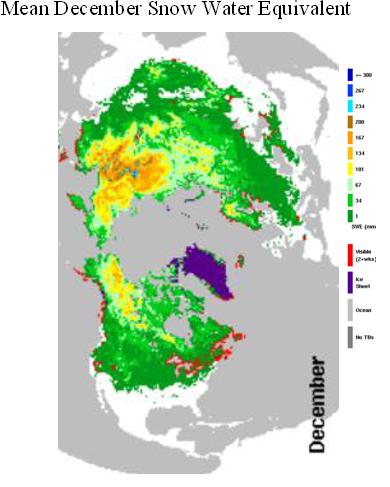
Below is a pair of figures that was recently published about the Arctic ice cover on the NASA Earth Observatory website along with an article (Figure 3). The 1978-2002 median value is shown as the yellow line (Median is the middle value of a bunch of numbers. For example, if you are one of five children, of ages 1, 3, 7, 11, and 13, the median age of the children in your family is 7 years). You can see that the ice melted in the Arctic Ocean to record low levels in September this year and recovered quite a bit by November. But, the ice extent is still far below the 1978-2002 median level.
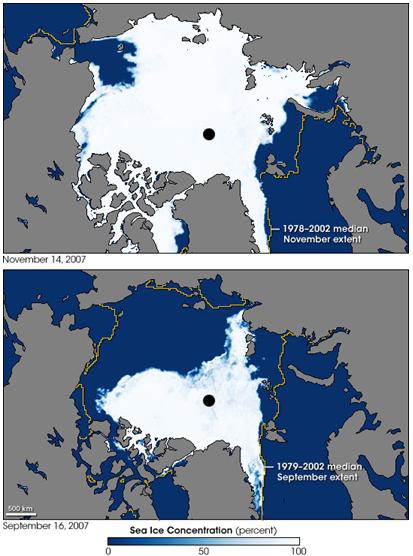
Figure 3. Ice extent compared to the 1979-2002 median extent for November (top) and September (bottom) 2007. Maps of ice extent from NASA Earth Observatory.
Schools involved in the surface temperature field campaign to date:
| Roswell Kent Middle School, Akron, Ohio, USA Rockhill Elementary School, Alliance, Ohio, USA Dalton High School, Dalton, Ohio, USA Chartiers-Houston Jr./Sr. High School, Houston, Pennsylvania, USA Cloverleaf High School, Lodi, Ohio, USA The Morton Arboretum Youth Education Dept., Lisle, Illinois, USA Mill Creek Middle School, Comstock Park, Michigan, USA Kilingi-Nomme Gymnasium, Parnumaa, Estonia Polaris Career Center, Middleburg Heights, Ohio, USA National Presbyterian School, Washington, DC, USA White Cloud Public, White Cloud, Michigan, USA Blue Valley High School, Stilwell, Kansas, USA Perkins Middle School, Akron, Ohio, USA Steeple Run School, Naperville, Illinois, USA Kittrell Elementary School, Waterloo, Iowa, USA Lorain Community College Early College High School, Elyria, Ohio, USA Ingomar Middle School, Pittsburgh, Pennsylvania, USA Moosewood Farm Home School, Fairbanks, Alaska, USA Roxboro Middle School, Cleveland Heights, Ohio, USA Bowling Green State University, Bowling Green, Ohio, USA Walailak University, Nakhon Si Thammarat, Thailand Massillon Middle School, Massillon, Ohio, USA Ida Elementary School, Ida, Michigan, USA Whitehall High School, Whitehall, Michigan, USA Taaksi Basic School, EE2914, Viljandimaa, Estonia Birchwood School, Cleveland, Ohio, USA Gimnazium in Toszek, Toszek, Poland Waynesboro Senior High School, Waynesboro, Pennsylvania, USA Eastwood Middle School, Pemberville, Ohio, USA Orange Elementary School, Waterloo, Iowa, USA Estes Park High School, Estes Park, Colorado, USA Hudsonville High School, Hudsonville, Michigan, USA University of Toledo, Toledo, Ohio, USA Main Street School, Norwalk, Ohio, USA |
Dr. C