U.S. Ethanol Expansion Driving Changes Throughout
the Agricultural Sector
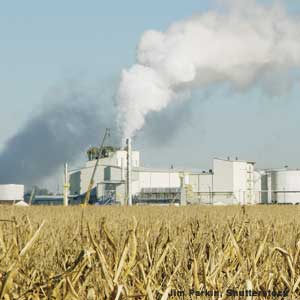
Explosive growth of ethanol
production brings adjustments to U.S. agriculture
that reach far beyond the corn sector.
Paul
C. Westcott
|
|
|
|
A
large expansion in ethanol production
is underway in the United States, spurred
by high oil prices and energy policies. |
|
|
Although
corn is the primary feedstock used to
produce ethanol in the United States,
market adjustments to the ethanol expansion
extend well beyond the corn sector.
|
|
|
Adjustments
in the agricultural sector to increased
demand for biofuels will continue as
interest in renewable sources of energy
grows. |
|
U.S. ethanol production climbed
to almost 5 billion gallons in 2006, up nearly 1 billion
gallons from 2005. Despite the speed and magnitude
of this increase, the industry is stepping up the
pace of expansion, with production expected to top
10 billion gallons by 2009.
The explosive growth of U.S. ethanol
production is being felt by nearly every aspect
of the field crops sector—domestic demand,
exports, prices, and the allocation of acreage among
crops—as well as the livestock sector, farm
income, government payments, and food prices. Additionally,
issues have been raised regarding possible effects
on natural resources resulting from the ethanol
expansion and changes in farmers’ cropping
choices. Adjustments in the agricultural sector
to this strong demand are underway and will continue
as interest builds in renewable sources of energy
to lessen dependence on foreign oil.
What’s Driving the
Boom in Ethanol Production?
Market conditions and policy factors
are fueling the rising interest in ethanol. A rapid
runup of oil prices over the past several years
has combined with provisions of the Energy Policy
Act of 2005 and already existing Federal and State
biofuel programs to provide economic incentives
for an expansion of U.S. ethanol production.
Crude oil prices, which averaged
less than $20 a barrel (refiners’ acquisition
cost for imports) in the 1990s, reached almost $68
in summer 2006, and averaged $59 for the year. This
increase in prices reflects rising global demand
for crude oil resulting from strong world economic
growth, including rapid manufacturing gains in China
and India. Further growth in global economic activity
will continue to drive up world demand for oil,
particularly in highly energy-dependent economies
in Asia. Although the increase in demand is likely
to be partly offset by future oil discoveries, new
technologies for finding and extracting oil, and
continued expansion and improvement in renewable
energy, oil prices are expected to remain high by
historical standards.
Further contributing to the interest
in ethanol, the Energy Policy Act of 2005 mandated
that renewable fuel use in gasoline (with credits
for biodiesel) reach 7.5 billion gallons by calendar
year 2012, with gains in later years in line with
growth in the volume of gasoline “sold or
introduced into commerce.” Additionally, the
legislation did not provide liability protection
for effects of methyl tertiary butyl ether (MTBE),
an oxygenating gasoline additive that has been found
to contaminate drinking water. As a result, blenders
have sharply reduced use of MTBE and switched to
ethanol as a fuel additive.
Federal tax laws also provide
incentives for biofuels. Under current law, blenders
can receive tax credits equal to 51 cents per gallon
of ethanol blended with gasoline. This makes ethanol
more economical to produce, as part of that credit
is, in effect, passed back from blenders to ethanol
producers. Additionally, ethanol imports are subject
to a tariff of 54 cents per gallon, although imports
from designated Central American and Caribbean countries
are duty-free up to a maximum of 7 percent of the
U.S. ethanol market.
In response to these strong incentives,
ethanol production capacity has risen sharply over
the past year as new plants have been built or are
under construction. With completion of the plants
currently under construction, production capacity
in the industry will exceed 12 billion gallons within
a few years. Ethanol production is expected to be
well above the renewable fuel standard mandated
in the 2005 Energy Policy Act. Although the ethanol
expansion is then expected to slow somewhat, even
with the industry operating at less than full capacity,
USDA’s 2007 long-term projections show ethanol
production growing to more than 12 billion gallons
by the middle of the next decade, assuming no changes
in policy or technology.
Ethanol Relatively Small
in the Gasoline Market but Large in Agriculture
Most of the current expansion
in ethanol production uses corn as the feedstock.
Although cellulosic-based production of renewable
fuels holds some longer-term promise, much research
is needed to make it commercially economical and
expand beyond the 250-million-gallon minimum specified
for 2013 in the Energy Policy Act of 2005.
Ethanol accounts for a small share
in the overall gasoline market, but its importance
to the corn market is relatively large. In 2006,
ethanol (by volume) represented about 3.5 percent
of motor vehicle gasoline supplies in the United
States. But 14 percent of the U.S. corn crop went
to ethanol production, a share projected to grow
to more than 30 percent by 2009/10 and to remain
at that level in subsequent years. Even so, by the
middle of the next decade, ethanol production (by
volume) is expected to represent less than 8 percent
of annual gasoline use in the United States. Thus,
while the growth in corn-based ethanol can contribute
to the Nation’s fuel supply, that contribution
is relatively small in the gasoline market but can
have large effects in the agricultural sector.
In Agricultural Markets,
Corn To Be Affected Most Directly…
The rapid expansion in ethanol
production will have far-reaching effects throughout
the agricultural sector. The corn
market is being affected directly by the increase
in ethanol production. As the ethanol industry absorbs
a larger share of the corn crop, higher prices will
affect domestic use and exports, providing for more
intense demand competition between domestic industries
and foreign buyers of feed grains.
Higher prices affect corn’s
role as an animal feed. Livestock feeding is the
largest use of U.S. corn, typically accounting for
50-60 percent of total utilization. According to
the USDA 2007 long-term projections, corn for animal
feeding is expected to decline to 40-50 percent
of total use over the next decade, as a result of
higher prices (see box, “What’s
the Difference Between Projections and Forecasts?”).
Increased use of U.S. corn for
ethanol production and higher corn prices also will
have important implications for global trade and
international markets. The United States typically
accounts for 60-70 percent of world corn exports;
however, higher corn prices are projected to reduce
this share to 55-60 percent over much of the next
decade—a result of reductions in foreign demand
and increases in foreign production.
Higher corn prices also will affect
farmers’ production decisions, as higher producer
returns provide economic incentives to increase
corn acreage. Much of this increase is likely to
occur as farmers adjust crop rotations between corn
and soybeans. Other sources of land for potential
increased corn plantings include cropland used as
pasture, land in fallow, acreage returning to production
from expiring Conservation Reserve Program (CRP)
contracts, and shifts from other crops, such as
cotton. According to USDA’s Acreage report,
(June 29, 2007), farmers planted nearly 93 million
acres to corn this year, up over 14 million acres,
or 18.6 percent, from 2006.
On balance, increased use of corn
to produce ethanol is projected to result in higher
corn prices, which will trigger reductions in other
uses and increases in supplies to bring the corn
market into equilibrium. Nonetheless, stronger ethanol
demand will result in lower carryover stocks of
corn. At the same time, ethanol demand is very inelastic
(unresponsive to price changes) in the range of
prices expected over the next decade and relative
to other major demands for corn, such as feed use
and exports. Thus, overall demand in the corn sector
is projected to become more inelastic as ethanol
production grows. In combination, these factors
will make the corn market more vulnerable to shocks,
such as production shortfalls due to weather, pests,
or other factors. Low
stocks provide limited buffers to shocks. As
demand for corn becomes more inelastic, a greater
change in market prices would be needed in response
to a shock to bring the market to equilibrium. Thus,
overall price variability and market volatility
in the agricultural sector are likely to increase.
…With Other Crops
Affected Indirectly
The jump in corn prices will initially
favor corn production over other crops. Soybeans
compete most directly with corn and on the largest
amount of land. Thus, soybean plantings and production
will likely take the brunt of the effect of the
expansion in corn plantings and will correspondingly
decline. In the Corn Belt, where producers frequently
rotate crops, with corn planted one year and soybeans
the next, some of the acreage shift can occur through
changes in rotational practices. For example, the
rotation might be changed to planting corn for 2
successive years, with soybeans planted every third
year. Based on USDA’s Acreage report,
much of the 2007 increase in U.S. corn acreage will
come from reduced soybean plantings, which are down
more than 11 million acres (15 percent) from 2006.
Reduced soybean production would
mean higher prices for soybeans, which would trigger
other adjustments in the soybean complex. As with
corn, higher soybean prices are expected to bring
a reduction in exports and lower levels of carryover
stocks, as well as higher prices for both soybean
meal and soybean oil. Any concurrent expansion in
the use of soybean oil to produce biodiesel would
also contribute to higher soybean and soybean oil
prices.
In some areas, plantings for other
crops that compete with corn or soybeans for acreage
are likewise projected to decline. For example,
cotton plantings for 2007 were down more than 4
million acres from the previous year in USDA’s
Acreage report.
Livestock Production Projected
To Decline
Higher corn prices reduce the
profitability of meat production because of corn’s
importance to the livestock sector as an animal
feed. In response, red meat production is projected
to decline in the United States and growth in poultry
output is likely to slow. The impact of higher corn
prices and feed costs is expected to be partially
offset by the greater availability of distillers’
grains (from ethanol production) as a substitute
source for feed.
Distillers’ grains are a
co-product of dry-mill ethanol production that can
be used for livestock feeding. As produced, distillers’
grains are relatively wet, with as much as 65-70
percent moisture content. This co-product can be
used in its wet form, or it can be dried and used
in a form with lower moisture content to facilitate
shipment over greater distances, including for export.
Additionally, distillers’ solubles from the
dry-mill ethanol production process, which include
other nutrients from corn, may be added to the distillers’
grains. Thus, the general term “distillers’
grains” refers to a number of forms of the
co-product, including wet distillers’ grains,
dried distillers’ grains, wet distillers’
grains with solubles, and dried distillers’
grains with solubles. Whether used in a wet or dried
form, however, distillers’ grains used in
livestock feed can replace some direct corn use,
as well as soybean meal, in some animal rations.
The effects of higher corn prices
will vary across livestock species, due to differences
in feed conversion efficiencies and constraints
on some animals’ ability to use distillers’
grains in rations. Distillers’ grains primarily
benefit ruminant animals like beef cattle and dairy
cows. Only limited amounts of distillers’
grains can be included in the rations of monogastric
animals like hogs and poultry.
According to USDA projections,
based on the different uses among the livestock
species and a number of other important underlying
assumptions, each bushel of corn used to produce
ethanol results, on aggregate, in a reduction of
about a fifth of a bushel of direct corn feeding,
due to the use of distillers’ grains in rations.
However, the substitution of distillers’ grains
in feed rations is expected to bring only a small
reduction in soybean meal use. Beef cattle are assumed
to be the largest users of distillers’ grains,
and beef cattle rations typically use urea as the
protein source rather than soybean meal.
Variability in the quality of
distillers’ grains from different sources—and
from the same source at different times—also
is a concern in the livestock sector. This lack
of consistency in nutrient content makes it more
difficult to determine the best use of distillers’
grains in livestock rations. Over time, adjustments
in the market for distillers’ grains can address
this issue. Adjustments in the ethanol production
process are likely to improve the consistency of
distillers’ grains for use in the livestock
sector. And, as the market develops further, livestock
producers will likely become more familiar with
the product and learn how to better manage it in
ration formulation.
Farm Income Higher and
Retail Food Prices Rise
Overall, ethanol expansion will
boost net farm income. Higher commodity prices over
the next several years, particularly for corn and
soybeans, are projected to bring large increases
in total farm cash receipts. But to some extent,
these gains are expected to be offset by somewhat
higher production expenses for inputs such as seed,
fertilizer, and livestock feed.
Higher prices for corn and other
crops also mean smaller government payments under
current farm commodity programs, particularly price-sensitive
marketing loan benefits and counter-cyclical payments.
In contrast, with higher crop prices, use of land
for production becomes more valuable, so new rental
rates for land enrolled in the CRP are likely to
rise. As a result, conservation payments and fixed
direct payments under the 2002 Farm Act (which do
not change with market prices) are projected to
account for a larger share of total direct government
payments, assuming no changes in policy.
With lower government payments,
the agricultural sector will rely on the market
for more of its income, and the share of income
provided by government payments is projected to
fall. Government payments, which averaged over 7
percent of gross cash income in 2000-05, are expected
to account for less than 4 percent during most of
the next decade—meaning that over 96 percent
of gross cash income would come from cash receipts
and farm-related income.
While the ethanol boom can be
expected to bring higher incomes to farmers and
reduce government outlays for farm programs, it
will also most likely mean higher food prices for
consumers. Retail price increases for red meats,
poultry, and eggs are projected to exceed the general
inflation rate in 2008-10, as the livestock sector
adjusts to higher feed costs. As a result, overall
retail food prices would rise faster than the general
inflation rate in those years.
| What’s
the Difference Between Projections and Forecasts?
|
|
The
discussion presented in this article is based
on USDA’s long-term agricultural projections
to 2016, released in February 2007. These
projections, however, are not forecasts for
the future.
Projections are based on
a specific set of assumptions, such as a continuation
of current farm legislation. These conditioning
assumptions are usually designed to provide
a neutral backdrop for the projections to
allow the analyses to focus on key long-term
underlying factors. For example, projections
would typically assume longrun trend growth
rates for key macroeconomic variables rather
than forecasting the timing of business cycles.
And normal weather with trend growth for crop
yields would be assumed for projections. Thus,
USDA’s long-term projections represent
one plausible scenario for the next 10 years.
In contrast, forecasts focus
on predicting actual outcomes. Forecasts incorporate
additional information that departs from the
neutral assumptions of the long-term projections
and thus can produce different results. For
example, forecasters may consider what will
happen under pending farm legislation if they
believe the legislation will be enacted. A
forecast may also predict the timing of business
cycles in the general economy. |
|