|
DIMETHYL PHTHALATE (DMP)
DIETHYL PHTHALATE (DEP)
DIBUTYL PHTHALATE (DBP)
DI-2-ETHYLHEXYL PHTHALATE (DEHP)
DI-n-OCTYL PHTHALATE (DNOP)
| Method number: |
104 |
|
| Matrix: |
Air |
|
|
|
| Target concentration: |
| 5 mg/m3 |
5 mg/m3 |
5 mg/m3 |
5 mg/m3 |
5 mg/m3 |
| TWA |
TWA |
TWA |
TWA |
TWA |
|
|
| OSHA PEL: |
| 5 mg/m3 |
None |
5 mg/m3 |
5 mg/m3 |
None |
| TWA |
|
TWA |
TWA |
|
|
|
| ACGIH TLV: |
| 5 mg/m3 |
5 mg/m3 |
5 mg/m3 |
5 mg/m3 |
None |
| TWA |
TWA |
TWA |
TWA |
|
|
|
|
10 mg/m3 |
|
|
|
|
STEL |
|
|
|
|
| Procedure: |
Samples are collected by drawing known
volumes of air through OVS-Tenax sampling tubes. Samples are desorbed with toluene and
analyzed by GC using a flame ionization detector (FID). |
|
| Recommended air volume and sampling rate: |
240 L at 1.0 L/min |
|
|
|
| Reliable quantitation limits: |
| 90 µg/m3 |
68 µg/m3 |
34 µg/m3 |
55 µg/m3 |
45 µg/m3 |
|
|
| Standard errors of estimate: |
|
|
| Status of method: |
Evaluated method. This method has been subjected to the established
evaluation procedures of the Organic Methods Evaluation Branch. |
|
|
| Date: August 1994 |
Chemist: Yihlin Chan |
Organic Methods Evaluation Branch
OSHA Salt Lake Technical Center
Salt Lake City, UT 84165-0200
1. General Discussion
1.1 Background
1.1.1 History
Airborne phthalates have been collected in ethylene glycol
(Ref. 5.1), on mixed cellulose ester membrane filters (Ref. 5.2), and on Tenax GC
adsorbent (Ref. 5.3). The analytical methods include GC/FID, GC/MS, GC/ECD, and HPLC/UV.
An OSHA stopgap method specifies collection on OVS-2 (OSHA Versatile Sampler), desorption
with carbon disulfide and analysis by GC/FID (Ref. 5.4). OVS samplers, with a glass fiber
filter in front to stop droplets and sorbent behind to adsorb vapor, are ideal for
collecting contaminants that may be present as both aerosol and vapor. The author of the
stopgap study found that most of the phthalates spiked on the glass fiber filters migrated
to the resin bed after 60 L of air had been drawn through them, indicating that filters
alone would not be sufficient. However, XAD-2 resin used in the OVS-2 is difficult to work
with. During the transfer of the resin from the sample tube to a vial, many resin beads
cling to the glass wall and are impossible to dislodge. For these reasons OVS-Tenax was
selected for the collection of airborne phthalates.
1.1.2 Toxic effects (This section is for information only
and should not be taken as the basis of OSHA policy.)
Dimethyl phthalate (DMP). DMP is of low to moderate
toxicity, but when accidentally ingested in large amounts it may cause gastrointestinal
irritation, central nervous system depression with coma, and hypotension. It is an
irritant to the eyes and the mucous membranes. It is not irritant to the skin and is not
absorbed. DMP is not known to cause cancer in humans or animals. (Ref. 5.5)
Diethyl phthalate (DEP). Adverse effects on humans
from exposure to DEP have not been reported. DEP has caused death in animals given very
high doses by mouth, but brief oral exposures to lower doses caused no harmful effects.
The only effect found in animals that ate high doses of DEP for long periods of time was a
decrease in weight gain because they ate less food. DEP is not known to cause cancer in
humans or animals. DEP does not appear to affect the ability of male animals to sire
offspring. However, a decrease occurred in the number of live offspring born to female
animals that were exposed to DEP throughout their lives. Some birth defects occurred in
newborn rats whose mothers received high doses (approximately 3 g/kg) of DEP by injection
during pregnancy. DEP can be mildly irritating when applied to the skin of animals. It can
also be slightly irritating when put directly into the eyes of animals. (Ref. 5.6)
Dibutyl phthalate (DBP). Adverse effects on humans
from exposure to DBP have not been reported. In animals, eating large amounts of DBP can
affect their ability to reproduce. DBP can cause death of unborn animals. In male animals,
sperm production can decrease after eating large amounts of DBP. However, when exposure to
DBP stops, sperm production seems to return to near normal levels. Exposure to high levels
of DBP might cause similar effects in humans as in animals, but this is not known. There
is no evidence that DBP causes cancer, but this has not been thoroughly studied. (Ref. 5.7)
Di-2-ethylhexyl phthalate (DEHP). From animal
studies, breathing DEHP does not appear to have serious harmful effects. Studies in rats
have shown that DEHP in the air has no effect on lifespan or the ability to reproduce.
However, eating high doses of DEHP for a long time resulted in liver cancer in rats and
mice. The U.S. Department of Health and Human Services has determined that DEHP may
reasonably be anticipated to be a carcinogen. (Ref. 5.8) IARC designated DEHP to Group 2B
(possibly carcinogenic to humans) (Ref. 5.9). Short-term exposures to DEHP interfered with
sperm formation in mice and rats. These effects were reversible, but the process of sexual
maturation was delayed when the animals were exposed before puberty. Short-term exposures
appeared to have no effect on male fertility. After long-term exposures, fertility of both
male and female rats was decreased. Studies of pregnant mice and rats exposed to DEHP
resulted in effects on the development of the fetus, including malformation of fetus and
reduction in neonatal weights and survival. Long-term exposure of animals to DEHP resulted
in structural and functional changes in the kidney. (Ref. 5.8)
Di-n-octyl phthalate (DNOP) . DNOP may cause
irritation to the skin and may cause severe irritation and possible corneal damage to the
eyes. Ingestion may cause central nervous system depression with nausea, vomiting,
dizziness, weakness, headache, and difficult respiration. A large dose is required to
cause death in animals. (Ref. 5.10)
1.1.3 Workplace exposure
DMP is used as a solvent and plasticizer for cellulose
acetate and cellulose acetate-butyrate formulations. During World War II it
was used effectively as a mosquito and insect repellant. Occupational exposure may occur
in industrial facilities where DMP is manufactured or used in its various applications. No
data on the extent of workplace exposure were found. (Ref. 5.5)
DEP is used as a plasticizer for cellulose ester plastic
films and sheets (photographic, blister packaging, and tape applications) and molded and
extruded articles (consumer articles such as toothbrushes, automotive components, tool
handles, and toys). DEP was reported as an ingredient in 67 cosmetic formulations at
concentrations ranging from <0.1% to 25-50%. These cosmetics included bath preparations
(oils, tablets, and salts), eye shadows, toilet waters, perfumes and other fragrance
preparations, hair sprays, wave sets, nail polish and enamel removers, nail extenders,
nail polish, bath soaps, detergents, aftershave lotions, and skin care preparations. In
addition, DEP is used as a component in insecticide sprays and mosquito repellents, as a
camphor substitute, as a plasticizer in solid rocket propellants, as a wetting agent, as a
dye application agent, as an ingredient in aspirin coatings, as a diluent in polysulfide
dental impression materials, and in adhesives, plasticizers, and surface lubricants used
in food and pharmaceutical packaging. Human exposure to DEP can result from breathing
contaminated air, eating foods into which DEP has leached from packaging materials, eating
contaminated seafood, drinking contaminated water, or as a result of medical treatment
involving the use of PVC tubing (e.g., dialysis patients). The use of DEP in consumer
products, however, is likely to be the primary source of human exposure. DEP has been
detected in adipose tissue samples taken from people (including children) nationwide.
Occupational exposure may occur in industrial facilities where DEP is used in the
manufacture of plastics or consumer products. (Ref. 5.6)
DBP is used primarily as a specialty plasticizer for
nitrocellulose, polyvinyl acetate, and polyvinyl chloride. It has been used in plastisol
formulations for carpet back coating and other vinyl compounds. DBP has also been used as
an adjusting agent for lead chromate pigments, as a concrete additive, as an insect
repellant for the impregnation of clothing, as a solvent for perfume oils, and as a
stabilizer in rocket propellants. DBP is widespread in the environment and has been
identified at low levels in air, water, and soil. Therefore, humans may be exposed to DBP
by inhalation of air or by ingestion of water or food containing DBP. Individuals who
manufacture or use specialty plasticizers would have the highest potential for exposure to
DBP. No data were located on typical exposure levels in the workplace. (Ref. 5.7)
DEHP is principally used as a plasticizer in the production
of polyvinyl chloride (PVC) and vinyl chloride resins. Estimates are that at least 95% of
the DEHP produced ends up in these uses. PVC is flexible and is used in many common items
such as toys, vinyl upholstery, shower curtains, adhesives, coatings, and as components of
paper and paperboard. PVC is also used to produce disposable medical examination and
surgical gloves, the flexible tubing used to administer parenteral solutions, and the
tubing used in hemodialysis treatment. Non-plasticizer uses include the use of DEHP as a
solvent in erasable ink; as an acaricide in orchards; as an inert ingredient in pesticide
products, cosmetics, and vacuum pump oil; as a component of dielectric fluids in
electrical capacitors; to detect leaks in respirators; and to test air filtration systems.
DEHP is a ubiquitous environmental contaminant. The principal route of human exposure to
DEHP is ingestion of contaminated food, especially fish, seafood, or fatty foods, with an
estimated daily dose of about 0.25 mg. The highest exposures to DEHP result from medical
procedures such as blood transfusions or hemodialysis, during which DEHP may leach from
plastic equipment into biological fluids. Workers in industries manufacturing or using
DEHP plasticizer may be frequently exposed to above average levels of this compound. (Ref. 5.8)
DNOP is used as a plasticizer in the production of
polyvinyl chloride and vinyl chloride resins. Occupational exposure may occur in the
workplace where this compound is used. No data on the extent of workplace exposure were
found. (Ref. 5.10)
1.1.4 Physical properties and other descriptive information (Ref. 5.11)
Dimethyl phthalate
| CAS no.: |
131-11-3 |
|
| synonyms: |
1,2-benzenedicarboxylic acid, dimethyl ester;
phthalic acid, dimethyl ester; dimethyl 1,2-benzenedicarboxylate; dimethyl o-phthalate;
Avolin; DMP; Fermine; Palitinol M; Unimoll DM; RCRA U102 |
| structural formula: |
 |
| molecular wt: |
194.19 |
| boiling point: |
284°C |
| melting point: |
0 - 2°C |
| appearance: |
colorless to pale yellow oily liquid |
| odor: |
slight aromatic odor |
| specific gravity: |
1.1905 |
| vapor pressure: |
less than 1.3 Pa (0.01 mmHg) at 25°C |
| flash point: |
146°C (closed-cup) |
| solubility: |
soluble in benzene, alcohol, ether,
chloroform; slightly soluble in mineral oil; practically insoluble in petroleum ether and
other paraffin hydrocarbons |
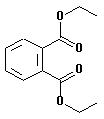
Diethyl phthalate
| CAS no.: |
84-66-2 |
| synonyms: |
diethyl 1,2-benzenedicarboxylate; ethyl
phthalate; Neantine; Palatinol A; o-benzenedicarboxylic acid diethyl ester;
Placidol E; 1,2-benzenedicarboxylic acid, diethyl ester; phthalic acid, diethyl ester;
phthalol; DEP; "Kodaflex" DEP Plasticizer; RCRA U088 |
| structural formula: |
 |
| molecular wt: |
222.24 |
| boiling point: |
298°C |
| melting point: |
-41°C |
| appearance: |
colorless liquid |
| odor: |
odorless |
| specific gravity: |
1.1175 |
| vapor pressure: |
1.9 kPa (14 mmHg) at 163°C, 0.22 Pa
(1.65×10⁻³ mmHg) at 25°C |
| flash point: |
140°C (open cup) |
| solubility: |
soluble in alcohol, ether, acetone, benzene;
moderately soluble in aliphatic solvents |
Dibutyl phthalate
| CAS no.: |
84-74-2 |
| synonyms: |
phthalic acid, dibutyl ester; di-n-butyl
phthalate; butyl phthalate; o-benzenedicarboxylic acid, dibutyl ester; dibutyl
1,2-benzenedicarboxylate; dibutyl phthalate ester; benzene-o-dicarboxylic acid, di-n-butyl
ester; DBP; Celluflex DBP; Elanol; Polycizer DBP; PX 104; Staflex DBP; bis-n-butyl
phthalate; n-butyl phthalate; dibutyl o-phthalate |
| structural formula: |
 |
| molecular wt: |
278.35 |
| boiling point: |
340°C |
| melting point: |
-35°C |
| appearance: |
colorless to faint yellow oily liquid |
| odor: |
weak aromatic odor |
| specific gravity: |
1.047 |
| vapor pressure: |
less than 1.3 Pa (0.01 mmHg) at 20°C |
| flash point: |
157°C (closed-cup); 171°C (open cup) |
| solubility: |
soluble in acetone, alcohol, ether, benzene,
and other common organic solvents |
Di-(2-ethylhexyl) phthalate
| CAS no.: |
117-81-7 |
| synonyms: |
bis-(2-ethylhexyl) phthalate;
1,2-benzenedicarboxylic acid, bis-(2-ethylhexyl) ester; DEHP; octyl phthalate; ethylhexyl
phthalate; Bisoflex 81; phthalic acid, dioctyl ester; phthalic acid, bis-(2-ethylhexyl)
ester; diethylhexyl phthalate; dioctyl phthalate; di-(ethylhexyl) phthalate; 2-ethylhexyl
phthalate; Fleximel; Flexol DOP; Kodaflex DOP; Octoil; RCRA U028 |
| structural formula: |
 |
| molecular wt: |
390.6 |
| boiling point: |
384°C |
| melting point: |
-55°C |
| appearance: |
colorless to pale yellow oily liquid |
| odor: |
almost odorless |
| specific gravity: |
0.981 |
| vapor pressure: |
0.18 kPa (1.32 mmHg) at 200°C |
| flash point: |
215°C (open cup) |
| solubility: |
soluble in hexane, mineral oil |
Di-n-octyl phthalate
| CAS no.: |
117-84-0 |
| synonyms: |
phthalic acid, dioctyl ester; o-benzenedicarboxylic
acid, dioctyl ester; 1,2-benzenedicarboxylic acid, dioctyl ester; DNOP; Dinopol NOP; di-n-octyl
phthalate; dioctyl o-phthalate; octyl phthalate; n-octyl
phthalate; Vinicizer 85; RCRA U107 |
| structural formula: |
 |
| molecular wt: |
390.6 |
| boiling point: |
220°C at 0.67 kPa (5 mmHg) |
| melting point: |
-30°C |
| appearance: |
light-colored liquid |
| odor: |
odorless |
| specific gravity: |
0.9861 |
| vapor pressure: |
less than 27 Pa (0.2 mmHg) at 150°C |
| flash point: |
209°C (closed-cup) |
| solubility: |
soluble in mineral oil, dimethyl sulfoxide, ethanol, benzene |
The analyte air concentrations throughout this method are
based on the recommended sampling and analytical parameters.
1.2 Limit defining parameters
1.2.1 Detection limit of the analytical procedure
The detection limits of the analytical procedure are 0.16,
0.13, 0.10, 0.09, and 0.10 ng for DMP, DEP, DBP, DEHP, and DNOP, respectively. These are
the amounts of analytes that will give responses that are significantly different from the
background responses of reagent blanks. (Sections 4.1 and 4.2)
1.2.2 Detection limit of the overall procedure
The detection limits of the overall procedure are 6.5, 4.8,
2.4, 3.9, and 3.3 µg per sample (27, 20, 10, 16, and 14 µg/m3)
for DMP, DEP, DBP, DEHP, and DNOP, respectively. These are the amounts of analyte spiked
on the sampler that will give responses that are significantly different from the
background responses of sampler blanks. (Sections 4.1 and 4.3)
1.2.3 Reliable quantitation limit
The reliable quantitation limits are 21.7, 16.2, 8.1, 13.1,
and 10.9 µg per sample (90, 68, 34, 55, and 45 µg/m3) for DMP,
DEP, DBP, DEHP, and DNOP, respectively. These are the amounts of analyte spiked on a
sampler that will give signals that are considered the lower limits for precise
quantitative measurements. (Section 4.4)
1.2.4 Precision (analytical procedure)
The precisions of the analytical procedure, measured as the
pooled relative standard deviations over a concentration range equivalent to 0.5 to 2
times the target concentration, are 0.35%, 0.54%, 0.45%, 1.15%, and 1.57% for DMP, DEP,
DBP, DEHP, and DNOP, respectively. (Section 4.5)
1.2.5 Precision (overall procedure)
The precisions of the overall procedure at the 95%
confidence level for the ambient temperature 15-day storage tests (at the target
concentration) are ±13.4%, ±13.0%, ±10.9%, ±10.6%, and ±10.8% for DMP, DEP, DBP,
DEHP, and DNOP, respectively (Section 4.6). These include additional 5% for sampling error.
1.2.6 Recovery
The recovery of phthalates from samples used in 15-day storage tests remained above
99.6%, 93.1%, 99.1%, 99.8%, and 99.6% for DMP, DEP, DBP, DEHP, and DNOP, respectively, when
the samples were stored at ambient temperature. (Section 4.7)
1.2.7 Reproducibility
Twelve samples collected from controlled test atmospheres
of mixed phthalates, and a draft copy of this procedure, were submitted to an SLTC organic
service branch for analysis. The samples were analyzed after 13 days of storage at ambient
temperature. No individual sample result deviated from its theoretical value by more than
the precisions reported in Section 1.2.5. (Section 4.8)
2. Sampling Procedure
2.1 Apparatus
2.1.1 A personal sampling pump, calibrated to ±5% of the recommended flow rate with the sampling device attached.
2.1.2 OVS-Tenax sampling tube. The sampling tubes used in
this study were obtained from SKC (catalog number 226-56 (OVS)). The tube contains a glass
fiber filter and two sections of Tenax adsorbent separated by a foam plug.
2.2 Reagents
None required.
2.3 Technique
2.3.1 Attach the sampler to the sampling pump with a piece
of flexible tubing and place it in the worker's breathing zone. Air should enter the
larger end of the tube.
2.3.2 Air should not pass through any hose or tubing before entering the sampling tube.
2.3.3 After sampling replace the plastic caps. Wrap each sample with a Form OSHA-21 seal.
2.3.4 Record air volume for each sample.
2.3.5 Submit at least one blank with each set of samples.
Blanks should be handled in the same manner as samples, except no air is drawn through them.
2.3.6 List any compounds that could be considered potential interferences.
2.4 Sampler capacity
Sampling capacity is determined by measuring how much air
can be sampled before breakthrough occurs. Breakthrough is considered to occur when the
effluent from the sampler contains a concentration of analyte that is 5% of the upstream
concentration (5% breakthrough). The sampler capacity for DMP was determined to be over
305 L at a sampling rate of 1.0 L/min with DMP concentration of 10 mg/m3 (2
times the target concentration). The sampler capacities for the other four phthalates
exceeded 300 L. (Section 4.9)
2.5 Desorption efficiency
2.5.1 The average desorption efficiencies for phthalates
from the OVS-Tenax, over the range of 0.5 to 2.0 times the target concentration, were
98.4%, 99.3%, 99.8%, 99.5%, and 98.6% for DMP, DEP, DBP, DEHP, and DNOP, respectively.
(Section 4.10.1)
2.5.2 The desorption efficiencies at 0.05, 0.1, and 0.2
times the target concentration (TC) are listed below. (Section 4.10.1)
| Table 2.5.2 |
Desorption efficiencies (%) at
0.05, 0.1, and 0.2 times the target concentration |
|
|
DMP |
DEP |
DBP |
DEHP |
DNOP |
|
| 0.05× TC |
91.3 |
99.9 |
101.4 |
98.3 |
99.4 |
| 0.1 × TC |
91.4 |
98.8 |
97.6 |
95.5 |
92.2 |
| 0.2 × TC |
95.1 |
100.2 |
100.1 |
99.8 |
94.9 |
|
2.5.3 Desorbed samples remain stable for at least 24 h. (Section 4.10.2)
2.6 Recommended air volume and sampling rate
2.6.1 For TWA samples, the recommended air volume is 240 L at 1.0 L/min.
2.6.2 For STEL samples, the recommended air volume is 15 L at 1.0 L/min.
2.6.3 With short-term samples, the air concentration equivalents to the reliable quantitation limits necessarily become larger. For example,
the reliable quantitation limit is 0.87 mg/m3 for DEHP when 15 L is collected.
2.7 Interferences (sampling)
2.7.1 Generally the presence of other organic contaminants
in the air will reduce the capacity of the sampler to collect these phthalates.
2.7.2 Suspected interferences should be reported to the laboratory with submitted samples.
2.8 Safety precautions (sampling)
2.8.1 The sampling equipment should be attached to the worker in such a manner that it will not interfere with work performance or safety.
2.8.2 All safety practices that apply to the work area being sampled should be followed.
3. Analytical Procedure
3.1 Apparatus
3.1.1 A GC equipped with an FID. A Hewlett-Packard 5890 GC
equipped with an FID and a 7673 autosampler were used in this evaluation.
3.1.2 A GC column capable of separating DMP, DEP, DBP,
DEHP, DNOP, the internal standard, and any interferences. A 5-m HP-1 (0.53-mm i.d., 2.65-µm
film) column was used in this evaluation.
3.1.3 An electronic integrator or other suitable means of measuring detector response.
A Waters 860 Networking Computer System was used in this evaluation.
3.1.4 Glass vials, 4.5-mL, with poly(tetrafluoroethylene)-lined caps for
desorbing samples. WISP vials were used in this study.
3.1.5 A dispenser capable of delivering 4.0 mL of desorbing solvent.
3.2 Reagents
3.2.1 Dimethyl phthalate. Dimethyl phthalate, 99%, was obtained from Aldrich.
3.2.2 Diethyl phthalate. Diethyl phthalate, 99%, was obtained from Kodak.
3.2.3 Dibutyl phthalate. Di-n-butyl phthalate, 99%, was obtained from Kodak.
3.2.4 Di-2-ethylhexyl phthalate. Di-2-ethylhexyl phthalate, 98%, was obtained from Aldrich.
3.2.5 Di-n-octyl phthalate. Di-n-octyl phthalate, EP grade, was obtained from Tokyo Kasei.
3.2.6 Toluene. Toluene, Optima grade, was obtained from Fisher.
3.2.7 1-Phenyldodecane. 1-Phenyldodecane, 99%, was obtained from Aldrich.
3.2.8 Desorbing solvent with internal standard. Dissolve 0.36 mL of 1-phenyldodecane in 1 L of toluene.
3.3 Standard preparation
3.3.1 Prepare stock standards by diluting weighed amounts of phthalate in desorbing solvent.
3.3.2 Prepare analytical standards by diluting the stock standards with desorbing
solvent. For each phthalate, a 300 µg/mL standard solution corresponds to the target concentration.
3.3.3 Prepare a sufficient number of analytical standards to generate a calibration
curve. Analytical standard concentrations must bracket sample concentrations.
3.4 Sample preparation
3.4.1 Transfer the glass fiber filter, Tenax resin of the front section, and the middle foam plug to a WISP vial.
3.4.2 Transfer the Tenax resin of the back section and the back foam to another WISP vial.
3.4.3 Add 4.0 mL of the desorbing solvent to each vial.
3.4.4 Cap the vials and shake them on a mechanical shaker for 30 min.
3.5 Analysis
3.5.1 GC conditions
| column: |
HP-1 (5 m, 0.53-mm i.d., 2.65-µm film) |
| zone temp: |
column |
1 min at 75°C, ramp to 270°C at 15°C/min,
1 min at 270°C |
|
injector |
270°C |
|
detector |
275°C |
| gas flow: |
column (He) |
5.53 mL/min |
|
auxiliary (N2) |
30 mL/min |
|
hydrogen |
32 mL/min |
|
air |
395 mL/min |
|
split vent |
53 mL/min (split ratio 10:1) |
| injection volume: |
1 µL |
|
| retention times: |
DMP |
6.0 min |
|
DEP |
7.1 min |
|
1-phenyldodecane |
9.3 min (ISTD) |
|
DBP |
9.6 min |
|
DEHP |
12.9 min |
|
DNOP |
13.8 min |

Figure 3.5.1. Chromatogram at target concentration. Key: 1 = DMP, 2 = DEP, 3 = 1-phenyldodecane (ISTD), 4 = DBP, 5 = DEHP, 6 = DNOP.
3.5.2 Measure peak areas by an electronic integrator or other suitable means.
3.5.3 Use an internal standard (ISTD) calibration method.
Prepare a calibration curve by plotting micrograms per sample versus ISTD-corrected
response of standards. Bracket the samples with analytical standards.
Figure 3.5.3.1 Calibration curve of DMP
Figure 3.5.3.2. Calibration curve of DEP.

Figure3.5.3.3. Calibration curve of DBP.

Figure 3.5.3.4. Calibration curve of DEHP.
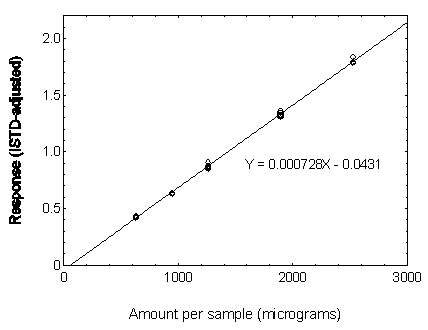
Figure 3.5.3.5. Calibration curve of DNOP.
3.6 Interferences (analytical)
3.6.1 Any compound that produces an FID response and has a
similar retention time as any of the analytes or internal standard is a potential
interference. If any potential interferences were reported, they should be considered
before samples are desorbed. Generally, chromatographic conditions can be altered to
separate an interference from the analyte.
3.6.2 When necessary, the identity or purity of an analyte
peak may be confirmed with additional analytical data (Section 4.11).
3.7 Calculations
The amount (in micrograms) of a phthalate per sample is
obtained from the appropriate calibration curve. The back section is analyzed primarily to
determine the extent of breakthrough. If any analyte is found on the back section, it is
added to the amount found on the front section. This total amount is then corrected by
subtracting the total amount (if any) found in the blank. The air concentration is
calculated using the following formula.
| mg/m3 = |
micrograms of phthalate per sample
liters of air sampled × desorption efficiency |
3.8 Safety precautions (analytical)
3.8.1 Adhere to the rules set down in your Chemical Hygiene Plan.
3.8.2 Avoid skin contact and inhalation of all chemicals.
3.8.3 Wear safety glasses and a lab coat at all times while in the lab area.
4. Backup Data
4.1 Determination of detection limits
Detection limits (DL), in general, are defined as the
amount (or concentration) of analyte that gives a response (YDL) that is
significantly different (three standard deviations (SDBR)) from the background
response (YBR).
YDL - YBR = 3(SDBR)
The direct measurement of YBR and SDBR
in chromatographic methods is typically inconvenient and difficult because YBR
is usually extremely low. Estimates of these parameters can be made with data obtained
from the analysis of a series of analytical standards or samples whose responses are in
the vicinity of the background response. The regression curve obtained for a plot of
instrument response versus concentration of analyte will usually be linear. Assuming SDBR
and the precision of data about the curve are similar, the standard error of estimate
(SEE) for the regression curve can be substituted for SDBR in the above
equation. The following calculations derive a formula for DL:
| Yobs |
= |
observed response |
| Yest |
= |
estimated response from regression curve |
| n |
= |
total no. of data points |
| k |
= |
2 for a linear regression curve |
At point YDL on the regression curve
| YDL = A(DL) + YBR |
A = analytical sensitivity (slope) |
therefore
Substituting 3(SEE) + YBR for YDL gives
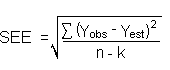
4.2 Detection limit of the analytical procedure (DLAP)
The DLAP is measured as the mass of analyte actually
introduced into the chromatographic column. Ten analytical standards whose concentrations
were equally spaced from 0 to 12.5 µg/mL were prepared. The standard containing
12.5 µg/mL represented approximately 10 times the baseline noise for all analytes.
These solutions were analyzed with the recommended analytical parameters (1 µL
injection with 10:1 split). The data obtained were used to determine the required
parameters (A and SEE) for the calculation of the DLAP. These parameters and the
calculated DLAP's for the five phthalates are listed below.
| Table 4.2.1 |
| Summary of the calculated A,
SEE, and DLAP |
|
|
DMP |
DEP |
DBP |
DEHP |
DNOP |
|
| A(ng-1) |
0.0211 |
0.0260 |
0.0247 |
0.0232 |
0.0201 |
| SEE |
0.00115 |
0.00110 |
0.000812 |
0.000725 |
0.000677 |
| DLAP (ng) |
0.16 |
0.13 |
0.10 |
0.09 |
0.10 |
|
| Table 4.2.2 |
Detection Limit of the Analytical Procedure
for DMP |
|
| concentration |
mass on column |
ISTD-adjusted |
| (µg/mL) |
(ng) |
(response) |
|
| 0.00 |
0.000 |
0.000000 |
| 1.23 |
0.123 |
0.000000 |
| 2.46 |
0.246 |
0.006172 |
| 3.69 |
0.369 |
0.007495 |
| 4.92 |
0.492 |
0.009049 |
| 6.15 |
0.615 |
0.011572 |
| 7.38 |
0.738 |
0.013412 |
| 8.61 |
0.861 |
0.018499 |
| 9.84 |
0.984 |
0.019438 |
| 11.07 |
1.107 |
0.022577 |
| 12.30 |
1.230 |
0.025851 |
|
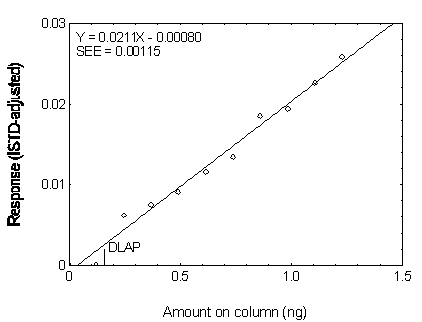
Figure 4.2.2. Plot of the data for determining the DLAP of DMP.
| Table 4.2.3 |
Detection Limit of the Analytical Procedure
for DEP |
|
| concentration |
mass on column |
ISTD-adjusted |
| (µg/mL) |
(ng) |
(response) |
|
| 0.00 |
0.000 |
0.000000 |
| 1.24 |
0.124 |
0.003659 |
| 2.48 |
0.248 |
0.008365 |
| 3.72 |
0.372 |
0.011870 |
| 4.96 |
0.496 |
0.014416 |
| 6.20 |
0.620 |
0.015966 |
| 7.44 |
0.744 |
0.020705 |
| 8.68 |
0.868 |
0.023028 |
| 9.92 |
0.992 |
0.025402 |
| 11.16 |
1.116 |
0.031727 |
| 12.40 |
1.240 |
0.032579 |
|

Figure 4.2.3. Plot of the data used for determining the DLAP of DEP.
| Table 4.2.4 |
Detection Limit of the
Analytical Procedure
for DBP |
|
| concentration |
mass on column |
ISTD-adjusted |
| (µg/mL) |
(ng) |
(response) |
|
| 0.00 |
0.000 |
0.000000 |
| 1.24 |
0.124 |
0.003495 |
| 2.47 |
0.247 |
0.006206 |
| 3.71 |
0.71 |
0.009197 |
| 4.94 |
0.494 |
0.012034 |
| 6.18 |
0.618 |
0.014716 |
| 7.41 |
0.741 |
0.020491 |
| 8.65 |
0.865 |
0.021137 |
| 9.88 |
0.988 |
0.023602 |
| 11.12 |
1.112 |
0.027755 |
| 12.36 |
1.236 |
0.030736 |
|

Figure 4.2.4. Plot of the data used for determining the DLAP of DBP.
| Table 4.2.5 |
Detection Limit of the
Analytical Procedure
for DEHP |
|
| concentration |
mass on column |
ISTD-adjusted |
| (µg/mL) |
(ng) |
(response) |
|
| 0.00 |
0.000 |
0.009830 |
| 1.25 |
0.125 |
0.012161 |
| 2.49 |
0.249 |
0.015005 |
| 3.74 |
0.374 |
0.016568 |
| 4.99 |
0.499 |
0.020997 |
| 6.23 |
0.623 |
0.022298 |
| 7.48 |
0.748 |
0.025840 |
| 8.73 |
0.873 |
0.029510 |
| 9.97 |
0.997 |
0.031756 |
| 11.22 |
1.122 |
0.035372 |
| 12.47 |
1.247 |
0.038701 |
|

Figure 4.2.5. Plot of the data used for determining the DLAP of DEHP.
| Table 4.2.6 |
Detection Limit of the
Analytical Procedure
for DNOP |
|
| concentration |
mass on column |
ISTD-adjusted |
| (µg/mL) |
(ng) |
(response) |
|
| 0.00 |
0.000 |
0.016174 |
| 1.26 |
0.126 |
0.017594 |
| 2.53 |
0.253 |
0.020140 |
| 3.79 |
0.379 |
0.022811 |
| 5.05 |
0.505 |
0.024236 |
| 6.31 |
0.631 |
0.028774 |
| 7.58 |
0.758 |
0.030987 |
| 8.84 |
0.884 |
0.033952 |
| 10.10 |
1.010 |
0.035165 |
| 11.36 |
1.136 |
0.038195 |
| 12.63 |
1.263 |
0.040625 |
|
Figure 4.2.6. Plot of the data used for determining the DLAP of DNOP.
4.3 Detection limit of the overall procedure (DLOP)
The DLOP is measured as mass per sample and expressed as
equivalent air concentration, based on the recommended sampling parameters. Ten OVS-Tenax
samplers were spiked with amounts of phthalates equally spaced from 0 to 50 µg/sample.
The latter amount, when spiked on a sampler, would produce a peak approximately 10 times
the baseline noise for a sample blank. These spiked samples were analyzed with the
recommended analytical parameters, and the data obtained used to calculate the required
parameters (A and SEE) for the calculation of the DLOP. The parameters obtained and the
calculated DLOP's for the five phthalates are listed below.
| Table 4.3.1 |
| Summary of the calculated A, SEE, and DLOP |
|
|
DMP |
DEP |
DBP |
DEHP |
DNOP |
|
| A (µg-1) |
0.000498 |
0.000631 |
0.000616 |
0.000605 |
0.000491 |
| SEE |
0.00108 |
0.00102 |
0.000499 |
0.000790 |
0.000536 |
| DLOP (µg) |
6.5 |
4.8 |
2.4 |
3.9 |
3.3 |
|
| Table 4.3.2 |
Detection Limit of the Overall Procedure
for DMP |
|
| mass per sample |
ISTD-adjusted |
| (µg) |
response |
|
| 0.00 |
0.000000 |
| 4.92 |
0.003303 |
| 9.84 |
0.006687 |
| 14.76 |
0.005820 |
| 19.68 |
0.009595 |
| 24.60 |
0.011740 |
| 29.52 |
0.014777 |
| 34.44 |
0.015651 |
| 39.36 |
0.019574 |
| 44.28 |
0.023076 |
| 49.20 |
0.025336 |
|
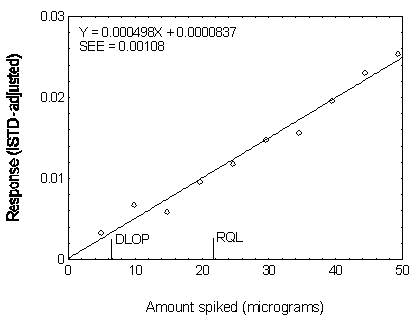
Figure 4.3.2. Plot of data used to determine the DLOP and RQL of DMP.
| Table 4.3.3 |
Detection Limit of the Overall Procedure
for DEP |
|
| mass per sample |
ISTD-adjusted |
| (µg) |
response |
|
| 0.00 |
0.000000 |
| 4.96 |
0.005735 |
| 9.92 |
0.009298 |
| 14.87 |
0.010539 |
| 19.83 |
0.013962 |
| 24.79 |
0.017733 |
| 29.75 |
0.018743 |
| 34.71 |
0.023453 |
| 39.66 |
0.026416 |
| 44.62 |
0.030439 |
| 49.58 |
0.032467 |
|
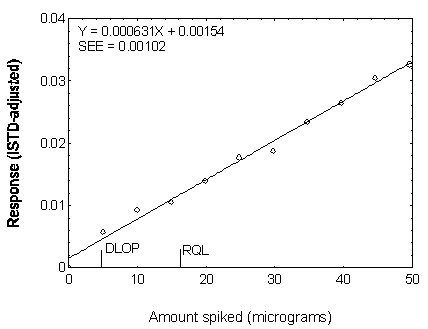
Figure 4.3.3. Plot of data used to determine the DLOP and RQL of DEP.
| Table 4.3.4 |
Detection Limit of the Overall Procedure
for DBP |
|
| mass per sample |
ISTD-adjusted |
| (µg) |
response |
|
| 0.00 |
0.000000 |
| 4.94 |
0.003247 |
| 9.88 |
0.006310 |
| 14.83 |
0.009043 |
| 19.77 |
0.012165 |
| 24.71 |
0.014531 |
| 29.65 |
0.017447 |
| 34.59 |
0.020963 |
| 39.54 |
0.023689 |
| 44.48 |
0.027926 |
| 49.42 |
0.030969 |
|

Figure 4.3.4. Plot of data used to determine the DLOP and RQL of DBP.
| Table 4.3.5 |
Detection Limit of the Overall Procedure
for DEHP |
|
| mass per sample |
ISTD-adjusted |
| (µg) |
response |
|
| 0.00 |
0.008518 |
| 4.99 |
0.010614 |
| 9.97 |
0.014936 |
| 14.96 |
0.017956 |
| 19.94 |
0.020824 |
| 24.93 |
0.022502 |
| 29.92 |
0.024855 |
| 34.90 |
0.030300 |
| 39.89 |
0.032849 |
| 44.87 |
0.035537 |
| 49.86 |
0.038496 |
|
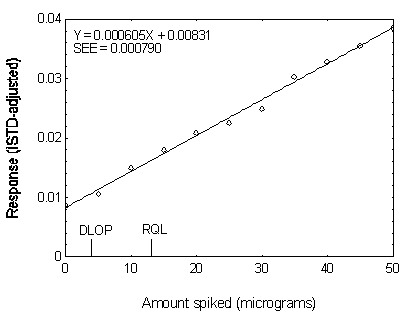
Figure 4.3.5 Plot of data used to determine the DLOP and RQL of DEHP.
| Table 4.3.6 |
Detection Limit of the Overall Procedure
for DNOP |
|
| mass per sample |
ISTD-adjusted |
| (µg) |
response |
|
| 0.00 |
0.015581 |
| 5.05 |
0.018904 |
| 10.10 |
0.020513 |
| 15.15 |
0.023587 |
| 20.20 |
0.025651 |
| 25.25 |
0.027891 |
| 30.30 |
0.030478 |
| 35.35 |
0.034282 |
| 40.40 |
0.035045 |
| 45.45 |
0.037866 |
| 50.50 |
0.041035 |
|
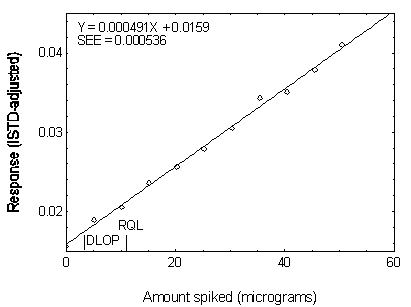
Figure 4.3.6. Plot of data used to determine the DLOP and RQL of DNOP.
4.4 Reliable quantitation limit
The RQL is considered the lower limit for precise
quantitative measurements. It is determined from the regression line data obtained for the
calculation of the DLOP (Section 4.3), providing at least 75% of the analyte is recovered.
The RQL is defined as the amount of analyte that gives a response (YRQL) such
that
YRQL - YBR = 10(SDBR)
therefore
The calculated RQL's for the five phthalates, together with
the recoveries at these levels, are listed below. The recoveries are above 75%.
| Table 4.4.1 |
| Summary of the RQL's and the recoveries |
|
|
DMP |
DEP |
DBP |
DEHP |
DNOP |
|
| RQL (µg/sample) |
21.7 |
16.2 |
8.1 |
13.1 |
10.9 |
| RQL (µg/m3) |
90 |
68 |
34 |
55 |
45 |
| Recovery (%) |
100.1 |
99.4 |
100.9 |
103.3 |
100.7 |
|

Figure 4.4.1. Chromatogram of the RQL for DMP.
Key: 1 = DMP, 3 = ISTD.
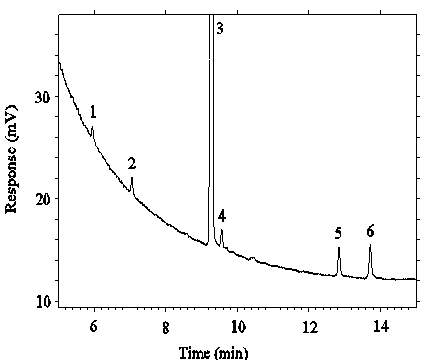
Figure 4.4.2. Chromatogram of the RQL's for DEP and DEHP.
Key: 2 = DEP, 3 = ISTD, 5 = DEHP.

Figure 4.4.3. Chromatogram of teh RQL's for DBP and DNOP.
Key: 3 = ISTD, 4 = DBP, 6 = DNOP.
4.5 Precision (analytical method)
The precision of the analytical procedure is defined as the
pooled relative standard deviation (RSDP). Relative standard deviations were
determined from six replicate injections of analytical standards at 0.5, 0.75, 1, 1.5, and
2 times the target concentration. After assuring that the RSDs satisfy the Cochran test
for homogeneity at the 95% confidence level, RSDP was calculated.
| Table 4.5.1 |
| Instrument Response to DMP |
|
× target concn
µg/mL |
0.5×
153.75 |
0.75×
230.63 |
1×
307.50 |
1.5×
461.25 |
2×
615.00 |
|
ISTD-adjusted
response
|
0.339180
0.339222
0.341304
0.339692
0.340345
0.338556 |
0.518724
0.518855
0.516464
0.519998
0.518792
0.518545 |
0.694646
0.695280
0.697158
0.694935
0.699107
0.692083 |
1.06782
1.05593
1.06663
1.05802
1.06191
1.06777 |
1.43746
1.42405
1.43872
1.43437
1.43922
1.43860 |
|

SD
RSD (%) |
0.339716
0.000979
0.29 |
0.518563
0.001151
0.22 |
0.695535
0.002389
0.34 |
1.06301
0.00520
0.49 |
1.43540
0.00583
0.41 |
|
Table 4.5.2
Instrument Response to DEP |
|
× target concn
µg/mL |
0.5×
154.94 |
0.75×
232.41 |
1×
309.88 |
1.5×
464.81 |
2×
619.75 |
|
ISTD-adjusted
response
|
0.374911
0.374138
0.378598
0.373550
0.373774
0.372888 |
0.570068
0.569987
0.569111
0.568564
0.570238
0.571293 |
0.763569
0.764417
0.762847
0.763365
0.766802
0.7610260 |
1.17061
1.15667
1.16755
1.15892
1.16228
1.16811 |
1.57033
1.55567
1.57204
1.56837
1.57259
1.57311 |
|
SD
RSD (%) |
0.374643
0.002049
0.55 |
0.569877
0.000948
0.17 |
0.763671
0.001905
0.25 |
1.16402
0.00558
0.48 |
1.56869
0.00661
0.42 |
|
Table 4.5.3
Instrument Response to DBP |
|
× target concn
µg/mL |
0.5×
154.44 |
0.75×
231.66 |
1×
308.88 |
1.5×
463.31 |
2×
617.75 |
|
ISTD-adjusted
response
|
0.405228
0.404333
0.404576
0.404915
0.403932
0.405790 |
0.611808
0.611966
0.612680
0.611583
0.612455
0.611139 |
0.825268
0.822788
0.831174
0.833438
0.830629
0.832469 |
1.26829
1.25226
1.25298
1.25158
1.25108
1.24944 |
1.68342
1.68432
1.70201
1.67908
1.70102
1.70313 |
|
SD
RSD (%) |
0.404796
0.000663
0.16 |
0.611939
0.000566
0.09 |
0.829294
0.004269
0.51 |
1.25427
0.00697
0.56 |
1.69216
0.01100
0.65 |
|
Table 4.5.4
Instrument Response to DEHP
|
× target concn
µg/mL |
0.5×
155.81 |
0.75×
233.72 |
1×
311.63 |
1.5×
467.44 |
2×
623.25 |
|
ISTD-adjusted
response
|
0.464074
0.467006
0.452057
0.458669
0.464892
0.465609 |
0.678952
0.682591
0.686014
0.682044
0.683300
0.682931 |
0.955317
0.933266
0.914818
0.923775
0.911533
0.935958 |
1.40557
1.42112
1.39206
1.42917
1.42689
1.39226 |
1.88144
1.91779
1.87967
1.88589
1.88077
1.88146 |
|
SD
RSD (%) |
0.462051
0.005669
1.23 |
0.682639
0.002274
0.33 |
0.929111
0.016079
1.73 |
1.41118
0.01688
1.20 |
1.88784
0.01483
0.79 |
|
Table 4.5.5
Instrument Response to DNOP
|
× target concn
µg/mL |
0.5×
157.81 |
0.75×
236.72 |
1×
315.63 |
1.5×
473.44 |
2×
631.25 |
|
ISTD-adjusted
response
|
0.428794
0.435110
0.418855
0.423316
0.431818
0.434664 |
0.630011
0.633303
0.639090
0.635316
0.634379
0.635068 |
0.906980
0.872334
0.853098
0.862667
0.849245
0.877654 |
1.32827
1.34664
1.31105
1.35927
1.35852
1.31242 |
1.78854
1.83870
1.78651
1.79472
1.78838
1.78544 |
|
SD
RSD (%) |
0.428760
0.006516
1.52 |
0.634528
0.002955
0.47 |
0.870330
0.020982
2.41 |
1.33603
0.02191
1.64 |
1.79705
0.02066
1.15 |
|
The Cochran test for homogeneity requires the calculation of the g statistics according to the following formula:
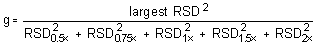
The g statistics obtained were: 0.3692, 0.3750, 0.4117, 0.4482, and 0.4696, for DMP, DEP, DBP, DEHP, and DNOP, respectively. Since these g
statistics do not exceed the critical value of 0.5065, the RSDs within each phthalate can
be considered equal and they can be pooled (RSDP) to give an estimated RSD for
the concentration range studied.
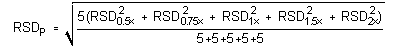
The pooled relative standard deviations are: 0.36%, 0.40%, 0.45%, 1.15%, and 1.57%, for DMP, DEP, DBP, DEHP, and DNOP, respectively.
4.6 Precision (overall procedure)
The precision of the overall procedure is determined from
the storage data in Section 4.7. The determination of the standard error of estimate (SEER)
for a regression line plotted through the graphed storage data allows the inclusion of
storage time as one of the factors affecting overall precision. The SEER is
similar to the standard deviation, except it is a measure of dispersion of data about a
regression line instead of about a mean. It is determined with the following equation:

| n |
= |
total no. of data points |
| k |
= |
2 for linear regression |
| k |
= |
3 for quadratic regression |
| Yobs |
= |
observed % recovery at a given time |
| Yest |
= |
estimated % recovery from the regression line at the same given time |
An additional 5% for pump error (SP) is added to the SEER
by the addition of variances to obtain the total standard error of estimate.

The precision at the 95% confidence level is obtained by
multiplying the standard error of estimate (with pump error included) by 1.96 (the
z-statistic from the standard normal distribution at the 95% confidence level). The 95%
confidence intervals are drawn about their respective regression lines in the storage
graphs, as shown in Figures 4.7.1.1 to 4.7.5.2. The precisions of the overall procedure
are ±13.4%, ±13.0%, ±10.9%, ±10.6%, and ±10.8% for DMP, DEP, DBP, DEHP, and DNOP,
respectively.
4.7 Storage test
Storage tests were conducted in three batches: DMP,
DEP/DNOP, and DBP/DEHP. Storage samples were prepared from the controlled test atmospheres
of the appropriate phthalate or phthalate mixtures. Thirty-six samples were collected. Six
samples were analyzed on the day of preparation. The rest of the samples were divided into
two groups: 15 were stored at 5°C, and the other 15 were stored at ambient temperature
(about 22°C) in a closed drawer. At 1-4 day intervals, three samples were selected from
each of the two storage sets and analyzed.
Table 4.7.1
Storage Test for DMP
|
time (days)
|
percent recovery
(ambient) |
|
percent recovery
(refrigerated) |
|
0
0
1
5
8
12
15 |
104.5
99.5
97.6
98.0
97.7
98.6
108.5 |
98.3
100.0
97.4
105.2
95.7
102.4
101.3 |
106.1
91.6
105.2
104.5
106.2
104.1
113.0 |
|
104.5
99.5
98.1
96.9
88.5
97.9
97.9 |
98.3
100.0
104.3
95.4
104.5
89.7
112.4 |
106.1
91.6
104.6
104.1
107.0
97.2
110.5 |
|
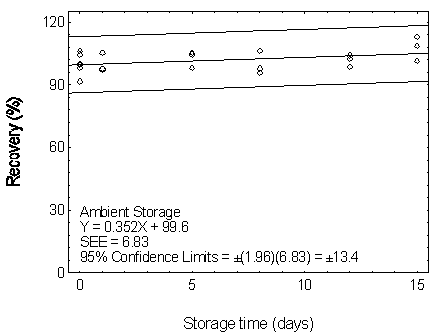
Figure 4.7.1.1. Ambient storage test for DMP.

Figure 4.7.1.2. Refrigerated storage test for DMP.
| Table 4.7.2 |
| Storage Test for DEP |
|
| time (days) |
percent recovery |
|
percent recovery |
|
(ambient) |
|
(refrigerated) |
|
| 0 |
97.6 |
94.6 |
95.7 |
|
97.6 |
94.6 |
95.7 |
| 0 |
104.5 |
104.9 |
102.7 |
|
104.5 |
104.9 |
102.7 |
| 3 |
94.6 |
93.6 |
102.7 |
|
90.5 |
101.3 |
102.2 |
| 6 |
92.9 |
100.2 |
93.5 |
|
91.9 |
94.6 |
104.4 |
| 9 |
89.1 |
91.0 |
98.1 |
|
86.8 |
98.7 |
99.2 |
| 13 |
90.6 |
94.3 |
99.6 |
|
92.6 |
90.9 |
100.7 |
| 15 |
92.1 |
91.2 |
100.3 |
|
93.2 |
104.5 |
105.3 |
|
Figure 4.7.2.1. Ambient storage test for DEP.
Figure 4.7.2.2. Refrigerated storage test for DEP.
| Table 4.7.3 |
| Storage Test for DBP |
|
| time (days) |
percent recovery |
|
percent recovery |
|
(ambient) |
|
(refrigerated) |
|
| 0 |
99.1 |
99.5 |
98.3 |
|
99.1 |
99.5 |
98.6 |
| 0 |
103.7 |
102.6 |
96.9 |
|
103.7 |
102.3 |
96.9 |
| 4 |
100.5 |
101.8 |
101.1 |
|
103.1 |
101.1 |
101.9 |
| 6 |
95.8 |
96.7 |
102.7 |
|
98.7 |
99.0 |
102.1 |
| 8 |
100.3 |
101.1 |
99.7 |
|
99.9 |
101.6 |
102.0 |
| 12 |
101.7 |
99.2 |
104.3 |
|
93.8 |
97.9 |
101.3 |
| 15 |
97.4 |
99.1 |
96.4 |
|
102.2 |
98.3 |
106.0 |
|

Figure 4.7.3.1. Ambient storage test for DBP.

Figure 4.7.3.2. Refrigerated storage test for DBP.
| Table 4.7.4 |
| Storage Test for DEHP |
|
| time (days) |
percent recovery |
|
percent recovery |
|
(ambient) |
|
(refrigerated) |
|
| 0 |
99.5 |
99.8 |
98.7 |
|
99.5 |
99.8 |
98.7 |
| 0 |
102.2 |
102.0 |
97.8 |
|
102.2 |
102.0 |
197.8 |
| 4 |
100.6 |
102.9 |
102.8 |
|
104.8 |
99.8 |
102.0 |
| 6 |
95.7 |
97.4 |
101.0 |
|
97.8 |
98.3 |
102.0 |
| 8 |
100.0 |
101.5 |
98.6 |
|
99.8 |
100.5 |
101.5 |
| 12 |
98.1 |
101.9 |
104.2 |
|
105.9 |
100.8 |
102.4 |
| 15 |
101.6 |
101.4 |
104.5 |
|
96.5 |
98.1 |
94.5 |
|

Figure 4.7.4.1. Ambient storage test for DEHP.

Figure 4.7.4.2. Refrigerated storage test for DEHP.
| Table 4.7.5 |
| Storage Test for DNOP |
|
| time (days) |
percent recovery |
|
percent recovery |
|
(ambient) |
|
(refrigerated) |
|
| 0 |
101.7 |
101.7 |
101.6 |
|
101.7 |
101.7 |
101.6 |
| 0 |
98.7 |
99.7 |
96.6 |
|
98.7 |
99.7 |
96.6 |
| 3 |
101.7 |
103.7 |
100.1 |
|
104.4 |
99.0 |
98.9 |
| 6 |
99.7 |
94.8 |
- |
|
98.8 |
99.2 |
96.3 |
| 9 |
99.9 |
99.9 |
95.5 |
|
98.9 |
98.4 |
98.5 |
| 13 |
102.1 |
100.0 |
98.7 |
|
103.5 |
102.2 |
99.9 |
| 15 |
100.5 |
101.9 |
98.3 |
|
100.0 |
96.3 |
98.8 |
|

Figure 4.7.5.1. Ambient storage test for DNOP.

Figure 4.7.5.2. Refrigerated storage test for DNOP.
4.8 Reproducibility
Reproducibility samples were prepared from controlled test atmospheres of mixed phthalates. They were prepared in two batches: DMP/DEP and
DBP/DEHP/DNOP. The samples were submitted to an SLTC service branch for analysis. The
samples were analyzed after being stored for 13 days at ambient temperature. No sample
result had a deviation greater than the precisions of the overall procedure determined in
Section 4.7, which are ±13.4%, ±13.0%, ±10.9%, ±10.6%, and ±10.8% for DMP, DEP, DBP,
DEHP, and DNOP, respectively.
Table 4.8.1
Reproducibility Data for DMP
|
| µg expected |
µg found |
percent found |
percent deviation |
|
787
788
785
780
804
782 |
756
775
757
774
819
770 |
96.1
98.4
96.4
99.2
101.9
98.5 |
-3.9
-1.6
-3.6
-0.8
+1.9
-1.5 |
|
Table 4.8.2
Reproducibility Data for DEP
|
| µg expected |
µg found |
percent found |
percent deviation |
|
695
696
693
688
710
690 |
655
676
650
680
713
668 |
94.2
97.1
93.8
98.8
100.4
96.8 |
-5.8
-2.9
-6.2
-1.2
+0.4
-3.2 |
|
Table 4.8.3
Reproducibility Data for DBP
|
| µg expected |
µg found |
percent found |
percent deviation |
|
1323
1328
1329
1307
1375
1334 |
1412
1425
1408
1380
1446
1412 |
106.7
107.3
105.9
105.6
105.2
105.8 |
+6.7
+7.3
+5.9
+5.6
+5.2
+5.8 |
|
Table 4.8.4
Reproducibility Data for DEHP
|
| µg expected |
µg found |
percent found |
percent deviation |
|
1367
1372
1373
1351
1421
1379 |
1428
1436
1418
1392
1462
1422 |
104.5
104.7
103.3
103.0
102.9
103.1 |
+4.5
+4.7
+3.3
+3.0
+2.9
+3.1 |
|
Table 4.8.5
Reproducibility Data for DNOP
|
| µg expected |
µg found |
percent found |
percent deviation |
|
1374
1379
1381
1358
1429
1386 |
1495
1448
1427
1396
1472
1395 |
108.8
105.0
103.3
102.8
103.0
100.6 |
+8.8
+5.0
+3.3
+2.8
+3.0
+0.6 |
|
4.9 Sampler capacity
The sampler capacity was assessed by sampling from a
dynamically generated test atmosphere of phthalate at 2 times the target concentration and
at 25°C and 80% RH. The test atmosphere of phthalate was generated by pumping a
2-propanol solution of phthalate at a rate of approximately 6 mg/min (12 mg/mL × 0.5
mL/min) through a TSI Model 3076 atomizer where it was dispersed with an air stream of 3.5
L/min. The aerosol passed through an electrostatic charge neutralizer and was diluted with
an air stream of 47 L/min. The diluted aerosol was fed to a test chamber fitted with 18
sampling ports. The test atmosphere was drawn through the test sampler and a monitoring
sampler at 1.0 L/min. The test sampler was prepared by cutting off the lower half of the
tube and removing the rear foam and the 70-mg section of the resins (see figure at right).
At 60-min intervals, the flow was stopped and the monitoring samplers were replaced with
new ones. This was repeated six times. At the end of the experiment, all the monitoring
samplers as well as the test sampler were analyzed. The downstream air concentration was
obtained by dividing the amount found on the back sampler by the air volume. The upstream
concentration was obtained by dividing the sum of amounts found on the front as well as
all the back sampler by the total air volume. The actual upstream concentrations obtained
were 13.55, 14.23, 8.78, 15.38, 17.76 mg/m3 for DMP, DEP, DBP, DEHP, and DNOP,
respectively. The breakthrough is defined as the downstream concentration divided by the
upstream concentration. The average breakthroughs for each sampling period versus the air
volume(1) were plotted in
Figures 4.9.1 and 4.9.2.
Figure 4.9.1. Breakthrough curves for DMP, DEP, and DBP.
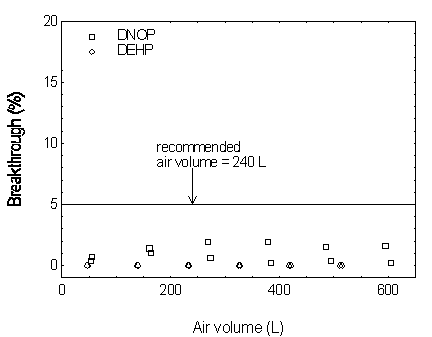
Figure 4.9.2. Breakthrough curves for DEHP and DNOP.
4.10 Desorption efficiency and stability of desorbed samples
4.10.1 Desorption efficiency
The desorption efficiencies (DE) of phthalates were
determined by liquid-spiking the front section of the OVS-Tenax with phthalates at 0.05 to
2 times the target concentrations. These samples were stored overnight at ambient
temperature and then extracted and analyzed. The average extraction efficiencies over the
working range of 0.5 to 2 times the target concentration were 98.4%, 99.3%, 99.8%, 99.5%,
and 98.6%, respectively, for DMP, DEP, DBP, DEHP, and DNOP.
Table 4.10.1.1
Desorption Efficiency for DMP
|
× target conc
(µg) |
0.05×
61.5 |
0.1×
123.0 |
0.2×
246.0 |
0.5×
615 |
1.0×
1230 |
2.0×
2460 |
|
DE (%)
|
90.1
90.3
97.7
89.2
89.9
90.5 |
90.8
91.4
91.5
95.1
89.7
89.9 |
94.3
94.1
94.0
98.8
94.5
95.1 |
97.4
98.9
100.1
96.5
97.6
97.9 |
98.0
99.5
98.6
98.6
98.5
97.9 |
98.5
98.5
98.6
99.0
98.4
98.9 |
|
|
91.3 |
91.4 |
95.1 |
98.1 |
98.5 |
98.6 |
|
Table 4.10.1.2
Desorption Efficiency for DEP
|
× target conc
(µg) |
0.05×
62.0 |
0.1×
93.0 |
0.2×
247.9 |
0.5×
619.8 |
1.0×
1239.5 |
2.0×
2479 |
|
DE (%)
|
100.0
101.8
96.2
97.5
103.2
100.9 |
98.2
98.2
98.2
100.9
101.5
96.0 |
102.7
98.8
98.1
99.8
101.9
99.9 |
101.1
99.5
101.9
98.1
99.8
101.2 |
98.5
100.1
99.0
98.5
99.4
98.3 |
98.6
98.6
98.4
99.0
98.1
98.7 |
|
|
99.9 |
98.8 |
100.2 |
100.3 |
99.0 |
98.6 |
|
Table 4.10.1.3
Desorption Efficiency for DBP
|
× target conc
(µg) |
0.05×
61.8 |
0.1×
123.6 |
0.2×
247.1 |
0.5×
617.8 |
1.0×
1235.5 |
2.0×
2471 |
|
DE (%)
|
115.8
98.1
98.1
104.9
97.5
93.9 |
97.8
97.4
96.1
96.1
101.8
96.3 |
98.9
101.9
98.2
101.4
102.1
98.1 |
101.7
100.0
102.5
100.7
100.3
101.2 |
98.8
99.5
99.2
98.9
99.3
99.2 |
99.1
99.2
99.0
99.7
99.0
99.4 |
|
|
101.4 |
97.6 |
100.1 |
101.1 |
99.2 |
99.2 |
|
Table 4.10.1.4
Desorption Efficiency for DEHP
|
× target conc
(µg) |
0.05×
62.3 |
0.1×
124.7 |
0.2×
249.3 |
0.5×
623.3 |
1.0×
1246.5 |
2.0×
2493 |
|
DE (%)
|
108.5
95.7
95.4
95.9
97.6
96.6 |
95.2
96.0
95.3
94.7
94.9
96.9 |
100.4
101.0
100.3
99.3
98.9
98.8 |
98.7
99.4
101.7
97.9
97.4
98.3 |
98.8
98.7
98.9
100.4
100.5
99.5 |
100.5
100.4
99.8
99.5
99.7
100.5 |
|
|
98.3 |
95.5 |
99.8 |
98.9 |
99.5 |
100.1 |
|
Table 4.10.1.5
Desorption Efficiency for DNOP
|
× target conc
(µg) |
0.05×
63.1 |
0.1×
126.3 |
0.2×
252.5 |
0.5×
631.3 |
1.0×
1262.5 |
2.0×
2525 |
|
DE (%)
|
109.4
100.1
96.6
96.4
97.4
96.8 |
92.0
91.5
92.5
93.1
91.6
92.7 |
95.7
95.3
95.2
94.9
94.3
94.2 |
95.5
96.5
99.3
95.1
94.5
95.2 |
97.4
97.5
97.9
100.2
100.4
98.6 |
102.1
101.9
100.5
100.2
100.5
101.8 |
|
|
99.4 |
92.2 |
94.9 |
96.0 |
98.7 |
101.2 |
|
4.10.2 Stability of desorbed samples
The stability of the desorbed samples was investigated by
reanalyzing the target concentration samples 24 h after initial analysis. After the
original analysis was performed three vials were recapped with new septa while the
remaining three retained their punctured septa. The samples were reanalyzed with fresh
standards.
Table 4.10.2.1
Stability of desorbed samples for DMP
|
| punctured septa replaced |
punctured septa retained |
initial
DE
(%) |
DE after
one day
(%) |
difference |
initial
DE
(%) |
DE after
one day
(%) |
difference |
|
98.0
99.5
98.6
98.7 |
99.0
99.5
99.0
(averages)
99.2 |
+1.0
0.0
+0.4
+0.5 |
98.6
98.5
97.9
98.3 |
99.0
99.4
99.0
(averages)
99.1 |
+0.4
+0.9
+1.1
+0.8 |
|
Table 4.10.2.2
Stability of extracted samples for DEP
|
| punctured septa replaced |
punctured septa retained |
initial
DE
(%) |
DE after
one day
(%) |
difference |
initial
DE
(%) |
DE after
one day
(%) |
difference |
|
98.5
100.1
99.0
99.2 |
99.8
99.9
99.7
(averages)
99.8 |
+1.3
-0.2
+0.7
+0.6 |
98.5
99.4
98.3
98.7 |
99.5
99.6
99.4
(averages)
99.5 |
+1.0
+0.2
+1.1
+0.8 |
|
Table 4.10.2.3
Stability of extracted samples for DBP
|
| punctured septa replaced |
punctured septa retained |
initial
DE
(%) |
DE after
one day
(%) |
difference |
initial
DE
(%) |
DE after
one day(%) |
difference |
|
98.8
99.5
99.2
99.2 |
98.2
99.0
98.8
(averages)
98.7 |
-0.6
-0.5
-0.4
-0.5 |
98.9
99.3
99.2
99.1 |
98.2
98.8
98.2
(averages)
98.4 |
-0.7
-0.5
-1.0
-0.7 |
|
Table 4.10.2.4
Stability of extracted samples for DEHP
|
| punctured septa replaced |
punctured septa retained |
initial
DE
(%) |
DE after
one day
(%) |
difference |
initial
DE
(%) |
DE after
one day
(%) |
difference |
|
98.8
98.7
98.9
98.8 |
96.8
97.7
98.0
(averages)
97.5 |
-2.0
-1.0
-0.9
-1.3 |
100.4
100.5
99.5
100.1 |
96.9
97.6
97.2
(averages)
97.2 |
-3.5
-2.9
-2.3
-2.9 |
|
Table 4.10.2.5
Stability of extracted samples for DNOP
|
| punctured septa replaced |
punctured septa retained |
initial
DE
(%) |
DE after
one day
(%) |
difference |
initial
DE
(%) |
DE after
one day
(%) |
difference |
|
97.4
97.5
97.9
97.6 |
95.7
96.4
97.7
(averages)
96.6 |
-1.7
-1.1
-0.2
-1.0 |
100.2
100.4
98.6
99.7 |
96.1
96.3
95.9
(averages)
96.1 |
-4.1
-4.1
-2.7
-3.6 |
|
4.11 Qualitative analysis
The GC/MS of phthalates can be obtained by using GC
conditions similar to those given in Section 3.5. A Perkin-Elmer Ion Trap Detector
interfaced to a Hewlett-Packard Series II GC was used to obtain the mass spectra shown
below.
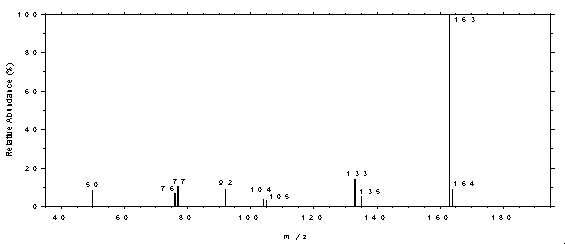
Figure 4.11.1. Mass spectrum of DMP.

Figure 4.11.2. Mass spectrum of DEP.
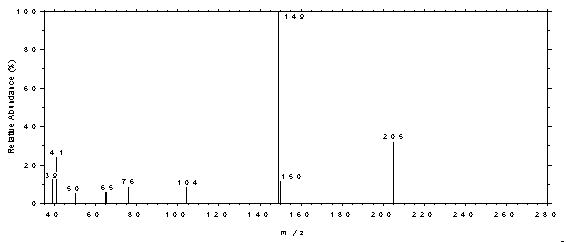
Figure 4.11.3. Mass spectrum of DBP.

Figure 4.11.4. Mass spectrum of DEHP.
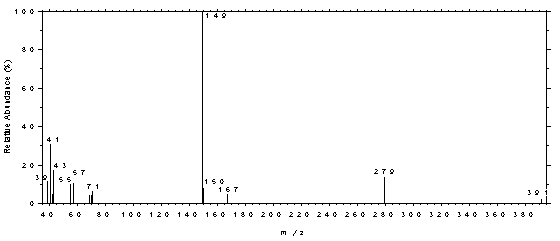
Figure 4.11.5. Mass spectrum of DNOP.
5. References
5.1. Thomas, G. H., "Quantitative Determination and
Confirmation of Identity of Trace Amounts of Dialkyl Phthalates in Environmental
Samples", Environmental Health Perspectives, No. 3, pp 23-28 (1973).
5.2. "Dibutyl Phthalate and Di(2-ethylhexyl) Phthalate
- Method 5020", in: NIOSH Manual of Analytical Methods, 3rd ed., Cincinnati,
OH, US Department of Health and Human Services, National Institute for Occupational Safety
and Health, 1984.
5.3. "Dioctyl Phthalates in Air. Laboratory Method
using Tenax Adsorbent Tubes, Solvent Desorption and Gas Chromatography", MDHS
Report No. 32, Health and Safety Executive, Her Majesty's Stationery Office, London,
England, 1983.
5.4. Eide, M., "Dimethyl Phthalate, Diethyl Phthalate,
Dibutyl Phthalate, Di-2-ethylhexyl Phthalate", OSHA in-house file, 1989.
5.5. Clayton, G. D. and F. E. Clayton, Patty's
Industrial Hygiene and Toxicology, 3rd ed., Vol. IIA, p. 2343, John Wiley & Sons,
New York, 1981.
5.6. Toxicological Profile for Diethyl Phthalate, U.
S. Department of Health & Human Services, Public Health Service, Agency for Toxic
Substances and Disease Registry, 1993.
5.7. Toxicological Profile for Di-n-butyl Phthalate,
U.S. Department of Health & Human Services, Public Health Service, Agency for Toxic
Substances and Disease Registry, 1990.
5.8. Toxicological Profile for Di(2-ethylhexyl)
Phthalate, U.S. Department of Health & Human Services, Public Health Service,
Agency for Toxic Substances and Disease Registry, 1993.
5.9. IARC Monographs on the Evaluation of Carcinogenic
Risks to Humans, 29, 257 (1982), Suppl. 7, 62, World Health Organization,
International Agency for Research on Cancer, Lyon, France, 1987.
5.10. Material Safety Data Sheets, Dimethyl Phthalate,
Diethyl Phthalate, Di-n-butyl Phthalate, Di(2-ethylhexyl) Phthalate, Di-n-octyl Phthalate,
Occupational Health Services, New York.
5.11. Material Safety Data Sheets, Dimethyl Phthalate,
Diethyl Phthalate, Di-n-butyl Phthalate, Di(2-ethylhexyl) Phthalate, Di-n-octyl Phthalate,
J T Baker Inc., Phillipsburg, New Jersey.
Footnote (1) The air volume for each sampling period was adjusted to 2
times the target concentrations. The air volume of the mid-point of the sampling period is
multiplied by 10 mg/m3 and divided by the actual upstream concentration (13.55
mg/m3 for DMP, for example).
(Back to text)
|
