Basic Information
Percent Change in
|
||||||||||||||||||||||||||||||||||||||||||||||||||||||||||||||
| 1980 vs 2007 |
1990 vs 2007 |
|
| CO | -55 |
-44 |
| Pb | -97 |
-72 |
| NOx | -39 |
-33 |
| VOC | -50 |
-35 |
| Direct PM10 | -65 |
-33 |
| Direct PM2.5 | --- |
-51 |
| SO2 | -49 |
-45 |
Notes:
1. --- Trend data not available
2. PM2.5 air quality based on data since 2000.
3. Direct PM10 emissions for 1980 are based on data since 1985.
4. Negative numbers indicate improvements in air quality or reductions in emissions.
Under the Clean Air Act, EPA establishes primary air quality standards to protect public health, including the health of "sensitive" populations such as people with asthma, children, and older adults. EPA also sets secondary standards to protect public welfare. This includes protecting ecosystems, including plants and animals, from harm, as well as protecting against decreased visibility and damage to crops, vegetation, and buildings. To get more information regarding national air quality standards, visit http://www.epa.gov/air/criteria.html
EPA has set national air quality standards for six common air pollutants (also called the criteria pollutants):
- carbon monoxide (CO)
- ozone (O3),
- lead (Pb)
- nitrogen dioxide (NO2)
- particulate matter (PM)
- sulfur dioxide (SO2)
Some of these pollutants (CO, SO2, and lead) are emitted directly from a variety of sources. Although some industrial sources release ozone directly into the environment, most ground-level ozone forms in the air from chemical reactions involving nitrogen oxides (NOx), volatile organic compounds (VOCs), and sunlight. NO2 is formed in the air through the oxidation of nitric oxide (NO). PM, also known as particle pollution, can be directly emitted, or it can be formed when emissions of NOx, sulfur oxides (SOx), ammonia, organic compounds, and other gases react in the atmosphere. Particle pollution is regulated as PM2.5, or “fine particles” with diameters less than or equal to 2.5 micrometers, and PM10, which includes all particles with diameters less than or equal to 10 micrometers.
Each year EPA looks at the levels of these pollutants in the air and the emissions from various sources to see how both have changed over time and to summarize the current status of air quality.
Air Quality Trends
EPA creates air quality trends using measurements from monitors located across the country. The table to the right shows that air quality based on concentrations of the common pollutants has improved nationally since 1980.
National air quality trends graphs showing the nation’s progress towards clean air are available for: carbon monoxide (CO), ozone (O3), lead (Pb), nitrogen dioxide (NO2), particulate matter (PM), and sulfur dioxide (SO2).
Despite great progress in air quality improvement, over 150 million people nationwide lived in counties with pollution levels above the primary NAAQS in 2007.
| |||
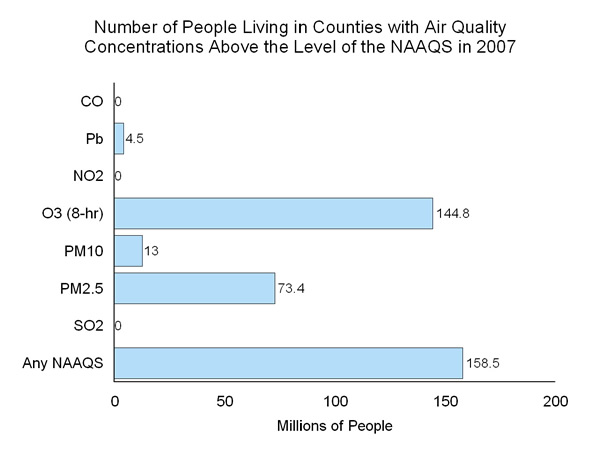
Note: In 2008, EPA strengthened the national standards for 8-hour ozone to 0.075 ppm and the national standards for lead to 0.15 µg/m3. This figure includes people living in counties that monitored ozone and lead concentrations above the new levels.
Emission Trends
EPA estimates nationwide emissions of ambient air pollutants and the pollutants they are formed from (their precursors). These estimates are based on actual monitored readings or engineering calculations of the amounts and types of pollutants emitted by vehicles, factories, and other sources. Emission estimates are based on many factors, including levels of industrial activity, technological developments, fuel consumption, vehicle miles traveled, and other activities that cause air pollution.
Emissions information is developed with input from state and local air agencies, tribes, and industry, and it is stored in a database called the National Emissions Inventory. EPA tracks a range of emissions data, including how much of each pollutant is emitted from various pollution sources. To view national, state, and local emissions summary data, see EPA’s Air Emission Sources site.
Emissions of air pollutants continue to play an important role in a number of air quality issues. About 129 million tons of pollution are emitted into the atmosphere each year in the United States. These emissions mostly contribute to the formation of ozone and particles, the deposition of acids, and visibility impairment.
The table below shows changes in national estimates of emissions for the common air pollutants or, where appropriate, the precursor pollutants that form them.
|
National Emissions Estimates
| |||||||||||||||||||||||||||||||||||||||||||||||||||||||||||||||||||||||||||||||||||||||||
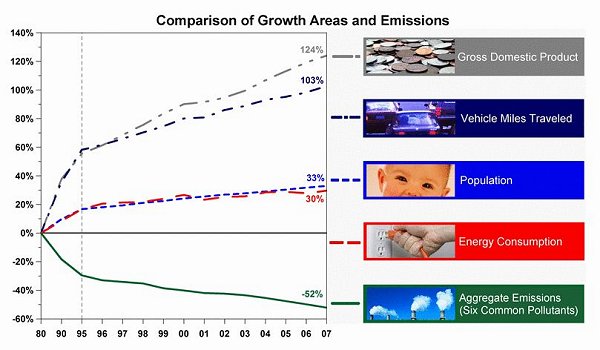
Annual emissions estimates are used as one indicator of the effectiveness of our programs. The graph below shows that between 1980 and 2007, gross domestic product increased 124 percent, vehicle miles traveled increased 103 percent, energy consumption increased 30 percent, and U.S. population grew by 33 percent. During the same time period, total emissions of the six principal air pollutants dropped by 52 percent.
| Comparison of Growth Areas and Emissions, 1980-2007 |
 |
(see the graphic above for 1970-2007)
In addition, from 1990 to 2002, emissions of air toxics declined by 35 percent. These reductions are the result of implementing stationary and mobile source regulations. The majority of the air toxics emitted in 2002 are also precursors of ozone and/or particle pollution.
In recent years, EPA has acted to dramatically improve America's air quality by designing and developing national programs that, when fully implemented, will achieve significant reductions in air emissions. The associated air quality benefits will lead to improved health, longevity, and quality of life for all Americans.
Weather Influence
Weather conditions influence emissions and air quality. EPA has developed statistical approaches to account for weather’s influence on ozone and fine particles. While these approaches do not change the quality of air we breathe, they do help us understand how well emission reduction programs are working. More information on trends in ozone adjusted for weather conditions can be found at http://www.epa.gov/airtrends/weather.html.
To get detailed information about emissions estimates displayed above, please visit EPA's Clearinghouse for Inventories and Emissions Factors (CHIEF).
The Clean Air Act
The Clean Air Act provides the principal framework for national, state, tribal, and local efforts to protect air quality. Improvements in air quality are the result of effective implementation of clean air laws and regulations, as well as efficient industrial technologies. Under the Clean Air Act, EPA has a number of responsibilities, including:
- Conducting periodic reviews of the NAAQS for the six common pollutants that are considered harmful to public health and the environment.
- Ensuring that these air quality standards are met (in cooperation with the state, tribal, and local governments) through national standards and strategies to control air pollutant emissions from vehicles, factories, and other sources.
- Reducing emissions of SO2 and NOx that cause acid rain.
- Reducing air pollutants such as PM, SOx, and NOx, which can reduce visibility across large regional areas, including many of the nation's most treasured parks and wilderness areas.
- Ensuring that sources of toxic air pollutants that may cause cancer and other adverse human health and environmental effects are well controlled and that the risks to public health and the environment are substantially reduced.
- Limiting the use of chemicals that damage the stratospheric ozone layer in order to prevent increased levels of harmful ultraviolet radiation.