|
m-XYLENE-a,a'-DIAMINE (m-XYLYLENEDIAMINE;
mXDA)
p-XYLENE-a,a'-DIAMINE (p-XYLYLENEDIAMINE;
pXDA)
| Method number: |
105 |
|
|
| Matrix: |
Air |
|
|
Target concentration:
OSHA PEL:
ACGIH TLV: |
mXDA
0.1 mg/m3 (15-min ceiling)
None
0.1 mg/m3 (Ceiling) |
pXDA
0.1 mg/m3 (15-min ceiling)
None
None |
|
| Procedure: |
Samples are collected closed-face by drawing known volumes of
air through sampling devices consisting of three-piece cassettes, each containing two
sulfuric acid-treated glass fiber filters separated by the ring section. Samples are
analyzed by HPLC using an ultraviolet detector. |
|
Recommended air volume
and sampling rate: |
15 L at 1.0 L/min |
|
|
Reliable quantitation limit:
Standard error of estimate at
the target concentration: |
mXDA
0.91 µg/m3
5.1% |
pXDA
1.12 µg/m3
5.1% |
|
| Status of method: |
Evaluated method. This method has been subjected to the
established evaluation procedures of the Organic Methods Evaluation Branch. |
|
|
| Date: December 1994 |
|
Chemist: Carl J. Elskamp |
Organic Methods Evaluation Branch
OSHA Salt Lake Technical Center
Salt Lake City, UT 84165-0200
1. General Discussion
1.1 Background
1.1.1 History
There were no methods found in the literature for the determination of airborne levels
of xylylenediamines. Sampling procedures evaluated at the OSHA Salt Lake Technical Center
(SLTC) for a number of other aromatic amines involve collection with sulfuric acid-treated
glass fiber filters. (Refs. 5.1-5.7) For those amines where the target concentrations were
in the ppb range, quantitation was performed by analyzing the heptafluorobutyric acid
anhydride derivatives by gas chromatography using an electron capture detector in order to
achieve high sensitivities. Before the derivatization step is performed, the free amines
are extracted from an aqueous system into toluene. Extraction of the xylylenediamines into
toluene proved to be impossible because they are too water soluble. Analysis was thus
performed by HPLC using paired-ion chromatography. Adequate sensitivity was obtained using
an ultraviolet detector. Ion-pairing is necessary because the polar analytes are not
otherwise sufficiently retained. A column designed for analysis of basic compounds proved
useful in producing symmetrical peaks.
A target concentration of 0.1 mg/m3 with a 15-minute ceiling
was chosen for both analytes because of the ACGIH TLV for m-xylene-a,a'-diamine (mXDA). (Ref. 5.8) The
analytical procedure has adequate sensitivity for 15-minute samples (15-L, 1 L/min), but
if desired, long-term sampling can be also done because the sampler has ample capacity.
Samples are stable for at least 15 days, even when stored at room temperature.
1.1.2 Toxic effects (This section is for information only and should not be taken as
the basis of OSHA policy.)
Both mXDA and pXDA are harmful if swallowed, inhaled, or absorbed through the skin.
They are extremely destructive to tissue of the mucous membranes and upper respiratory
tract, eyes and skin. Symptoms of exposure may include burning sensation, coughing,
wheezing, laryngitis, shortness of breath, headache, nausea and vomiting. (Refs.
5.9-5.10)
The following paragraphs are taken directly from the ACGIH Documentation of the
Threshold Limit Values concerning the TLV for mXDA. (Ref. 5.8)
Two studies have indicated mXDA to have a rather low oral acute toxicity to the rat
(1500 and 930 mg/kg, respectively), however to be strongly irritating to the skin. A
dermal LD50 of 2000 mg/kg was found for rabbits. The undiluted
compound was corrosive to the skin of guinea pigs, and a 50% emulsion in an
acetone-dioxane mixture was severely irritating, but little effect was produced by a
concentration of 10%. A 10% aqueous solution, however, caused severe erythema and
irritation, yet repeated application of a 5% concentration was needed to produce swelling
and redness.
In one study evidence of mild sensitization was found following repeated application to
guinea pig skin, but this finding was not duplicated in the second investigation.
Exposure of rats for one hour to an aerosol of mXDA, at measured concentrations ranging
from 1.74 to 6.04 mg/liter, resulted in eye irritation, lacrimation and labored breathing.
No deaths occurred during exposure, but several animals died within 48 hours, and a few
more later, up to 14 days, the end of the observation period. Of the animals which
survived, female rats showed reduced weight gain, while that of males was near normal.
At necropsy macroscopic abnormalities were found chiefly in the lungs, however changes
in liver and kidneys were also noted. The LC50 for a one-hour
exposure and 14-day observation period was 3.75 mg/L, or about 700 ppm.
In comparison with the better known phenylene diamine (q.v.), the dermal effects of
mXDA seem similar, but the oral toxicity appears less. By analogy, a ceiling limit of 0.1
ppm [sic], with a skin notation, is retained for the present, however, the Committee is
currently reviewing this compound. At this concentration, the compound should be largely
in the vapor state.
1.1.3 Workplace exposure
mXDA is used to make polyamide fibers and resins and as a curing agent for epoxy
resins. It is also a source of m-xylene diisocyanate. (Refs. 5.8, 5.11) It is
assumed that pXDA can be used similarly in industry. In one case an experimental nylon
derived from pXDA was tested to improve the flat spotting performance of bias and
bias-belted tires. (Ref. 5.12)
1.1.4 Physical properties (Ref. 5.9-5.10)
|
mXDA |
pXDA |
| CAS number: |
1477-55-0 |
539-48-0 |
| molecular weight: |
136.20 |
136.20 |
| melting point: |
|
62-64°C |
| boiling point: |
265°C at 99.3 kPa |
230°C at 1.3 kPa |
| vapor pressure: |
2.0 kPa at 145°C |
|
| specific gravity: |
1.032 |
|
| description: |
colorless to yellow liquid |
yellow crystals |
| synonyms: |
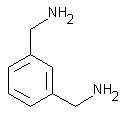
m-xylylenediamine;
1,3-bis(aminomethyl)benzene;
m-xylene-a,a'-diamine;
m-phenylenebis(methylamine) |
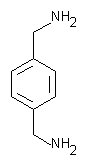
p-xylylenediamine;
1,4-bis(aminomethyl)benzene;
p-xylene-a,a'-diamine;
p-phenylenebis(methylamine) |
| molecular formula: |
C8H12N2 |
C8H12N2 |
| structural formula: |
 |
 |
The analyte air concentrations throughout this method are based on the recommended
sampling and analytical parameters.
1.2 Limit defining parameters
1.2.1 Detection limit of the analytical procedure
The detection limits of the analytical procedure are 24.4 and 30.7 pg for mXDA and pXDA
respectively. These are the amounts of each analyte that will give responses that are
significantly different from the background response of a reagent blank. (Sections 4.1 and
4.2)
1.2.2 Detection limit of the overall procedure
The detection limits of the overall procedure are 4.1 ng per sample (0.27 µg/m3)
and 5.0 ng per sample (0.33 µg/m3) for mXDA and pXDA
respectively. These are the amounts of each analyte spiked on the sampler that will give
responses that are significantly different from the background response of a sampler
blank. (Sections 4.1 and 4.3)
1.2.3 Reliable quantitation limit
The reliable quantitation limits are 13.6 ng per sample (0.91 µg/m3)
and 16.8 ng per sample (1.12 µg/m3) for mXDA and pXDA
respectively. These are the amounts of each analyte spiked on a sampler that will give
signals that are considered the lower limits for precise quantitative measurements.
(Section 4.4)
1.2.4 Precision (analytical procedure)
The precisions of the analytical procedure, measured as the pooled relative standard
deviations over a concentration range equivalent to 0.5 to 2 times the target
concentration, are 0.37% and 0.93% for mXDA and pXDA respectively. (Section 4.5)
1.2.5 Precision (overall procedure)
The precision of the overall procedure at the 95% confidence level for the ambient
temperature 15-day storage test (at the target concentration) is ±10.0% for both mXDA and
pXDA. (Section 4.6). These include an additional 5% for sampling error.
1.2.6 Recovery
The recovery of analyte from samples used in a 15-day storage test remained above 95%
and 97% for mXDA and pXDA respectively when the samples were stored at ambient
temperatures. (Section 4.7)
1.2.7 Reproducibility
Six samples spiked by liquid injection, with a draft copy of this procedure, were
submitted to an SLTC service branch for analysis. The samples were analyzed after nine
days of storage at 0°C. No individual sample result deviated from its theoretical value
by more than the precision reported in Section 1.2.5. (Section 4.8)
2. Sampling Procedure
2.1 Apparatus
 2.1.1 Samples are collected using
a personal sampling pump calibrated, with a sampling device attached, to within ±5% at
the recommended flow rate. 2.1.1 Samples are collected using
a personal sampling pump calibrated, with a sampling device attached, to within ±5% at
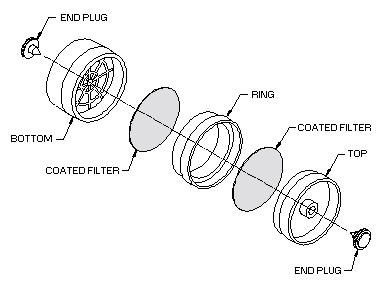
the recommended flow rate. 2.1.2 Samples are collected closed-face using a sampling
device consisting of two sulfuric-acid treated 37-mm Gelman type A/E glass fiber filters
contained in a three-piece polystyrene cassette. The filters are prepared by soaking each
filter with 0.5 mL of 0.26 N sulfuric acid. (0.26N sulfuric acid can be prepared by
diluting 1.5 mL of 36 N sulfuric acid to 200 mL with deionized water.) The filters are
dried in an oven at 100°C and then assembled into three-piece 37-mm
cassettes without support pads. The front filter is separated from the back filter by the
ring section. The cassettes are sealed with shrink bands and the ends are plugged with
plastic plugs. The average pressure drop across this sampling device was found to be 1.2
inches of water when sampling at 1 L/min. The pressure drop was found to remain the same
after 200 L of 80% relative humidity air was drawn through the samplers.
2.2 Reagents
None required
2.3 Technique
2.3.1 Remove the plastic end plugs from the sampling device immediately before
sampling.
2.3.2 Attach the sampling device to the sampling pump with flexible tubing and place
the device in the employee's breathing zone. Position the sampler so it does not impede
work performance or safety.
2.3.3 Do not pass the sampled air through any hose or tubing before it enters the
sampling device.
2.3.4 Immediately after sampling, seal the sampling device with plastic end plugs and
seal and identify with an OSHA Form 21.
2.3.5 Submit at least one blank with each sample set. Blanks should be handled in the
same manner as samples, except no air is drawn through them.
2.3.6 Record sample volumes (in liters of air) for each sample. Also list any compounds
considered potential interferences that could be present in the sampling area.
2.3.7 If any bulk samples are submitted for analysis, ship them in separate containers
from the air samples.
2.4 Sampler capacity
Collection efficiency studies were conducted by drawing humid air through a sampling
device that was attached to a glass U-tube immersed in an oil bath heated to 40°C.
Milligram amounts of mXDA and pXDA were added to the U-tube. The inlet of the U-tube was
attached to a humid air generator so air at approximately 80% relative humidity could be
drawn through it. Tests were done by drawing air for 15 minutes at 1.0 L/min and also for
200 minutes at 1.0 L/min. After sampling, the filters were analyzed. None of the amines
were found on any of the back filters for any of the tests. There was an average of 7.4 µg
of mXDA and 5.6 µg of pXDA found on the front filters for the 15-L samples, and
37.9 µg of mXDA and 26.1 µg of pXDA for the 200-L samples.
2.5 Extraction efficiency
2.5.1 The average extraction efficiency over the range of 0.5 to 2 times the target
concentration is 98.8% and 98.6% for mXDA and pXDA respectively. (Section 4.9.1)
2.5.2 The extraction efficiency at 0.05, 0.1, and 0.2 times the target concentration
was found to be 96.6%, 98.2%, and 96.7% respectively for mXDA and 97.6%, 98.6%, and 97.0%
respectively for pXDA. (Section 4.9.1)
2.5.3 Extracted samples remain stable for at least 24 h. (Section 4.9.2)
2.6 Recommended air volume and sampling rate
2.6.1 For short-term and ceiling samples, sample 15 L of air at 1 L/min (15-min
samples).
2.6.2 For long-term samples, sample 100 L of air at 1 L/min.
2.7 Interferences (sampling)
2.7.1 It is not known if any compounds will severely interfere with the collection of
the analytes on sulfuric acid treated filters.
2.7.2 Suspected interferences should be reported to the laboratory with submitted
samples.
2.8 Safety precautions (sampling)
2.8.1 Attach the sampling equipment to the employee so that it will not interfere with
work performance or safety.
2.8.2 Follow all safety procedures that apply to the work area being sampled.
3. Analytical Procedure
3.1 Apparatus
3.1.1 An HPLC system equipped with an ultraviolet detector. A Hewlett-Packard 1050
Series HPLC consisting of a pumping system, programmable variable wavelength detector and
an autosampler was used in this evaluation.
3.1.2 An HPLC column capable of separating the analyte of interest from any
interferences. A 15-cm × 4.6-mm i.d. Supelcosil™ LC-ABZ column (Supelco, Inc.,
Bellefonte, PA, Catalog no. 5-9140) was used in this evaluation. It is critical that if
this particular column will not be used for more than 6 h, it should be rinsed with water
to remove any buffer salts and ultimately flushed with acetonitrile.
3.1.3 An electronic integrator or some other suitable means of measuring peak heights
or areas. A Waters 860 Networking Computer System was used in this evaluation.
3.1.4 Glass vials with Teflon®-lined caps capable of holding 4 mL.
3.1.5 A dispenser capable of delivering 2.0 mL of extraction solvent to prepare
standards and samples. If a dispenser is not available, a 2.0-mL volumetric pipet may be
used.
3.1.6 A test tube rocker to gently mix the samples during the extraction step. A
Vari-Mix mixer (Thermolyne, Dubuque, IA) was used in this evaluation.
3.1.7 A laboratory centrifuge.
3.2 Reagents
3.2.1 m-Xylylenediamine (mXDA) and p-xylylenediamine (pXDA), reagent
grade. Aldrich Chemical (Milwaukee, WI) Lot KY00202DP mXDA and Lot PF10421AF pXDA were
used in this evaluation. Both of these compounds are corrosive and must be stored under a
blanket of nitrogen.
3.2.2 Acetonitrile, methanol, and water, HPLC grade. The acetonitrile and methanol used
in this evaluation were "Optima" brand from Fisher Chemical (Fair Lawn, NJ) and
the water was from a Millipore Milli-Q water purification system.
3.2.3 Sodium phosphate, monobasic monohydrate (NaH2PO4·H2O),
reagent grade. Fisher Lot 704979 was used in this evaluation.
3.2.4 1-Heptanesulfonic acid, sodium salt, HPLC grade. Aldrich Lot HF06915BF was used
in this evaluation.
3.2.5 Phosphoric acid, reagent grade.
3.2.6 Extraction solvent/mobile phase. The extraction solvent is the same as the mobile
phase used in the HPLC analysis. It consists of 50 mM of 1-heptanesulfonic acid and 50 mM
of NaH2PO4·H2O
in 75/25, water/acetonitrile adjusted to pH 3.0 with phosphoric acid. To prepare 1 L of
the extraction solvent/mobile phase, dissolve (expedite using sonication) 10.1 g of
1-heptanesulfonic acid, sodium salt and 6.9 g of NaH2PO4·H2O
into 750 mL of HPLC grade water and adjust the pH of the solution to 3.0 with phosphoric
acid. Add, with thorough mixing, 250 mL of acetonitrile to the pH-adjusted aqueous
solution.
3.3 Standard preparation
3.3.1 Prepare concentrated standards by accurately weighing approximately 20 mg of each
amine into a 25-mL volumetric flask. Dissolve the amines with methanol. Dilute to the mark
with additional methanol and thoroughly mix the solution. Stock standards are stable for
at least 6 months when stored in brown bottles.
3.3.2 Prepare analytical standards by injecting microliter amounts of stock standards
into 4-mL vials containing 2.0 mL of extraction solvent delivered from the same dispenser
or pipet used to extract samples.
3.3.3 Bracket sample concentrations with analytical standard concentrations. If samples
fall outside of the concentration range of prepared standards, prepare and analyze
additional standards at the appropriate concentrations to ascertain the linearity of
response.
3.4 Sample preparation
3.4.1 Transfer front and back filters to individual 4-mL vials.
3.4.2 Add 2.0 mL of extraction solvent to each vial using the same dispenser or pipet
as used for preparation of standards.
3.4.3 Cap the vials and gently rock them for 15 min.
3.4.4 Centrifuge the sample vials for 10 min at 2000 rpm. Analyze the samples by making
direct injections of the centrifuged extracts.
3.5 Analysis
3.5.1 HPLC conditions
| mobile phase: |
50 mM of 1-heptanesulfonic acid and 50 mM of phosphate buffer
in 75/25, water/acetonitrile at pH 3.0. See 3.2.6 for preparation instructions. |
| flow rate: |
0.8 mL/min |
| UV detector wavelength: |
208 nm |
| output range: |
0.1 absorbance units full-scale (AUFS) |
| output signal: |
recorder output at 1 volt |
| response: |
1 second |
| injection volume: |
25 µL |
| column: |
15-cm × 4.6-mm Supelcosil™ 5-µm LC-ABZ (Supelco, Inc.,
Bellefonte, PA, Catalog No. 5-9140) This column must be stored in 100% acetonitrile. (See
3.1.2.) |
| retention times: |
pXDA, 4.1 min mXDA, 4.6 min |
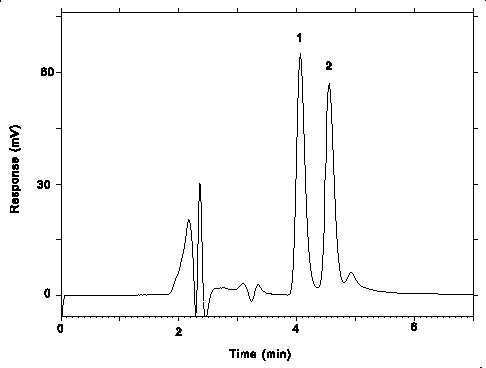
Figure 3.5.1. Chromatogram at the target concentrations.
Key: (1) pXDA, (2) mXDA.
3.5.2 Peak heights or areas are measured by an integrator or other suitable means.
3.5.3 An external standard (ESTD) calibration method is used. Calibration curves are
prepared by plotting micrograms of analyte per sample versus peak heights or area counts
of the standards. Sample concentrations must be bracketed by standards.
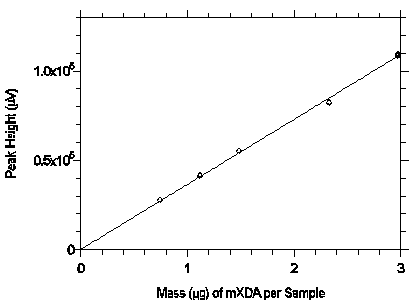
Figure 3.5.3.1. Calibration curve from the data in Table 4.5.1.
The equation of the line is Y=36419X.
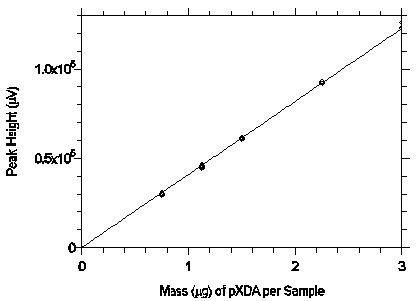
Figure 3.5.3.2 Calibration curve from the data in Table 4.5.2.
The equation of the line is Y=40879X.
3.6 Interferences (analytical)
3.6.1 Any compound that produces a response on a UV detector at 208 nm and has the same
general retention time of any of the analytes of interest is a potential interference.
Possible interferences should be reported to the laboratory with submitted samples by the
industrial hygienist. These interferences should be considered before samples are
extracted.
3.6.2 HPLC parameters may be changed to possibly circumvent interferences.
3.6.3 When necessary, the identity or purity of an analyte peak may be confirmed with
additional analytical data, such as wavelength ratioing. As an aid in choosing appropriate
wavelengths to ratio, the UV spectra for both analytes is given in Section 4.10.
3.7 Calculations
The analyte concentration for samples is obtained from the appropriate calibration
curve in terms of micrograms of analyte per sample. The back filter of each sampler is
analyzed primarily to determine if there was any breakthrough from the front filter during
sampling. If a significant amount of analyte is found on the back filter (e.g., greater
than 25% of the amount found on the front filter), this fact should be reported with
sample results. If any analyte is found on the back filter, it is added to the amount
found on the front filter. This total amount is then corrected by subtracting the total
amount (if any) found on the blank. The air concentration is calculated using the
following formula.
mg/m³ = (µg of analyte per sample)/[(L of air sampled)(extraction efficiency)]
3.8 Safety precautions (analytical)
3.8.1 Adhere to the rules set down in your Chemical Hygiene Plan.
3.8.2 Avoid skin contact and inhalation of all chemicals.
3.8.3 Wear safety glasses and a lab coat at all times while in the lab area.
4. Backup Data
4.1 Determination of detection limits
Detection limits (DL), in general, are defined as the amount (or concentration) of
analyte that gives a response (YDL) that is significantly
different (three standard deviations (SDBR)) from the background
response (YBR).
YDL - YBR = 3(SDBR)
The direct measurment of YBR and SDBR
in chromatographic methods is typically inconvenient and difficult because YBR
is usually extremely low. Estimates of these parameters can be made with data obtained
from the analysis of a series of analytical standards or samples whose responses are in
the vicinity of the background response. The regression curve obtained for a plot of
instrument response versus concentration of analyte will usually be linear. Assuming SDBR
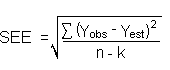
and the precision of data about the curve are similar, the standard error of estimate
(SEE) for the regression curve can be substituted for SDBR in
the above equation. The following calculations derive a formula for DL:
| Yobs |
= observed response |
| Yest |
= estimated response from regression curve |
| n |
= total no. of data points |
| k |
= 2 for a linear regression curve |
At point YDL on the regression curve
YDL = A(DL) + YBR A = analytical sensitivity (slope)
therefore
Substituting 3(SEE) + YBR for YDL gives
4.2 Detection limit of the analytical procedure (DLAP)
The DLAP is measured as the mass of analyte introduced into the chromatographic column.
Ten analytical standards were prepared in equal descending increments with the highest
standard containing 14.16 and 14.31 ng/mL of mXDA and pXDA respectively. These
concentrations produce peaks approximately 10 times the baseline noise of a reagent blank.
These standards, plus a solvent blank, were analyzed and the data obtained were used to
determine the required parameters (A and SEE) for the calculation of the DLAPs. Values of
5.78 and 6.84 for A and 47.0 and 69.9 for SEE were obtained for mXDA and pXDA
respectively. DLAPs were calculated to be 24.4 and 30.7 pg for mXDA and pXDA respectively.
| Table 4.2.1 |
| DLAP for mXDA |
|
| concentration |
mass on column |
peak height |
| (ng/mL) |
(pg) |
(µV) |
|
| 0.00 |
0.00 |
0 |
| 1.416 |
35.4 |
296 |
| 2.832 |
70.8 |
497 |
| 4.248 |
106.2 |
648 |
| 5.664 |
141.6 |
845 |
| 7.080 |
177.0 |
995 |
| 8.495 |
212.4 |
1226 |
| 9.910 |
247.8 |
1494 |
| 11.33 |
283.2 |
1729 |
| 12.74 |
318.5 |
18.31 |
| 14.16 |
354.0 |
2118 |
|
| Table 4.2.2 |
| DLAP for pXDA |
|
| concentration |
mass on column |
peak height |
| (ng/mL) |
(pg) |
(µV) |
|
| 0.00 |
0.00 |
0 |
| 1.430 |
35.8 |
350 |
| 2.861 |
71.5 |
60.9 |
| 4.292 |
107.3 |
867 |
| 5.722 |
143.0 |
1068 |
| 7.152 |
178.8 |
1287 |
| 8.583 |
214.6 |
1451 |
| 10.01 |
250.3 |
17.19 |
| 11.44 |
286.1 |
2164 |
| 12.87 |
321.9 |
2281 |
| 14.30 |
357.6 |
2487 |
|
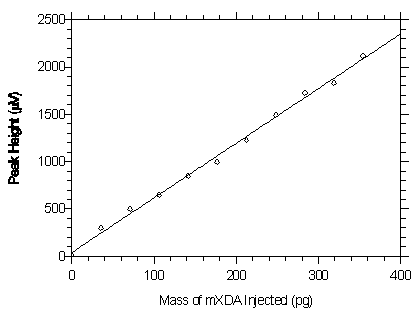
Figure 4.2.1. Plot of the data from Table 4.2.1 to determine the DLAP of 24.4 pg for mXDA.
The equation of the line is Y = 5.78X + 39.0.
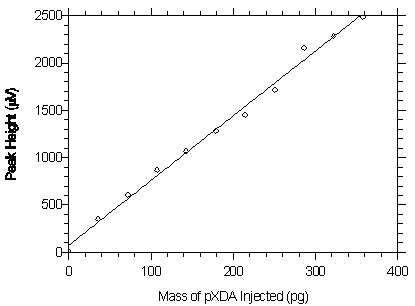
Figure 4.2.2. Plot of the data from Table 4.2.2 to determine the DLAP of 30.7 pg for pXDA.
The equation of the line is Y = 6.84X + 75.2.
4.3 Detection limit of the overall procedure (DLOP)
The DLOP is measured as mass per sample and expressed as equivalent air concentrations,
based on the recommended sampling parameters. Ten samplers were spiked with equal
descending increments of mXDA and pXDA such that the highest sampler loading was 28.32 and
28.61 ng/sample respectively. These are the amounts, when spiked on a sampler, that would
produce peaks approximately 10 times the baseline noise for a sample blank. These spiked
samplers, plus a sample blank, were analyzed with the recommended analytical parameters,
and the data obtained used to calculate the required parameters (A and SEE) for the
calculation of the DLOPs. Values of 77.7 and 73.4 for A and 106 and 123 for SEE were
obtained for mXDA and pXDA respectively. The DLOPs were calculated to be 4.1 ng/sample
(0.27 µg/m3) and 5.0 ng/sample (0.33 µg/m3)
for mXDA and pXDA respectively.
| Table 4.3.1 |
| DLOP for mXDA |
|
mass (ng)
per sample |
peak height
(µV) |
|
| 0.00 |
0 |
| 2.832 |
483 |
| 5.664 |
490 |
| 8.496 |
668 |
| 11.33 |
939 |
| 14.16 |
1209 |
| 16.99 |
1314 |
| 19.82 |
1607 |
| 22.66 |
1747 |
| 25.49 |
1965 |
| 28.32 |
2450 |
|
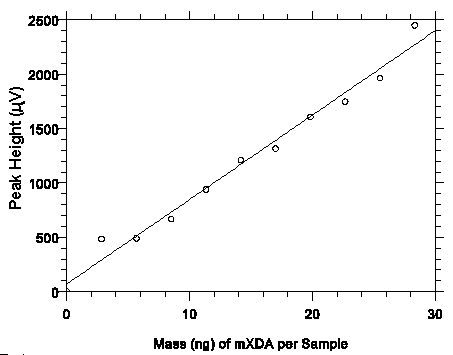
Figure 4.3.1. Plot of data from table 4.3.1 to determine the DLOP of 4.1 ng/sample (0.27 µg/m3)
for mXDA. The equation of the line is Y = 77.7X + 70.1.
| Table 4.3.2 |
| DLOP for pXDA |
|
mass (ng)
per sample |
peak height
(µV) |
|
| 0.00 |
745 |
| 2.861 |
705 |
| 5.722 |
880 |
| 8.583 |
1111 |
| 11.44 |
1288 |
| 14.30 |
1478 |
| 17.17 |
1725 |
| 20.03 |
2020 |
| 22.89 |
2156 |
| 25.75 |
2325 |
| 28.61 |
2852 |
|
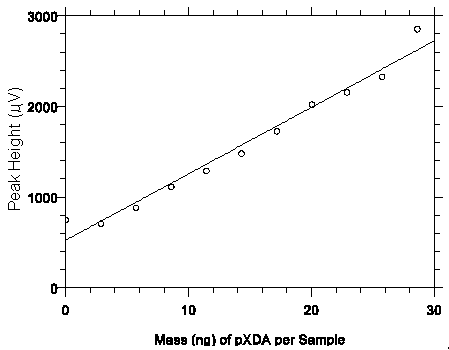
Figure 4.3.2. Plot of data from Table 4.3.2 to determine the DLOP of 5.0 ng/sample (0.33 µg/m3)
for mXDA. The equation of the line is Y = 73.4X + 522.
4.4 Reliable quantitation limit (RQL)
The RQL is considered the lower limit for precise quantitative measurements. It is
determined from the regression line data obtained for the calculation of the DLOPs
(Section 4.3). The RQL is defined as the amount of analyte that gives a response (YRQL)
such that
YRQL - YBR = 10(SDBR)
therefore
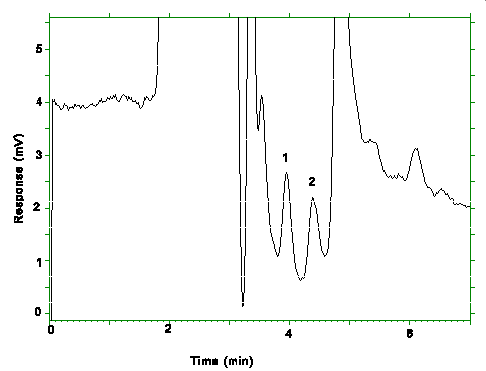 Figure 4.4. Chromatogram of the RQLs. Key: (1)pXDA, (2)mXDA.
The RQLs were calculated to be 13.6 ng/sample (0.91 µg/m3)
and 16.8 ng/sample (1.12 µg/m3) for mXDA and pXDA
respectively. The recoveries at these levels are 97.7% for mXDA and 105.1% for pXDA.
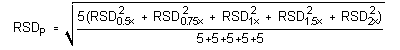
4.5 Precision (analytical method)
The precisions of the analytical procedure are defined as the pooled relative standard
deviations (RSDP). Relative standard deviations were determined
from six replicate injections of standards at 0.5, 0.75, 1, 1.5, and 2 times the target
concentrations. After assuring that the RSDs satisfy the Cochran test for homogeneity at
the 95% confidence level, the RSDP for each analyte was
calculated to be 0.37% for mXDA and 0.93% for pXDA.
| Table 4.5.1 |
| Instrument Response to mXDA |
|
× target concn
(µg/sample) |
0.5×
0.743 |
0.75×
1.115 |
1.0×
1.487 |
1.5×
2.330 |
2.0×
2.974 |
|
peak heights
(µV)
|
27970
27689
27650
27725
27681
27609 |
41402
41270
41533
41536
41462
41178 |
55092
55000
55437
55117
54978
55125 |
82428
82257
82444
82372
82203
82570 |
109852
108624
109552
108964
109860
108987 |
|
mean
SD
RSD (%) |
27721
128.2
0.46 |
41397
145.7
0.35 |
55125
164.8
0.30 |
82379
133.4
0.16 |
109306
519.5
0.48 |
|
The Cochran test for homogeneity:
| g = |
largest RSD2
RSD20.5× + RSD20.75× + RSD21× + RSD21.5× + RSD22× |
= 0.339 |
The critical value of the g statistic at the 95% confidence level for five
variances, each associated with six observations, is 0.5065. Because the g
statistic does not exceed this value, the RSDs can be considered equal and they can be
pooled (RSDP) to give an estimated RSD for the concentration
range studied.
 |
= 0.37% |
Table 4.5.2
Instrument Response to pXDA
|
× target concn
(µg/sample) |
0.5×
0.751 |
0.75×
1.126 |
1.0×
1.502 |
1.5×
2.253 |
2.0×
3.004 |
|
peak heights
(µV) |
30098
30197
30351
29540
30118
30389 |
44767
46184
45999
45007
46063
45854 |
61585
60967
60958
61248
61611
61622 |
92635
92615
92565
92557
92898
91928 |
123100
122820
122680
122980
123140
126150 |
|
mean
SD
RSD (%) |
30116
306.1
1.02 |
45646
602.0
1.32 |
61332
318.2
0.52 |
92533
321.9
0.35 |
123478
1320
1.07 |
|
The Cochran test for homogeneity:
| g = |
largest RSD2
RSD20.5× + RSD20.75× + RSD21× + RSD21.5× + RSD22× |
= 0.403 |
The critical value of the g statistic at the 95% confidence level for five
variances, each associated with six observations, is 0.5065. Because the g
statistic does not exceed this value, the RSDs can be considered equal and they can be
pooled (RSDP) to give an estimated RSD for the concentration
range studied.
|
= 0.93% |
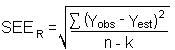
4.6 Precision (overall procedure)
The precision of the overall procedure is determined from the storage data in Section
4.7. The determination of the standard error of estimate (SEER)
for a regression line plotted through the graphed storage data allows the inclusion of
storage time as one of the factors affecting overall precision. The SEER
is similar to the standard deviation, except it is a measure of dispersion of data about a
regression line instead of about a mean. It is determined with the following equation:
| n |
= total no. of data points |
| k |
= 2 for linear regression |
| k |
= 3 for quadratic regression |
| Yobs |
= observed % recovery at a given time |
| Yest |
= estimated % recovery from the regression line at the same given time |
An additional 5% for pump error (SP) is added to the SEER by
the addition of variances to obtain the total standard error of estimate.
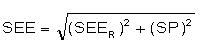
The precision at the 95% confidence level is obtained by multiplying the standard error
of estimate (with pump error included) by 1.96 (the z statistic from the standard
normal distribution at the 95% confidence level). The 95% confidence intervals are drawn
about their respective regression lines in the storage graphs, as shown in Figures
4.7.1.1., 4.7.1.2., 4.7.2.1. and 4.7.2.2. The precisions of the overall procedure of
±10.0% were obtained from Figures 4.7.1.2. and 4.7.2.2.
4.7 Storage test
Thirty-six storage samples were prepared by spiking sulfuric acid-treated glass fiber
filters with 1.487 µg of mXDA and 1.502 µg of pXDA. The filters were then
assembled in cassettes and 15 L of 80% RH air was drawn through the samplers at 1 L/min.
Six samples were analyzed immediately after generation, fifteen were stored in a
refrigerator at 0°C, and fifteen were stored in a closed drawer at ambient temperatures
of 20-25°C. At three-day intervals, three samples were selected from each of the two
storage sets and analyzed.
Table 4.7.1
Storage Test for mXDA
|
time
(days) |
refrigerated storage
recovery (%) |
ambient storage
recovery (%) |
|
0
0
3
6
9
12
15 |
97.6
95.6
96.7
95.4
95.5
96.9
97.0 |
97.7
96.8
96.3
96.3
95.8
97.2
96.8 |
96.1
96.1
96.6
95.9
95.5
96.8
96.2 |
97.6
95.6
97.0
96.2
96.0
94.9
94.5 |
97.7
96.8
97.7
95.8
95.5
94.1
95.9 |
96.1
96.1
97.6
97.1
97.0
94.0
93.9 |
|

Figure 4.7.1.1. Refrigerated storage test for mXDA.
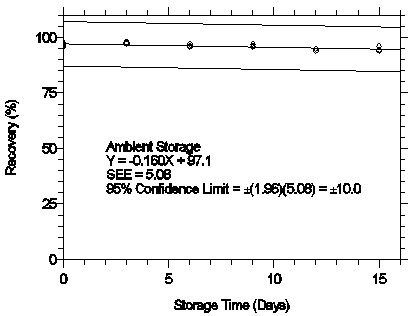
Figure 4.7.1.2. Ambient storage test for mXDA.
Table 4.7.2
Storage Test for pXDA
|
time
(days) |
refrigerated storage
recovery (%) |
ambient storage
recovery (%) |
|
0
0
3
6
9
12
15 |
98.0
100.5
98.6
97.0
97.5
98.3
97.9 |
99.4
98.3
98.6
98.1
97.4
97.9
94.7 |
97.4
97.7
98.4
96.9
97.3
97.3
98.1 |
98.0
100.5
98.7
97.8
97.9
97.0
96.0 |
99.4
98.3
99.0
97.7
97.1
96.5
98.2 |
97.4
97.7
98.8
99.4
98.5
96.7
95.7 |
|
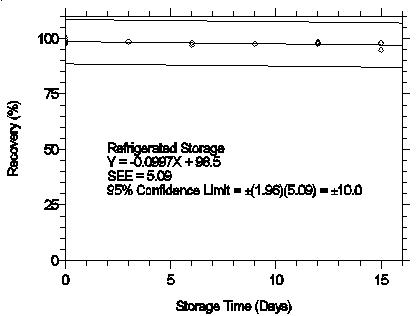
Figure 4.7.2.1. Refrigerated storage test for pXDA.
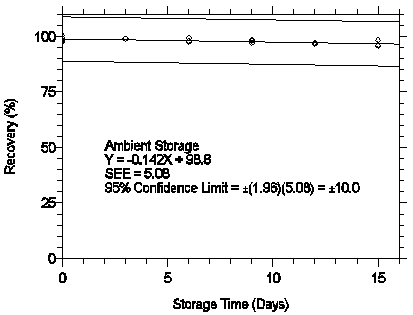
Figure 4.7.2.2. Ambient storage test for pXDA.
4.8 Reproducibility
Six samples were prepared by injecting microliter quantities of standards onto sulfuric
acid-treated glass fiber filters, assembling the filters into cassettes, and
drawing 15 L of 80% relative humidity air through the samplers at 1 L/min. The samples
were submitted to an SLTC service branch and were analyzed nine days later. No sample
result deviated greater than the precisions of the overall procedure determined in Section
4.7, which are ±10.0% for both mXDA and pXDA samples.
Table 4.8.1
Reproducibility Data for mXDA
|
| sample |
µg reported |
µg expected |
percent |
deviation
|
|
1
2
3
4
5
6 |
1.533
0.722
2.960
1.455
2.908
0.723 |
1.487
0.743
2.974
1.487
2.974
0.743 |
103.1
97.2
99.5
97.8
97.8
97.3 |
+3.1
-2.8
-0.5
-2.2
-2.2
-2.7 |
|
Table 4.8.2
Reproducibility Data for pXDA
|
| sample |
µg reported |
µg expected |
percent |
deviation |
|
1
2
3
4
5
6 |
1.534
0.755
3.042
1.509
2.992
0.729 |
1.502
0.751
3.004
1.502
3.004
0.751 |
102.1
100.5
101.3
100.5
99.6
97.1 |
+2.1
+0.5
+1.3
+0.5
-0.4
-2.9 |
|
4.9 Extraction efficiency and stability of extracted samples
4.9.1 Extraction efficiency
The extraction efficiencies (EE) for mXDA and pXDA were determined by injecting
standards onto sulfuric acid treated filters with amounts equivalent to 0.05 to 2 times
the target concentrations. These samples were stored overnight at ambient temperature and
then extracted and analyzed. The average extraction efficiencies over the working range of
0.5 to 2 times the target concentrations are 98.8% and 98.6% for mXDA and pXDA
respectively.
Table 4.9.1.1
Extraction Efficiency for mXDA
|
× target concn
mass spiked (µg) |
0.05×
0.0743 |
0.1×
0.1487 |
0.2×
0.2974 |
0.5×
0.7430 |
1.0×
1.487 |
2.0×
2.974 |
|
| EE (%) |
100.1
95.2
96.2
96.6
97.4
94.1 |
97.5
102.2
99.5
98.2
97.5
94.1 |
98.5
98.2
97.5
96.2
97.8
91.8 |
98.8
102.0
104.3
99.1
98.3
98.7 |
96.8
97.8
101.4
98.0
98.5
97.6 |
97.1
96.7
98.0
98.2
97.8
99.2 |
|
| mean |
96.6 |
98.2 |
96.7 |
100.2 |
98.4 |
97.8 |
|
Table 4.9.1.2
Extraction Efficiency for pXDA
|
× target concn
mass spiked (µg) |
0.05×
0.0751 |
0.1×
0.1502 |
0.2×
0.3004 |
0.5×
0.7510 |
1.0×
1.502 |
2.0×
3.004 |
|
| EE (%) |
97.1
98.7
95.9
97.6
103.5
92.7 |
99.2
97.9
100.5
100.5
97.2
96.5 |
97.5
98.5
97.2
99.5
96.9
92.5 |
97.5
96.8
99.5
98.4
98.7
97.1 |
98.1
98.2
98.7
98.9
99.7
98.9 |
98.9
98.7
99.5
99.4
98.1
99.3 |
|
| mean |
97.6 |
98.6 |
97.0 |
98.0 |
98.8 |
99.0 |
|
4.9.2 Stability of extracted samples
The stability of extracted samples was investigated by reanalyzing the target
concentration samples 24 h after initial analysis. After the original analysis was
performed three vials were recapped with new septa while the remaining three retained
their punctured septa. The samples were reanalyzed with fresh standards. The average
percent change was -1.0% and +0.3% for samples that were resealed with new septa, and
+0.5% and +0.9% for those that retained their punctured septa for mXDA and pXDA
respectively.
Table 4.9.2.1
Stability of Extracted mXDA Samples
|
| punctured septa replaced |
punctured septa retained |
initial
EE
(%) |
EE after
one day
(%) |
difference |
initial
EE
(%) |
EE after
one day
(%) |
difference |
|
96.8
97.8
101.4
98.7 |
96.8
97.5
98.6
(averages)
97.6 |
0.0
-0.3
-2.8
-1.0 |
98.0
98.5
97.6
98.0 |
98.6
98.6
98.3
(averages)
98.5 |
+0.6
+0.1
+0.7
+0.5 |
|
Table 4.9.2.2
Stability of Extracted pXDA Samples
|
| punctured septa replaced |
punctured septa retained |
initial
EE
(%) |
EE after
one day
(%) |
difference |
initial
EE
(%) |
EE after
one day
(%) |
difference |
|
98.1
98.2
98.7
98.3 |
98.3
98.5
99.0
(averages)
98.6 |
+0.2
+0.3
+0.3
+0.3 |
98.9
99.7
98.9
99.2 |
100.3
100.3
99.7
(averages)
100.1 |
+1.4
+0.6
+0.8
+0.9 |
|
4.10 Qualitative analysis
UV spectra for both analytes were obtained from a Waters 990 Photodiode Array Detector
by injecting a standard using the same conditions given in Section 3.5.1.
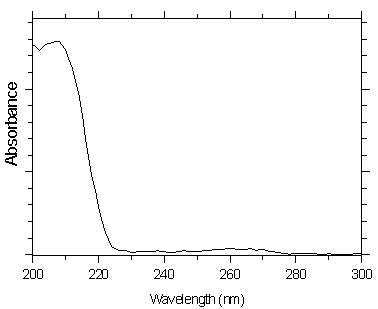
Figure 4.10.1. UV spectra of mXDA.
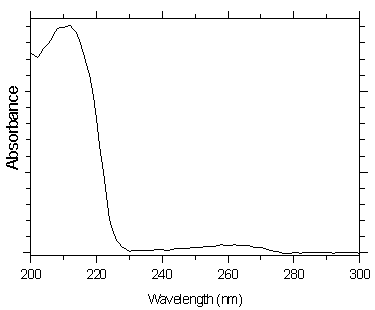
Figure 4.10.2. UV spectra of pXDA.
5. References
5.1. OSHA Analytical Methods Manual; Vol. 3, Publ. #4542, U.S. Department of
Labor, Occupational Safety and Health Administration; OSHA Salt Lake Technical Center:
Salt Lake City, UT, 1990; Method 57: 4,4'-Methylenedianiline; American Conference of
Governmental Industrial Hygienists (ACGIH): Cincinnati, OH.
5.2. ibid. Method 65: Benzidine, 3,3'-Dichlorobenzidine, 2,4- and 2,6-Toluenediamine.
5.3. ibid. Method 71: o-Dianisidine, 4,4'-Methylenebis(o-chloroaniline), o-Tolidine.
5.4. ibid. Method 73: o-, m-, and p-Toluidine.
5.5. ibid. Method 78: Diphenylamine, N-Isopropylaniline.
5.6. ibid., Vol. 4, Method No. 87; m-, o-, and p-Phenylenediamine.
5.7. ibid. Method No. 93; 4-Aminobiphenyl, 1-Naphthylamine and 2-Naphthylamine.
5.8. "American Conference of Governmental Industrial Hygienists: Documentation
of the Threshold Limit Values"; 5th ed., p. 638, Cincinnati, OH (1986).
5.9. Material Safety Data Sheet: m-xylylenediamine, Aldrich Chemical Co.,
Milwaukee, WI, June 1989.
5.10. Material Safety Data Sheet: p-xylylenediamine, Aldrich Chemical Co.,
Milwaukee, WI, November 1990.
5.11. Lewis, R.J., Sr., Ed. "Sax's Dangerous Properties of Industrial
Materials", 8th ed., vol 3; Van Nostrand Reinhold Co.: New York, NY, 1992.
5.12 Bell, A.; Smith, J.G.; Kibler, C.J. J. Polym. Sci. A1, 19 (1965) in
"Polyamide Fibers" in Encyclopedia of Chemical Technology 3rd ed., Vol.
18, p. 400, by J. H. Saunders, Monsanto Company.
|
