AUSTRALIA WHEAT:
CURRENT RAINFALL PATTERN MAY REDUCE GRAIN YIELDS THIS SEASON
 |
WHEAT
REGION: Background Information RAINFALL GRAPHS: Cumulative Precipitation May 1 to August 15 WHEAT REGION WEATHER STATIONS: Map SATELLITE IMAGERY: NSW Agricultural Area | 2000-1997-1996 | Previous Reports: |
Australia Wheat
Region Review:
Rainfall
total accumulation and distribution has remained below average
for the growing season. Western Australia continues to be well
below normal for the period from May 1 to August 1, as does most
of the grain growing area of Queensland. South Australia,
Victoria, and New South Wales are all slightly below average for
total cumulative precipitation.
Rainfall Analysis: Eighty-four stations were selected from Australia's main wheat and grain regions providing coverage of all five major grain producing states. Cumulative precipitation data was aggregated for all stations to perform a year to year comparison. The cumulative rainfall for the wheat region this year is the lowest of the previous four years. The analysis revealed that 1997 had the most similar rainfall regime to the current season. The pattern of the 2000 rainfall accumulation by state is very similar to that of 1997 on a state by state basis, as well as nationwide. A comparison to the 30-year average was calculated for the eighty-four stations as well, with the years 1997 and 2000 falling noticeably below the 30-year normal. If the trend continues it will irreversibly reduce the yield potential of the Australia winter crops for the 2000/01 season. [Wheat Region Rainfall Analysis] [Wheat Region Weather Station Map]
New South Wales and Queensland: Queensland, in northeast Australia typically contributes the smaller share to Australia's total production. However, the state of Queensland also has the greatest variability in yields for the last ten years of data. Analysis of Queensland's cumulative precipitation data with start of season date set at of April 15, reveals significantly lower seasonal rainfall totals and the lowest in five seasons. Satellite data acquired along the border of Northern New South Wales and southern Queensland shows very similar vegetation health and vigor response as seen during the 1997/98 season. New South Wales is typically the second largest producer in Australia. Examination of Landsat satellite data from 1996 shows much more abundant and or healthier green vegetation as compared to the current season. The significantly higher rainfall amounts of 1996 would be the major contributing factors for the difference in yields. Yield data from the states confirms 1996 being a high yielding year in both Queensland and New South Wales. The 2000/01 season looks very similar to 1997/98 season and will likely produce similar yields. [Northern New South Wales Scene Comparison 2000-1997-1996]
Summary: Conditions have been drier than normal, with many areas experiencing the driest conditions in the previous four seasons. Western Australia had a difficult start at planting and rainfall has remained below normal. South Australia, Victoria, and New South Wales appear to have satisfactory crop conditions, while data from Queensland shows the significantly below-normal rainfall. Australia is expected to have overall production levels above those of the 1997/98 season. However, production may be adjusted downward if no improvement in the rainfall pattern materializes during the next two weeks.
For more information, contact Jim Crutchfield with the Production Estimates and Crop Assessment Division on (202) 690-0135 or by e-mail at crutchfieldj@fas.usda.gov.
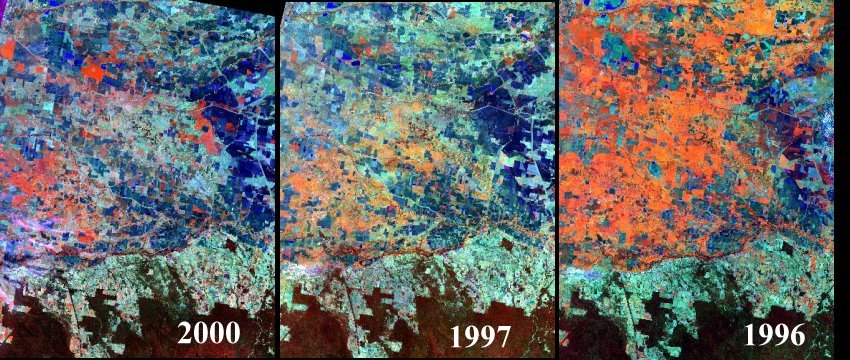
Northern New South Wales Scene Comparison
2000-1997-1996
Northern New South Wales Scene Comparison 2000-1997-1996
| top of page
Four million acres of land are
covered in this sub-image scene near the border of Queensland
having major cotton and wheat production. The scenes were acqured
during the first half of July in their respective years. The crop
area can be distinguished by the notceable red color tones in
this false color satellite image. Crops in this region reflect
strongly in the near and mid-infrared wavelengths which are
displayed as red on the computer screen. Therefore the 2000
season and 1997 appear quite similar in green up and extent of
vegetation. However the crop mix appears to be different as seen
by more red tones which may indicate more grains planted and less
pulses in 2000 compared to 1997. It should be noted that the
northern New South Wales and Queensland had very high yields in
1996.
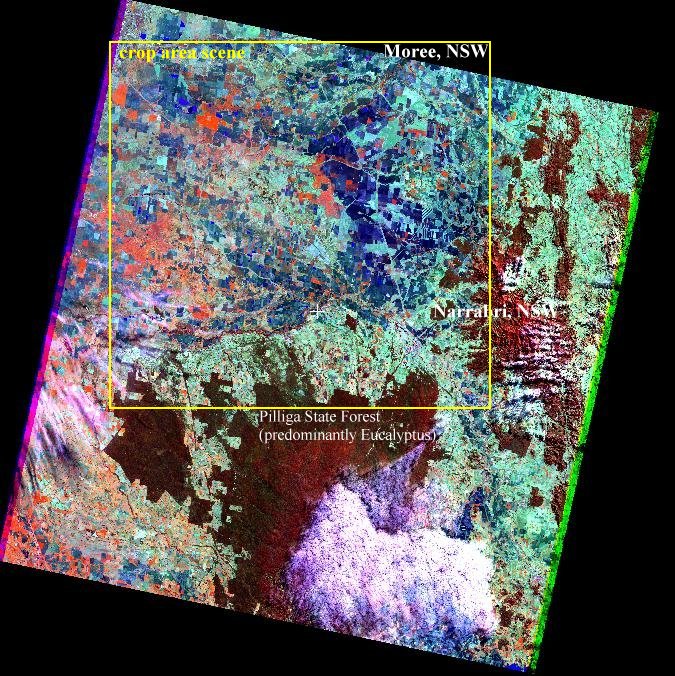
Northern
New South Wales
Northern New South Wales Full Scene | top of page
Australia Wheat Region Weather Stations
Australia Wheat Region Weather Stations | top of page

Rainfall Accumulation Since Planting
Rainfall Accumulation Since
Planting (May 1 through August 15) | Stations used in Comparison | top of page

Wheat Region Background Information
Australia Wheat and Climate
| top
of page
Wheat is Australia’s most important crop having a
seasonal gross value approaching three billion Australian
dollars. Australian wheat is a major competitor of US wheat
exports. Australian wheat is grown as a ‘winter’ crop
(autumn-winter-spring) often in rotation with some form of
pasture. Wheat production is concentrated on the mainland in a
narrow crescent know as the wheat-belt. The eastern portion of
the wheat-belt stretches in a curve, inland of the dividing
range, from central Queensland through New South Wales, Victoria,
and southern South Australia. The western portion of the wheat
belt continues around the south west area of Western Australia.
The acreage planted to wheat during recent season has averaged 11
million hectares producing 19 million tons. Much of the wheat
growing region is in sub-humid and semi-arid zones. This region
has large areas of red-brown and black soils that are less
leached and more fertile. These support Australia's wheat
industry. Interestingly, Australian soil generally does not show
a consistent correlation with climate, mainly because of the
persistence in certain regions of leached soils formed in ancient
wetter climatic conditions. The remaining portion of the wheat
belt is grown in the higher-rainfall areas. These soils are low
fertility, often needing trace elements as well as phosphorus,
nitrogen, and sulfur. Artificial fertilizers can allow these
soils to support highly productive pastures which have potential
for mixed farming. In general, the Australian wheat, and other
major crops (with the exception of sugarcane) are grown between
the two extreme climatic zones. The interior edge of the
agricultural crescent is formed by the exceptionally dry and
erratic preciptation pattern of the interior, and the
geographical outer edge of the wheat-belt crescent is created by
the excessive moisture of the coastal climate where disease
problems such as rust begin occur at levels which make wheat less
economically feasible to grow. Winter rains over this narrow belt
can be highly variable though in most years provides the needed
moisture levels for crop growth. Virtually all of Australia wheat
is rainfed. Irrigation is applied to higher value crops such as
cotton and rice.
For more information, contact Jim Crutchfield with the Production Estimates and Crop Assessment Division on (202) 690-0135 or by e-mail at crutchfieldj@fas.usda.gov.