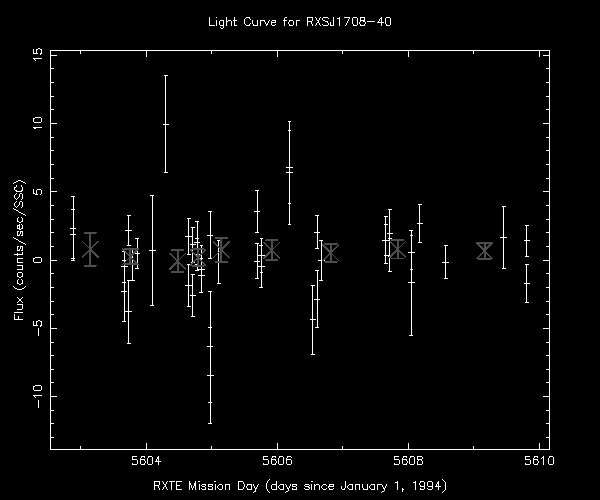
This plot shows the quick-look data for RXSJ1708-40. Flux is plotted versus the
RXTE Mission Day (defined as the number of days since January 1, 1994,
or MJD 49353). Uncertainties in the flux are shown by vertical bars extending
above and below each data point.
Marks with crosses are weighted averages over 5 observations.