Light Curves and What They Can Tell Us
A light curve is a graph which shows the brightness of an object over a
period of time. In the study of objects which change their brightness over
time, such as novae,
supernovae, and
variable
stars, the light curve
is a simple but valuable tool to a scientist. A sample light curve is shown in
Figure 1. The light curve is the graph, or plot, generated from the following data:
|
Date |
Brightness
(Magnitude) |
Date |
Brightness
(Magnitude) |
| April 21 | 9.2 | June 20 | 8.7 |
| April 27 | 9.3 | June 26 | 8.3 |
| May 3 | 9.7 | July 2 | 8.6 |
| May 9 | 9.9 | July 8 | 9.1 |
| May 15 | 9.6 | July 14 | 9.1 |
| May 21 | 9.8 | July 20 | 9.2 |
| May 27 | 9.9 | July 26 | 9.5 |
| June 2 | 9.7 | Aug 1 | 9.9 |
| June 8 | 9.1 | Aug 7 | 9.7 |
| June 14 | 8.8 | Aug 13 | 9.7 |
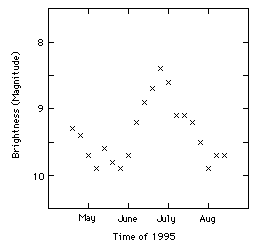
Figure 1
The plot shows the brightness of a certain astronomical object viewed through a
telescope every 6 days over the course of a few months. This gives us a
light curve of the object we have measured. But light curves can be generated
for any measure of brightness which is repeated over and over in time.
So, if we
measured the number of
X-rays being emitted
by a star during every second for an hour, we could generate a light curve from
our observations.
How do we use light curves to tell us something useful?
The record of changes in brightness that a light curve provides can help
astronomers understand processes at work within the star (or stellar
system) and identify specific categories (or classes) of stellar events.
For example, once a light curve has been made for a certain stellar object,
it can be compared to standard light curves to help identify the type of
object being studied.
If the light curve you measured looked like Figure 2, then you
could identify your object as an eclipsing
binary star.
We can also tell from this light curve that it takes 10 days for one of the
stars in the binary to
orbit completely around the other.
Astronomers would say "the orbital period of
the binary system is 10 days."

Figure 2
If the light curve looked like Figure 3, scientists would know that this
signals the death of a star by a massive explosion called a supernova!
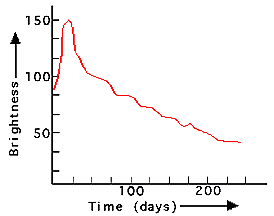
Figure 3
|