 |
|
|||
State Energy Profile - ColoradoEnergy Information Administration - State Energy Profileshttp://tonto.eia.doe.gov/state |
||||||
|---|---|---|---|---|---|---|
|
||||||
|
Last Update: January 02, 2009
Next Update: January 08 , 2009 |
||||||
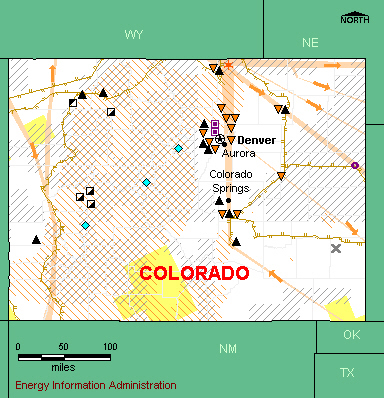
OverviewResources and ConsumptionColorado has substantial conventional fossil fuel and renewable energy resources. The State contains several fossil fuel-rich basins, including the Sand Walsh, Piceance, Paradox, and San Juan basins in the west, and the Denver and Raton basins in the east. Seven of the Nation’s 100 largest natural gas fields and two of its 100 largest oil fields are found in Colorado. Substantial deposits of bituminous, subbituminous, and lignite coal are also found in the State. Colorado's high Rocky Mountain ridges offer wind power potential, and geologic activity in the mountain areas provides potential for geothermal power development. Major rivers flowing from the Rocky Mountains offer hydroelectric power resources. Corn grown in the flat eastern part of the State offers potential resources for ethanol production. The Colorado economy is not energy intensive. The transportation and residential sectors are the leading energy-consuming sectors in the State. PetroleumColorado oil production typically accounts for around 1 percent of the annual U.S. total. Most production takes place in the Denver and Piceance Basins. Crude oil output serves Colorado’s two refineries in Commerce City north of Denver. Several petroleum product pipelines from Wyoming, Texas, and Oklahoma help supply the Colorado market. The use of oxygenated motor gasoline is required during the winter months in the Denver/Boulder and Ft. Collins areas. Although the Denver metropolitan area was the first area in the country to require the use of motor gasoline blended with ethanol to reduce carbon monoxide emissions, the State is relatively new to large-scale ethanol production. Colorado produces ethanol mostly from corn at small facilities in the northeastern part of the State. Colorado’s smallest ethanol production plant is co-located with the Coors brewery in Golden and uses waste beer to produce ethanol for fuel consumption. Although its proven crude oil reserves account for only about 1 percent of the U.S. total, Colorado has enormous deposits of oil shale rock, known as marlstone, which can be converted into crude oil through destructive distillation. The Green River Formation, a group of basins in Colorado, Wyoming, and Utah, hold the largest know oil shale deposits in the world. Colorado’s oil shale deposits, concentrated in the Piceance Basin in the western part of the State, hold an estimated 1 trillion barrels of oil—as much oil as the entire world’s proven oil reserves. Although this natural resource holds tremendous promise, oil shale development remains speculative and faces several major obstacles involving technological feasibility, economic viability, resource ownership, and environmental considerations. Pilot oil shale projects have been undertaken in the area, but the construction of commercial oil shale production facilities in Colorado is not permitted prior to 2010, pending the implementation of the U.S. Department of Interior’s oil shale leasing program. Natural GasColorado is a top natural gas-producing State. Conventional and unconventional output from several Colorado basins typically accounts for more than 5 percent of annual U.S. natural gas production. Coalbed methane (unconventional natural gas produced from coal seams) accounts for just over half of Colorado's natural gas production. Coalbed methane production is active in the San Juan and Raton Basins, and further development is possible in northwest Colorado’s Piceance Basin, which holds the second-largest proved reserves in the Nation. The industrial and residential sectors are the leading natural gas-consuming sectors in Colorado. About three-fourths of Colorado households use natural gas as their primary energy source for home heating, one of the highest shares in the Nation. Colorado uses only about two-fifths of its natural gas production. The remainder is transported to California and to Midwest markets. Colorado’s natural gas production is growing, and producers have proposed a new pipeline to help move rapidly increasing output to the Midwest. The proposed system, known as the Rockies Express Pipeline, will originate in the Piceance Basin and is set to begin service in January 2008. Coal, Electricity, and RenewablesCoal- and natural gas-fired power plants dominate electricity generation in Colorado. Coal-fired plants account for over seven-tenths of the State’s generation and natural gas-fired plants account for close to one-fourth. Colorado produces coal from both underground and surface mines, primarily in its western basins, and large quantities of coal are shipped in and out of the State by rail. Colorado uses about one-fourth of its coal output and transports the remainder to markets throughout the United States. Colorado also brings in coal, primarily from Wyoming, to supplement local production. Hydroelectric and wind power facilities account for most of the State’s electricity generation from renewable sources. However, much of Colorado’s substantial renewable energy potential remains to be developed, and the State currently ranks relatively low in renewable energy generation. Less than one-fifth of Colorado households use electricity as their main energy source for home heating. |
|
| Economy | ||||
| Population and Employment | Colorado | U.S. Rank | Period | |||||||
| Population | 4.9 million | 22 |
2007 | |||||||
| Civilian Labor Force | 2.7 million | 22 |
2007 | |||||||
| Per Capita Personal Income | $41,042 | 11 |
2007 | |||||||
| Industry | Colorado | U.S. Rank | Period | |||||||
| Gross Domestic Product by State | $236.3 billion | 20 | 2007 | |||||||
| Land in Farms | 31.1 million acres | 11 |
2002 | |||||||
| Market Value of Agricultural Products Sold | $4.5 billion | 16 |
2002 | |||||||
| Prices | ||||
| Petroleum | Colorado | U.S. Avg. | Period | |||||||
| Domestic Crude Oil First Purchase |
$95.55/barrel
|
$98.5/barrel | Sep-08 | |||||||
| No. 2 Heating Oil, Residential | — | $3.666/gal | Sep-08 | |||||||
| Regular Motor Gasoline Sold Through Retail Outlets (Excluding Taxes) | $3.207/gal | $3.207/gal | Sep-08 | |||||||
| State Tax Rate on Motor Gasoline (other taxes may apply) |
$0.22/gal | $0.2159/gal | Aug-08 | |||||||
| No. 2 Diesel Fuel Sold Through Retail Outlets (Excluding Taxes) | — | $3.484/gal | Sep-08 | |||||||
| State Tax Rate on On-Highway Diesel (other taxes may apply) |
$0.205/gal | $0.2214/gal | Aug-08 | |||||||
| Natural Gas | Colorado | U.S. Avg. | Period | |||||||
| Wellhead | $6.12/thousand cu ft | $6.40/thousand cu ft | 2006 | |||||||
| City Gate | $6.24/thousand cu ft | $8.96/thousand cu ft | Sep-08 | |||||||
| Residential | $10.35/thousand cu ft | $17.94/thousand cu ft | Sep-08 | |||||||
| Coal | Colorado | U.S. Avg. | Period | |||||||
| Average Open Market Sales Price | $24.91/short ton | $26.20/short ton | 2007 | |||||||
| Delivered to Electric Power Sector | $ 1.53/million Btu | $ 2.16 /million Btu | Sep-08 | |||||||
| Electricity | Colorado | U.S. Avg. | Period | |||||||
| Residential | 11.01 cents/kWh | 11.94 cents/kWh | Sep-08 | |||||||
| Commercial | 9.36 cents/kWh | 10.77 cents/kWh | Sep-08 | |||||||
| Industrial | 7.31 cents/kWh | 7.36 cents/kWh | Sep-08 | |||||||
|
|||||||||||||||||||||||||
| Reserves | Colorado | Share of U.S. | Period | ||||||||||||||||||||||
| Crude Oil | 304 million barrels | 1.4% | 2007 | ||||||||||||||||||||||
| Dry Natural Gas | 21,851 billion cu ft | 9.2% | 2007 | ||||||||||||||||||||||
| Natural Gas Liquids | 559 million barrels | 6.1% | 2007 | ||||||||||||||||||||||
| Recoverable Coal at Producing Mines | 328 million short tons | 1.7 % | 2007 | ||||||||||||||||||||||
| Rotary Rigs & Wells | Colorado | Share of U.S. | Period | ||||||||||||||||||||||
| Rotary Rigs in Operation | 107 | 6.0% | 2007 | ||||||||||||||||||||||
| Crude Oil Producing Wells | 7,533 | 1.5% | 2007 | ||||||||||||||||||||||
| Natural Gas Producing Wells | 20,568 | 4.6% | 2006 | ||||||||||||||||||||||
| Production | Colorado | Share of U.S. | Period | ||||||||||||||||||||||
| Total Energy | 2,249 trillion Btu | 3.2% | 2005 | ||||||||||||||||||||||
| Crude Oil | 2,043 thousand barrels | 1.7% | Jul-08 | ||||||||||||||||||||||
| Natural Gas - Marketed | 1,202,821 million cu ft | 6.2% | 2006 | ||||||||||||||||||||||
| Coal | 36,384 thousand short tons | NA | 2007 | ||||||||||||||||||||||
| Capacity | Colorado | Share of U.S. | Period | ||||||||||||||||||||||
| Crude Oil Refinery Capacity (as of Jan. 1) | 94,000 barrels/calendar day | 0.5% | 2008 | ||||||||||||||||||||||
| Electric Power Industry Net Summer Capability | 11,156 MW | 1.1% | 2006 | ||||||||||||||||||||||
| Net Electricity Generation | Colorado | Share of U.S. | Period | ||||||||||||||||||||||
| Total Net Electricity Generation | 3,969 thousand MWh | 1.2% | Sep-08 | ||||||||||||||||||||||
| Petroleum-Fired | 2 thousand MWh | 0.1% | Sep-08 | ||||||||||||||||||||||
| Natural Gas-Fired | 1,046 thousand MWh | 1.3% | Sep-08 | ||||||||||||||||||||||
| Coal-Fired | 2,685 thousand MWh | 1.7% | Sep-08 | ||||||||||||||||||||||
| Nuclear | — | — | Sep-08 | ||||||||||||||||||||||
| Hydroelectric | 109 thousand MWh | 0.7% | Sep-08 | ||||||||||||||||||||||
| Other Renewables | 154 thousand MWh | 1.9% | Sep-08 | ||||||||||||||||||||||
| Stocks | Colorado | Share of U.S. | Period | ||||||||||||||||||||||
| Motor Gasoline (Excludes Pipelines) | 709 thousand barrels | 1.2% | Sep-08 | ||||||||||||||||||||||
| Distillate Fuel Oil (Excludes Pipelines) | 389 thousand barrels | 0.4% | Sep-08 | ||||||||||||||||||||||
| Natural Gas in Underground Storage | 82,710 million cu ft | 1.1% | Sep-08 | ||||||||||||||||||||||
| Petroleum Stocks at Electric Power Producers | 92 thousand barrels | 0.2 % | Sep-08 | ||||||||||||||||||||||
| Coal Stocks at Electric Power Producers | 2,910 thousand tons | 2.0% | Sep-08 | ||||||||||||||||||||||
| Production Facilities | Colorado | ||||||||||||||||||||||||
| Major Coal Mines | Foidel Creek Mine/Twentymile Coal Co. • Elk Creek Mine/Oxbow Mining LLC • Colowyo Mine/Colowyo Coal Co. LP • West Elk Mine/Mountain Coal Co. LLC | ||||||||||||||||||||||||
| Petroleum Refineries | Suncor Energy (USA) Inc (Commerce City East) • Suncor Energy (USA) Inc (Commerce City West) | ||||||||||||||||||||||||
| Major Non-Nuclear Electricity Generating Plants | Craig (Tri-State G & T Assn • Inc) • Cherokee (Public Service Co of Colorado) • Fort St Vrain (Public Service Co of Colorado) • Comanche (Public Service Co of Colorado) • Rocky Mountain Energy Center (Rocky Mountain Energy Ctr LLC) | ||||||||||||||||||||||||
| Nuclear Power Plants | None | ||||||||||||||||||||||||
| Distribution & Marketing | ||||
| Distribution Centers | Colorado | |||||||||
| Oil Seaports/Oil Import Sites | None | |||||||||
| Natural Gas Market Centers | Cheyene (Market Hub) | |||||||||
| Major Pipelines | Colorado | |||||||||
| Crude Oil | Amoco • Conoco • Ultramar Diamond Shamrock • Unocal. | |||||||||
| Petroleum Product | Chase • Kaneb • Phillips • Sinclair • Ultramar-Diamond Shamrock. | |||||||||
| Liquefied Petroleum Gases | Amoco • Phillips. | |||||||||
| Interstate Natural Gas Pipelines | Colorado Interstate Gas • El Paso Natural Gas Co. • KM Interstate Gas Co. • Northwest Pipeline Corp. • Panhandle Eastern Pipeline Co. • Questar Pipeline Co. • Southern Star Central Gas Pipeline Co. • Trailblazer Pipeline Co. | |||||||||
| Fueling Stations | Colorado | Share of U.S. | Period | |||||||
| Motor Gasoline | 2,183 | 1.3% | 2007 | |||||||
| Liquefied Petroleum Gases | 55 | 2.4% | 2007 | |||||||
| Compressed Natural Gas | 20 | 2.5% | 2007 | |||||||
| Ethanol | 47 | 3.3% | 2007 | |||||||
| Other Alternative Fuels | 32 | 2.8% | 2007 | |||||||
| Consumption | ||||
| per Capita | Colorado | U.S. Rank | Period | |||||||
| Total Energy | 300 million Btu | 39 | 2006 | |||||||
| by Source | Colorado | Share of U.S. | Period | |||||||
| Total Energy | 1,428 trillion Btu | 1.4% | 2006 | |||||||
| Total Petroleum | 95,884 thousand barrels | 1.3% | 2006 | |||||||
| Motor Gasoline | 51,702 thousand barrels | 1.5% | 2006 | |||||||
| Distillate Fuel | 18,962 thousand barrels | 1.2% | 2006 | |||||||
| Liquefied Petroleum Gases | 6,503 thousand barrels | 0.9% | 2006 | |||||||
| Jet Fuel | 12,987 thousand barrels | 2.2% | 2006 | |||||||
| Natural Gas | 449,830 million cu ft | 2.0% | 2006 | |||||||
| Coal | 20,059 thousand short tons | 1.8% | 2006 | |||||||
| by End-Use Sector | Colorado | Share of U.S. | Period | |||||||
| Residential | 319,447 billion Btu | 1.5% | 2006 | |||||||
| Commercial | 286,471 billion Btu | 1.6% | 2006 | |||||||
| Industrial | 388,284 billion Btu | 1.2% | 2006 | |||||||
| Transportation | 433,941 billion Btu | 1.5% | 2006 | |||||||
| for Electricity Generation | Colorado | Share of U.S. | Period | |||||||
| Petroleum | 5 thousand barrels | 0.1% | Sep-08 | |||||||
| Natural Gas | 9,262 million cu ft | 1.5% | Sep-08 | |||||||
| Coal | 1,430 thousand short tons | 1.7% | Sep-08 | |||||||
| for Home Heating (share of households) | Colorado | U.S. Avg. | Period | |||||||
| Natural Gas | 75% | 51.2% | 2000 | |||||||
| Fuel Oil | 0% | 9.0% | 2000 | |||||||
| Electricity | 16% | 30.3% | 2000 | |||||||
| Liquefied Petroleum Gases | 6% | 6.5% | 2000 | |||||||
| Other/None | 3% | 1.8% | 2000 | |||||||
| Environment | ||||
| Special Programs | Colorado | |||||||||
| Clean Cities Coalitions | Colorado Springs • Denver • Northern Colorado | |||||||||
| Alternative Fuels | Colorado | Share of U.S. | Period | |||||||
| Alternative-Fueled Vehicles in Use | 13,773 | 2.3% | 2006 | |||||||
| Ethanol Plants | 4 | 2.8% | 2008 | |||||||
| Ethanol Plant Capacity | 125 million gal/year | 1.6% | 2008 | |||||||
| Ethanol Use in Gasohol | 84,014 thousand gal | 2.3% | 2004 | |||||||
| Electric Power Industry Emissions | Colorado | Share of U.S. | Period | |||||||
| Carbon Dioxide |
41,847,344 metric tons | 1.7% | 2006 | |||||||
| Sulfur Dioxide |
58,569 metric tons | 0.6% | 2006 | |||||||
| Nitrogen Oxide |
65,600 metric tons | 1.7% | 2006 | |||||||
| — = No data reported; NA = Not available; W = Withheld to avoid disclosure of individual company data. |
|
||||||||||||||||||||||||||||||||||||||||||||||||||||||||||||||||||||||||||||||||||||||||||||||||||||||||||||||||||||||||||||||||||||||||||||||||||||||||||||||